< template> < divclass = " ywlx" :style = " { '--height': height }" > < divclass = " header_count count_linear_bg" > < div> < spanclass = " common_count text_shadow" > </ span> </ div> < div> < spanclass = " common_count lightblue1" > </ span> </ div> </ div> < divclass = " echarts" :id = " domId" /> </ div> </ template> < script>
import { queryYwfxMonthByParam } from '@/api/screen-zhidu.js'
export default {
name : 'Ywlx' ,
components : { } ,
props : {
height : {
type : String,
default : '100%'
} ,
echartsStyle : {
type : Object,
default : ( ) => {
return {
xAxisColor : '#fff' ,
yAxisColor : '#a3bfed' ,
legendTextColor : '#88a5cb' ,
xAxis : {
axisLabel : { color : '#fff' } ,
axisLine : { show : false } ,
axisTick : { show : false }
} ,
toolTip : {
backgroundColor : '#000000c2' ,
borderColor : '#00000052' ,
textStyle : { color : '#a3bfed' }
}
}
}
}
} ,
data ( ) {
return {
Echarts : null ,
domId : 'YwlxEcharts' ,
dataList : [ ] ,
countInfo : { }
}
} ,
computed : {
options ( ) {
let xAxisData = [ '' , '' ]
let topData = [ ]
this . dataList. forEach ( ( item, index ) => {
xAxisData. splice ( index + 1 , 0 , this . $common. filter_dic ( 'dp_lszx_zd_ywlx' , item. zb_code) )
topData. push ( item. value1)
} )
return {
tooltip : {
show : false ,
trigger : 'axis' ,
... this . echartsStyle. toolTip,
formatter : ( params ) => {
var info = params. find ( ( item ) => ! ! item. data && item. data !== '-' )
let html = '<span></span>'
if ( info) {
html = ` <span style="display:inline-block;margin-right:5px;border-radius:10px;width:9px;height:9px;background-color:#1283ff"></span> ${ info. name} : ${ info. data} <br> ` }
return html
}
} ,
xAxis : [
{
type : 'category' ,
data : xAxisData,
... this . echartsStyle. xAxis,
axisLabel : {
interval : 0 ,
rotate : - 45 ,
textStyle : {
color : '#fff'
}
}
}
] ,
grid : {
top : '30' ,
left : '50' ,
right : '20' ,
bottom : '60'
} ,
yAxis : [
{
type : 'value' ,
axisLabel : {
color : this . echartsStyle. yAxisColor
} ,
splitLine : {
lineStyle : {
type : 'dashed' ,
color : this . echartsStyle. yAxisColor
} ,
show : true
}
}
] ,
series : [
{
type : 'pictorialBar' ,
barCategoryGap : '-60%' ,
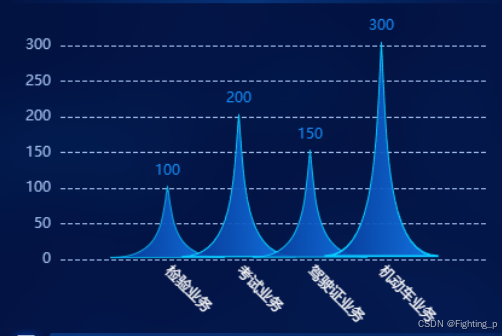
symbol : 'path://M0,10 L10,10 C5.5,10 5.5,5 5,0 C4.5,5 4.5,10 0,10 z' ,
label : {
show : true ,
formatter : '{c}' ,
position : 'top' ,
color : '#178dfa'
} ,
itemStyle : {
borderColor : '#0acaff' ,
borderWidth : 4 ,
color : new this. $echarts. graphic. LinearGradient ( 1 , 0 , 0 , 0 , [
{ offset : 0 , color : '#1378e8' } ,
{ offset : 1 , color : '#06399ade' }
] )
} ,
data : [ '-' , ... topData, '-' ]
}
]
}
}
} ,
watch : { } ,
created ( ) { } ,
mounted ( ) {
window. addEventListener ( 'resize' , this . resizeFun)
this . fetchData ( )
} ,
destroyed ( ) {
if ( this . Echarts) {
this . Echarts. dispose ( )
window. removeEventListener ( 'resize' , this . resizeFun)
}
} ,
methods : {
resizeFun ( ) {
if ( document. getElementById ( this . domId) ) {
this . Echarts = this . $echarts. init ( document. getElementById ( this . domId) )
this . Echarts. resize ( )
}
} ,
fetchData ( ) {
queryYwfxMonthByParam ( ) . then ( ( res ) => {
this . $common. CheckCode ( res, null , ( ) => {
res = {
code : 200 ,
msg : '' ,
data : {
yjv : 0.01 ,
ywlxList : [
{
month_id : '202503' ,
entry_code : '030104' ,
zb_code : 'JYYW' ,
value1 : 100 ,
value2 : 0 ,
value3 : 0
} ,
{
month_id : '202503' ,
entry_code : '030104' ,
zb_code : 'KSYW' ,
value1 : 200 ,
value2 : 0 ,
value3 : 0
} ,
{
month_id : '202503' ,
entry_code : '030104' ,
zb_code : 'JSZYW' ,
value1 : 150 ,
value2 : 0 ,
value3 : 0
} ,
{
month_id : '202503' ,
entry_code : '030104' ,
zb_code : 'JDCYW' ,
value1 : 300 ,
value2 : 0 ,
value3 : 0
}
] ,
ywzl : 97049
} ,
timestamp : 1740998003314
}
const { ywlxList, ... info } = res. data || { }
this . countInfo = info
this . dataList = ( ywlxList || [ ] ) . filter ( ( item ) => ! ! item. value1)
this . init ( )
} )
} )
} ,
init ( ) {
if ( this . Echarts) {
this . Echarts. dispose ( )
}
const dom = document. getElementById ( this . domId)
this . Echarts = this . $echarts. init ( dom)
this . Echarts. setOption ( this . options)
}
}
}
</ script> < stylelang = ' scss' scoped >
@import '../index.scss' ; .ywlx {
height : var ( --height) ;
display : flex;
flex-direction : column;
.echarts {
flex : 1;
}
}
</ style>