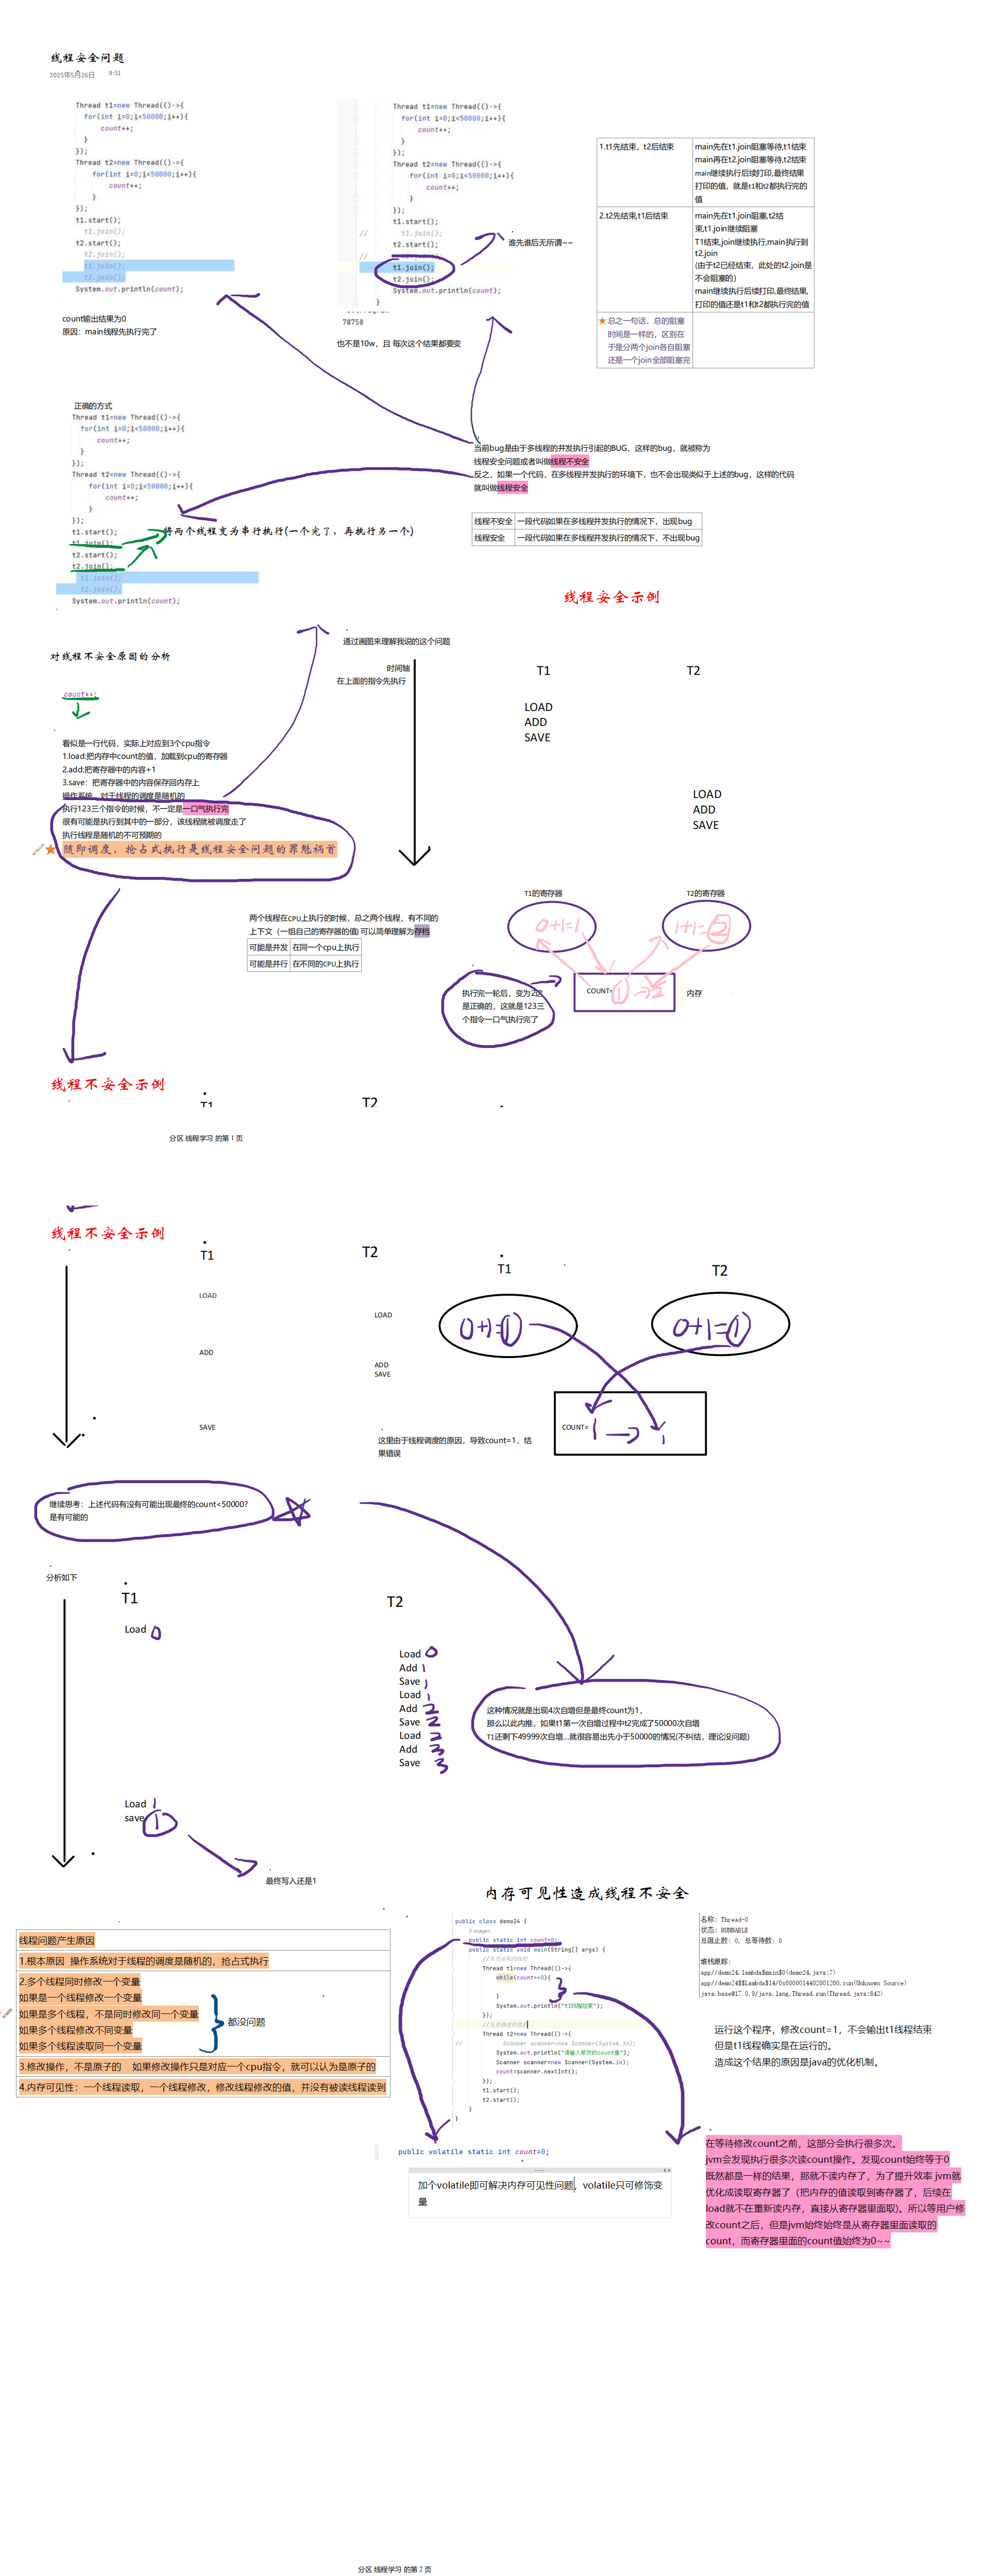
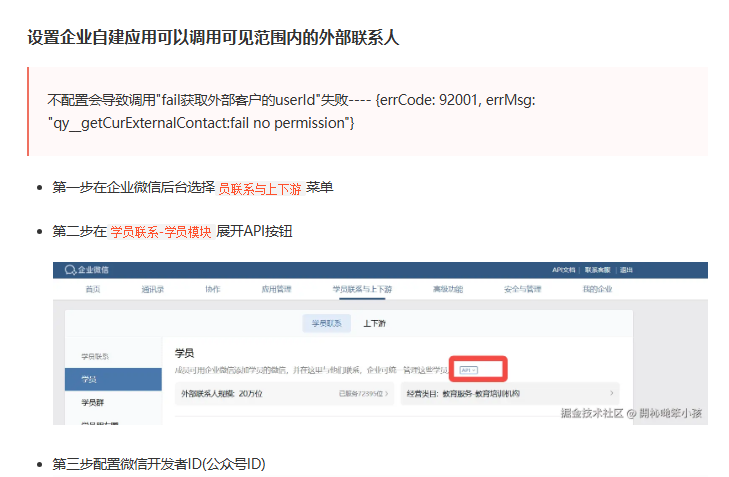
XCharts官网地址:https://xcharts-team.github.io/
本地上传资源:https://download.csdn.net/download/m0_64375864/90919669
效果图:
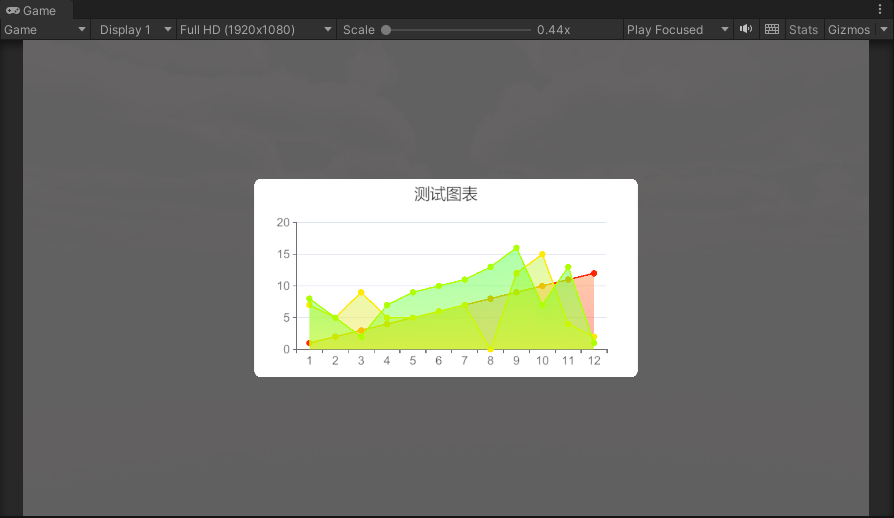
动态配置数据:
public class Test3 : MonoBehaviour
{
    public LineChart lineChart;
    public List<Color32> colorPalettes;

    public string[] strsX = new string[] { "1", "2", "3", "4", "5", "6", "7", "8", "9", "10", "11", "12" };
    public double[] valueY1 = new double[] { 1, 2, 3, 4, 5, 6, 7, 8, 9, 10, 11, 12 };
    public double[] valueY2 = new double[] { 7, 5, 9, 5, 5, 6, 7, 0, 12, 15, 4, 2 };
    public double[] valueY3 = new double[] { 8, 5, 4, 7, 9, 10, 11, 13, 16, 15, 13, 1 };
    public string[] strSers = new string[] { "第一条", "第二条", "第三条" };
    void Start()
    {
        OnSuccessMethod();
    }
    void Update()
    {
        if (Input.GetKeyDown(KeyCode.Space))
        {
            OnSuccessMethod();
        }
    }
    private void OnSuccessMethod()
    {

        lineChart.gameObject.SetActive(true);

        //清理数据
        lineChart.ClearData();
        lineChart.RemoveData();
        //添加X轴数据
        foreach (var str in strsX) // 如果所有曲线的 X 轴数据相同
        {
            lineChart.AddXAxisData(str);
        }
        lineChart.GetChartComponent<XAxis>().splitNumber = strsX.Length;
        //添加曲线
        for (int i = 0; i < strSers.Length; i++)
        {
            string serieName = strSers[i];
            lineChart.AddSerie<Line>(serieName);


            //折线属性
            lineChart.series[i].lineType = LineType.Normal;
            lineChart.series[i].symbol.type = SymbolType.None;
            lineChart.series[i].lineStyle.width = 1.2f;
            lineChart.series[i].symbol.show = true;     //折线节点
            lineChart.series[i].symbol.type = SymbolType.Circle;

            //背景
            lineChart.theme.customBackgroundColor = Color.white;
            lineChart.theme.customColorPalette = colorPalettes;
            lineChart.theme.enableCustomTheme = true;

            //标题
            lineChart.EnsureChartComponent<Title>().show = true;
            lineChart.EnsureChartComponent<Title>().text = "测试图表";
            lineChart.EnsureChartComponent<Title>().labelStyle.textStyle.color = Color.black;

            //添加填充区域
            lineChart.series[i].EnsureComponent<AreaStyle>();
            lineChart.series[i].areaStyle.show = true;
            lineChart.series[i].areaStyle.color = colorPalettes[i]; // 红色
            lineChart.series[i].areaStyle.toColor =colorPalettes[i+1]; // 黄色


            //添加数据
            Debug.Log($"当前:{serieName} 曲线数量:{strsX.Length}");
            for (int j = 0; j < strsX.Length; j++)
            {
                double value = 0;
                switch (i)
                {
                    case 0:
                        value = valueY1[j];
                        break;
                    case 1:
                        value = valueY2[j];
                        break;
                    case 2:
                        value = valueY3[j];
                        break;
                }
                lineChart.AddData(serieName, value);
            }
        }

    }
}