公众号:尤而小屋
编辑:Peter
作者:Peter
大家好,我是Peter~
Pandas 是一个强大的 Python 数据分析库,它提供了非常灵活和高效的方式来处理时间序列数据。
时间序列数据是指按照时间顺序排列的数据点集合,通常用于分析随时间变化的趋势、周期性或其他统计特性。
Pandas提供了很多的函数来处理时间序列相关的数据,比如:
- 使用 Timestamp 和 DatetimeIndex:Timestamp 表示单个时间点,而 DatetimeIndex 是由多个 Timestamp 组成的索引
- 使用 pd.date_range():快速生成时间序列的日期范围
- 使用 .resample() 方法可以对时间序列数据进行重新采样,例如从日数据转换为月数据
- 使用 DateOffset 或 Timedelta 对时间序列进行时间偏移
- 使用 .rolling() 或 .expanding() 方法进行滑动窗口或扩展窗口的计算,如计算移动平均等。
本文介绍基于pandas处理时间序列数据的基础知识:
- 时间戳对象TimeStamp
- 时间范围的生成
- 时间序列数据的生成与选择
导入库
import numpy as np
import pandas as pd
import os
import datetime
import time

np.random.seed(42)

import plotly_express as px
from plotly.subplots import make_subplots
import plotly.graph_objects as go

import matplotlib.pyplot as plt
%matplotlib inline
import seaborn as sns
sns.set_theme(style="darkgrid")


# 设置支持中文字体
plt.rcParams['font.sans-serif'] = ['SimHei']
# 设置图像标题字体
plt.rcParams['axes.unicode_minus'] = False

import warnings
warnings.filterwarnings('ignore')
时间戳Timestamp
在pandas中,时间戳(Timestamp,通常指的是自1970年1月1日(UTC)以来的秒数)是用于表示特定时间点的数据类型。它是pandas库中用于时间序列分析的一个重要组成部分,基于Python的datetime模块但提供了更丰富的功能。时间戳不仅包含日期(年、月、日),还包含时间(时、分、秒,以及可选的毫秒、微秒和纳秒)。
首先,如何获取当前时间的时间戳(秒)?
import time
time.time()
1725526309.6035366
创建时间戳对象
1、直接使用字符串创建时间戳
ts = pd.Timestamp("2024-09-03 08:30:00")
ts  # 时间戳对象
Timestamp(‘2024-09-03 08:30:00’)
2、使用datetime对象创建:将Python的datetime对象传递给Timestamp构造函数
from datetime import datetime

dt_obj = datetime(2024, 9,3,8,30)
dt_obj
datetime.datetime(2024, 9, 3, 8, 30)
ts1 = pd.Timestamp(dt_obj)
ts1
Timestamp(‘2024-09-03 08:30:00’)
可以看到生成的效果和上面是一样的。
也可以通过timestamp属性直接获取其时间戳(秒):
dt_obj.timestamp() # 具体的秒数
1725323400.0
3、使用pandas的to_datetime函数,它可以灵活地处理列表、数组、Series等数据结构中的日期字符串数据,并将它们转成时间戳对象。
ts2 = pd.to_datetime(["2024-09-03 08:30:00","2024-09-03 10:30:00","2024-09-03 12:30:00"])
ts2

DatetimeIndex(['2024-09-03 08:30:00', '2024-09-03 10:30:00','2024-09-03 12:30:00'],dtype='datetime64[ns]', freq=None)
ts2中的每个元素都是时间戳对象:
ts2[0]
Timestamp(‘2024-09-03 08:30:00’)
时间戳的属性
以ts1对象为例
ts1
Timestamp(‘2024-09-03 08:30:00’)
单独获取年、月、日、时分秒等
ts1.year # 年
2024
ts1.month # 月
9
ts1.day # 日
3
ts1.hour,ts1.minute,ts1.second # 时分秒
(8, 30, 0)
ts1.daysinmonth # 一月中的哪天
30
时间戳的方法
返回datetime.dateimte对象:
ts1.date() # 获取完整的年月日
datetime.date(2024, 9, 3)
ts1.day_of_week # 星期几(数字)
1
ts1.day_name() # 星期几(英文)
‘Tuesday’
ts1.day_of_year # 一年当中的第几天
247
ts1.time() # 获取月日
datetime.time(8, 30)
ts1.days_in_month # 该月中的第几天
30
时间范围data_range
pandas.date_range(
    start=None,
    end=None,
    periods=None,
    freq=None,
    tz=None,
    normalize=False,
    name=None,
    inclusive='both', # start和end是否全部包含:both-left-right
    unit=None)
官网地址:
https://pandas.pydata.org/pandas-docs/stable/reference/api/pandas.date_range.html
生成的是DatatimeIndex形式的数据
指定开始和截止时间
dr1 = pd.date_range(start="2024-01-01",end="2024-08-01")
dr1
    DatetimeIndex(['2024-01-01', '2024-01-02', '2024-01-03', '2024-01-04',
                   '2024-01-05', '2024-01-06', '2024-01-07', '2024-01-08',
                   '2024-01-09', '2024-01-10',
                   ...
                   '2024-07-23', '2024-07-24', '2024-07-25', '2024-07-26',
                   '2024-07-27', '2024-07-28', '2024-07-29', '2024-07-30',
                   '2024-07-31', '2024-08-01'],
                  dtype='datetime64[ns]', length=214, freq='D')
指定周期数periods
dr2 = pd.date_range(start="2024-01-01",periods=20)
dr2
    DatetimeIndex(['2024-01-01', '2024-01-02', '2024-01-03', '2024-01-04',
                   '2024-01-05', '2024-01-06', '2024-01-07', '2024-01-08',
                   '2024-01-09', '2024-01-10', '2024-01-11', '2024-01-12',
                   '2024-01-13', '2024-01-14', '2024-01-15', '2024-01-16',
                   '2024-01-17', '2024-01-18', '2024-01-19', '2024-01-20'],
                  dtype='datetime64[ns]', freq='D')
指定频率freq
默认是以天为频率:
dr3 = pd.date_range(start="2024-01-01",periods=6, freq="D")  # 年
dr3
DatetimeIndex(['2024-01-01', '2024-01-02', '2024-01-03', '2024-01-04', '2024-01-05', '2024-01-06'],dtype='datetime64[ns]', freq='D')
以月为频率,生成6个周期数的数据
dr3 = pd.date_range(start="2024-01-01",periods=6, freq="M")  # 月
dr3
DatetimeIndex(['2024-01-31', '2024-02-29', '2024-03-31', '2024-04-30','2024-05-31', '2024-06-30'],dtype='datetime64[ns]', freq='ME')
以年为频率:
dr3 = pd.date_range(start="2024-01-01",periods=6, freq="Y")  # 年
dr3
DatetimeIndex(['2024-12-31', '2025-12-31', '2026-12-31', '2027-12-31','2028-12-31', '2029-12-31'],dtype='datetime64[ns]', freq='YE-DEC')
dr3 = pd.date_range(start="2024-01-01",periods=6, freq="2Y")  # 2年
dr3
DatetimeIndex(['2024-12-31', '2026-12-31', '2028-12-31', '2030-12-31','2032-12-31', '2034-12-31'],dtype='datetime64[ns]', freq='2YE-DEC')
以星期为频率:
dr3 = pd.date_range(start="2024-01-01",periods=6, freq="W")  # 星期
dr3
    DatetimeIndex(['2024-01-07', '2024-01-14', '2024-01-21', '2024-01-28',
                   '2024-02-04', '2024-02-11'],
                  dtype='datetime64[ns]', freq='W-SUN')
dr3 = pd.date_range(start="2024-01-01",periods=6, freq="2W")  # 2星期
dr3
    DatetimeIndex(['2024-01-07', '2024-01-21', '2024-02-04', '2024-02-18',
                   '2024-03-03', '2024-03-17'],
                  dtype='datetime64[ns]', freq='2W-SUN')
freq参数不同取值的别名:
- D:Day;每日历日
- B:BussinessDay;每工作日
- H:Hour;小时
- T/min:Minute;分
- S:Second;秒
- L/ms:Milli;毫秒(秒的千分之一)
- U:Micro;微秒(秒的百分分之一)
- M:MonthEnd;每月最后一个日历日
- BM:BusinessMonthEnd;每月最后一个工作日
- MS:MonthBegin;每月第一个日历日
- BMS:BusinessMonthBegin;每月第一个工作日
- W-MON、W-TUE:Week;从指定的星期几(MON、TUE、WED等)开始算起
- WOM-1MON、WOM-2MON: WeekOfMonth;产生每月第一、第二、第三或第四周的星期几;比如,WOM-3FRI表示每月的第3个星期五
- Q-JAN、Q-FEB:QuarterEnd;对于以指定月份(JAN、FEB、MAR等)结束的年度,每季度最后一月的最后一个日历日
- BQ-JAN、BQ-FEB:BuinessQuarterEnd;对于以指定月份结束的年度,每季度最后一个月的最后一个工作日
时间标准化
有时候生成的数据是包含具体时间信息的开始或结束日期新鲜,可以通过normalize=True参数将其转化成零点的整数据:
# 默认非标准化数据

dr4 = pd.date_range(start="2024-01-01 01:25:38",periods=6, normalize=False)
dr4
    DatetimeIndex(['2024-01-01 01:25:38', '2024-01-02 01:25:38',
                   '2024-01-03 01:25:38', '2024-01-04 01:25:38',
                   '2024-01-05 01:25:38', '2024-01-06 01:25:38'],
                  dtype='datetime64[ns]', freq='D')
# 标准化数据

dr5 = pd.date_range(start="2024-01-01 01:25:38",periods=6, normalize=True)
dr5
DatetimeIndex(['2024-01-01', '2024-01-02', '2024-01-03', '2024-01-04','2024-01-05', '2024-01-06'],dtype='datetime64[ns]', freq='D')
还可以指定时区tz:
dr6 = pd.date_range(start="2024-01-01",periods=6,freq="M",tz="Asia/ShangHai")  # 月
dr6
    DatetimeIndex(['2024-01-31 00:00:00+08:00', '2024-02-29 00:00:00+08:00',
                   '2024-03-31 00:00:00+08:00', '2024-04-30 00:00:00+08:00',
                   '2024-05-31 00:00:00+08:00', '2024-06-30 00:00:00+08:00'],
                  dtype='datetime64[ns, Asia/Shanghai]', freq='ME')
dr6 = pd.date_range(start="2024-01-01",periods=6,freq="2M",tz="Asia/ShangHai")  # 2月
dr6
    DatetimeIndex(['2024-01-31 00:00:00+08:00', '2024-03-31 00:00:00+08:00',
                   '2024-05-31 00:00:00+08:00', '2024-07-31 00:00:00+08:00',
                   '2024-09-30 00:00:00+08:00', '2024-11-30 00:00:00+08:00'],
                  dtype='datetime64[ns, Asia/Shanghai]', freq='2ME')
时间范围period_range
pandas.period_range(
    start=None, # 开始和结束时间
    end=None,
    periods=None, # 周期数、频率
    freq=None,
    name=None)
注意:start、end和periods选择其中两个参数
官方地址:https://pandas.pydata.org/docs/reference/api/pandas.period_range.html
最终生成的是PeriodIndex类型的数据。
指定开始和截止时间
pr1 = pd.period_range(start="2024-01-01",end="2024-09-01")
pr1 # PeriodIndex对象
    PeriodIndex(['2024-01-01', '2024-01-02', '2024-01-03', '2024-01-04',
                 '2024-01-05', '2024-01-06', '2024-01-07', '2024-01-08',
                 '2024-01-09', '2024-01-10',
                 ...
                 '2024-08-23', '2024-08-24', '2024-08-25', '2024-08-26',
                 '2024-08-27', '2024-08-28', '2024-08-29', '2024-08-30',
                 '2024-08-31', '2024-09-01'],
                dtype='period[D]', length=245)
指定周期数periods
pr2 = pd.period_range(start="2024/01/01",periods=30) # 开始时间+周期数
pr2 # PeriodIndex对象
    PeriodIndex(['2024-01-01', '2024-01-02', '2024-01-03', '2024-01-04',
                 '2024-01-05', '2024-01-06', '2024-01-07', '2024-01-08',
                 '2024-01-09', '2024-01-10', '2024-01-11', '2024-01-12',
                 '2024-01-13', '2024-01-14', '2024-01-15', '2024-01-16',
                 '2024-01-17', '2024-01-18', '2024-01-19', '2024-01-20',
                 '2024-01-21', '2024-01-22', '2024-01-23', '2024-01-24',
                 '2024-01-25', '2024-01-26', '2024-01-27', '2024-01-28',
                 '2024-01-29', '2024-01-30'],
                dtype='period[D]')
pr3 = pd.period_range(end="2024-01-01",periods=30) # 截止时间+周期数
pr3 # PeriodIndex对象
    PeriodIndex(['2023-12-03', '2023-12-04', '2023-12-05', '2023-12-06',
                 '2023-12-07', '2023-12-08', '2023-12-09', '2023-12-10',
                 '2023-12-11', '2023-12-12', '2023-12-13', '2023-12-14',
                 '2023-12-15', '2023-12-16', '2023-12-17', '2023-12-18',
                 '2023-12-19', '2023-12-20', '2023-12-21', '2023-12-22',
                 '2023-12-23', '2023-12-24', '2023-12-25', '2023-12-26',
                 '2023-12-27', '2023-12-28', '2023-12-29', '2023-12-30',
                 '2023-12-31', '2024-01-01'],
                dtype='period[D]')
指定频率freq
# 按月生成数据
pr4 = pd.period_range(start="2020-01-01",end="2024-01-01",freq="M")
pr4 # PeriodIndex对象
    PeriodIndex(['2020-01', '2020-02', '2020-03', '2020-04', '2020-05', '2020-06',
                 '2020-07', '2020-08', '2020-09', '2020-10', '2020-11', '2020-12',
                 '2021-01', '2021-02', '2021-03', '2021-04', '2021-05', '2021-06',
                 '2021-07', '2021-08', '2021-09', '2021-10', '2021-11', '2021-12',
                 '2022-01', '2022-02', '2022-03', '2022-04', '2022-05', '2022-06',
                 '2022-07', '2022-08', '2022-09', '2022-10', '2022-11', '2022-12',
                 '2023-01', '2023-02', '2023-03', '2023-04', '2023-05', '2023-06',
                 '2023-07', '2023-08', '2023-09', '2023-10', '2023-11', '2023-12',
                 '2024-01'],
                dtype='period[M]')
#  W-SAT表示周期的频率为每周六(SAT),即每个周期间隔一周,且周期开始于周六

pr5 = pd.period_range(start="2020-01-01",freq="W-SAT",periods=10)
pr5
    PeriodIndex(['2019-12-29/2020-01-04', '2020-01-05/2020-01-11',
                 '2020-01-12/2020-01-18', '2020-01-19/2020-01-25',
                 '2020-01-26/2020-02-01', '2020-02-02/2020-02-08',
                 '2020-02-09/2020-02-15', '2020-02-16/2020-02-22',
                 '2020-02-23/2020-02-29', '2020-03-01/2020-03-07'],
                dtype='period[W-SAT]')
时间序列
基于时间序列索引生成时间序列的Series或者DataFrame数据:
简单的线性时间序列数据
s1 = pd.Series(data=np.arange(1000),index=pd.date_range(start="2022-08-01", periods=1000))
s1
    2022-08-01      0
    2022-08-02      1
    2022-08-03      2
    2022-08-04      3
    2022-08-05      4
                 ...
    2025-04-22    995
    2025-04-23    996
    2025-04-24    997
    2025-04-25    998
    2025-04-26    999
    Freq: D, Length: 1000, dtype: int32
查看索引信息:
s1.index
    DatetimeIndex(['2022-08-01', '2022-08-02', '2022-08-03', '2022-08-04',
                   '2022-08-05', '2022-08-06', '2022-08-07', '2022-08-08',
                   '2022-08-09', '2022-08-10',
                   ...
                   '2025-04-17', '2025-04-18', '2025-04-19', '2025-04-20',
                   '2025-04-21', '2025-04-22', '2025-04-23', '2025-04-24',
                   '2025-04-25', '2025-04-26'],
                  dtype='datetime64[ns]', length=1000, freq='D')
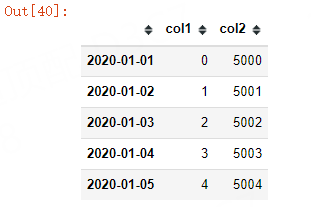
也可以用于生成DataFrame的数据:
df1 = pd.DataFrame({"col1": np.arange(5000),"col2": np.arange(5000,10000)},
                   index=pd.date_range(start="2020-01-01",periods=5000)
                  )
df1.head()
df1.index[:5]
DatetimeIndex(['2020-01-01', '2020-01-02', '2020-01-03', '2020-01-04','2020-01-05'],dtype='datetime64[ns]', freq='D')
# 基于plotly的可视化
# fig = px.scatter(df1,y=["col1","col2"])
# fig.show()
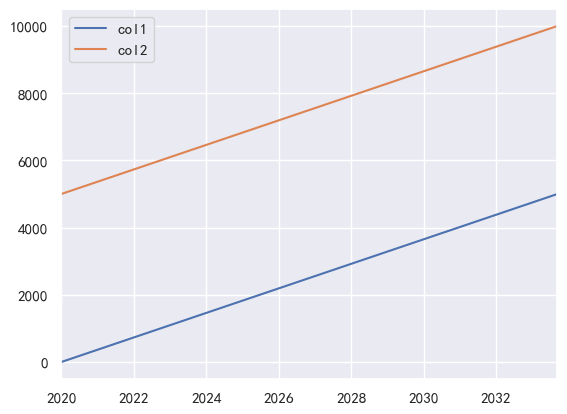
df1.plot()
plt.show()
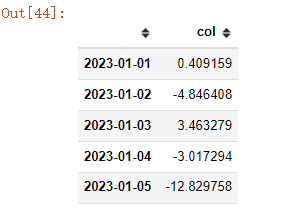
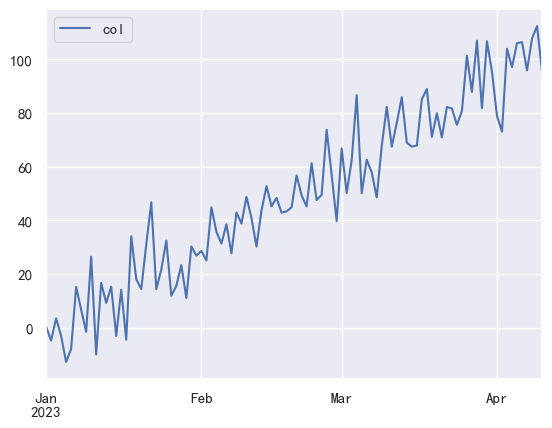
具有随机噪声的时间序列数据
# 索引
index = pd.date_range("2023-01-01",periods=100)

# 基础线性数据
base = np.linspace(0,100,100)
# 添加随机噪声
np.random.seed()
noise = np.random.normal(0,10,100)  # 均值为0-标准差为10的正态分布噪声数据

# 时间序列数据
df2 = pd.DataFrame({"col": base + noise}, index=index)
df2
# fig = px.scatter(df2,y="col")
# fig.show()
df2.plot()
plt.show()
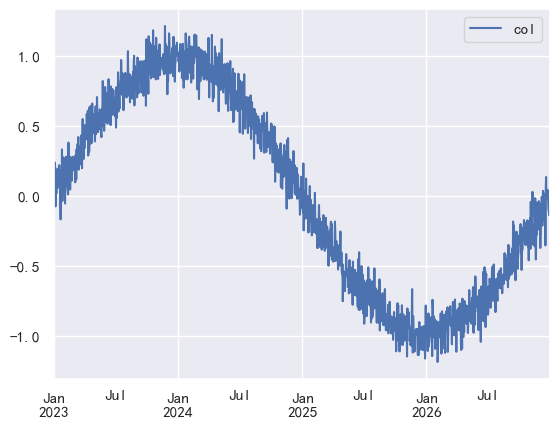
生成周期性时间序列数据
365*4
1460
# 设置时间范围
index = pd.date_range('2023-01-01', periods=1460)

# 生成基础数据
base = np.sin(np.linspace(0, 2 * np.pi, 1460))  # 生成一年的正弦波
# 添加随机噪声
np.random.seed(0)
noise = np.random.normal(0, 0.1, 1460)

# 生成时间序列数据
df3 = pd.DataFrame({"col": base + noise}, index=index)
df3

# fig = px.scatter(df3,y="col")
# fig.show()
基于pandas内置的可视化功能:
df3.plot()

plt.show()
选择时间序列数据
从时间序列数据中选择指定条件下的数据
s1
    2022-08-01      0
    2022-08-02      1
    2022-08-03      2
    2022-08-04      3
    2022-08-05      4
                 ...
    2025-04-22    995
    2025-04-23    996
    2025-04-24    997
    2025-04-25    998
    2025-04-26    999
    Freq: D, Length: 1000, dtype: int32
s1[2] # 索引为2的数据
2
s1["2022-08-05"] # 选择2022年8月5号的数据
4
s1["2022"] # 选择2022年全部数据
    2022-08-01      0
    2022-08-02      1
    2022-08-03      2
    2022-08-04      3
    2022-08-05      4
                 ...
    2022-12-27    148
    2022-12-28    149
    2022-12-29    150
    2022-12-30    151
    2022-12-31    152
    Freq: D, Length: 153, dtype: int32
s1["2022-08"]  # 选择2022年8月份的全部数据

# s1.loc["2022-08"]  # 等效功能
    2022-08-01     0
    2022-08-02     1
    2022-08-03     2
    2022-08-04     3
    2022-08-05     4
    2022-08-06     5
    2022-08-07     6
    2022-08-08     7
    2022-08-09     8
    2022-08-10     9
    2022-08-11    10
    2022-08-12    11
    2022-08-13    12
    2022-08-14    13
    2022-08-15    14
    2022-08-16    15
    2022-08-17    16
    2022-08-18    17
    2022-08-19    18
    2022-08-20    19
    2022-08-21    20
    2022-08-22    21
    2022-08-23    22
    2022-08-24    23
    2022-08-25    24
    2022-08-26    25
    2022-08-27    26
    2022-08-28    27
    2022-08-29    28
    2022-08-30    29
    2022-08-31    30
    Freq: D, dtype: int32
s1[datetime(2024,1,1):] # 选2024-1-1之后的全部数据
    2024-01-01    518
    2024-01-02    519
    2024-01-03    520
    2024-01-04    521
    2024-01-05    522
                 ...
    2025-04-22    995
    2025-04-23    996
    2025-04-24    997
    2025-04-25    998
    2025-04-26    999
    Freq: D, Length: 482, dtype: int32
s1["2022-08-01":"2022-08-08"] # 选择指定时间段内的数据
    2022-08-01    0
    2022-08-02    1
    2022-08-03    2
    2022-08-04    3
    2022-08-05    4
    2022-08-06    5
    2022-08-07    6
    2022-08-08    7
    Freq: D, dtype: int32
s1.truncate(after="2023-04") # 选择截止到2023-04-01的数据
    2022-08-01      0
    2022-08-02      1
    2022-08-03      2
    2022-08-04      3
    2022-08-05      4
                 ...
    2023-03-28    239
    2023-03-29    240
    2023-03-30    241
    2023-03-31    242
    2023-04-01    243
    Freq: D, Length: 244, dtype: int32