import numpy as np
import matplotlib.pyplot as plt
from sklearn.datasets import make_blobs
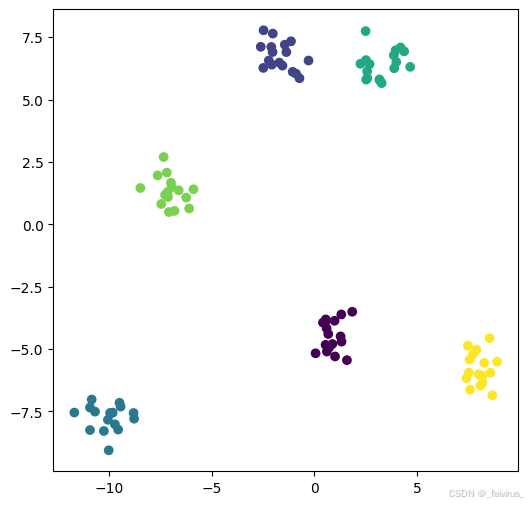
1.数据预处理
x, y = make_blobs(n_samples=100, centers=6, random_state=100, cluster_std=0.6)
plt.figure(figsize=(6,6))
plt.scatter(x[:,0], x[:,1],c = y)
plt.show
<function matplotlib.pyplot.show(close=None, block=None)>
2.模型实现
from scipy.spatial.distance import cdist
class KMeansModel():
def __init__(self, k_cluster=6, max_iteration=100, centroids=[]):
self.k_cluster = k_cluster
self.max_iteration = max_iteration
self.centroids = np.array(centroids, dtype = np.float32)
def fit(self, points):
if(self.centroids.shape==(0,)):
self.centroids = points[np.random.randint(0, points.shape[0], self.k_cluster), :]
for i in range(self.max_iteration):
distances = cdist(points, self.centroids)
c_index = np.argmin(distances, axis=1)
if(i == 0):
print("c shape", c_index.shape,c_index[0])
for i in range(self.k_cluster):
if i in c_index:
self.centroids[i] = np.mean(points[c_index == i], axis=0)
def predict(self, points):
distances = cdist(points, self.centroids)
c_index = np.argmin(distances, axis=1)
return c_index
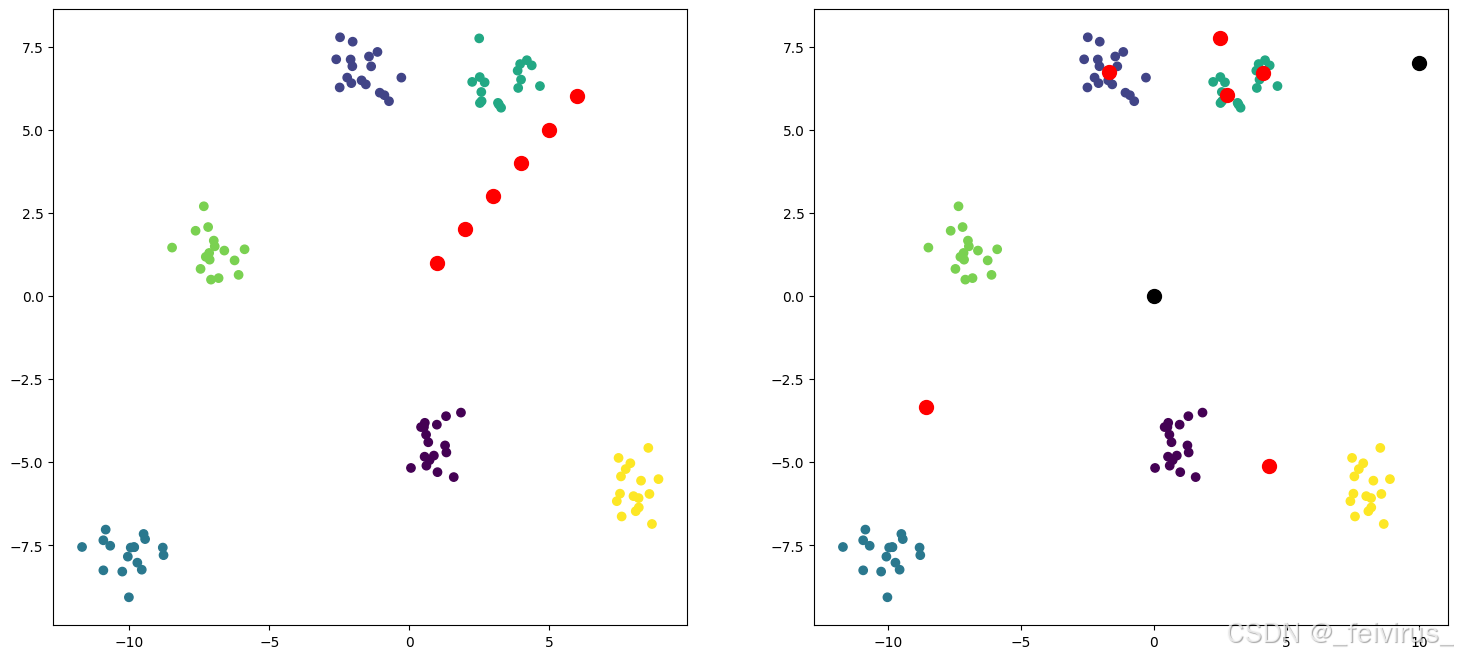
3.测试
def plot_kmeans(x, y, centroids, subplot):
plt.subplot(subplot)
plt.scatter(x[:,0], x[:,1], c=y)
plt.scatter(centroids[:,0], centroids[:,1],s=100,c='r')
kmean_model = KMeansModel(centroids=np.array([[1,1],[2,2],[3,3],[4,4],[5,5],[6,6]]))
plt.figure(figsize=(18,8))
plot_kmeans(x, y, kmean_model.centroids, 121)
kmean_model.fit(x)
print(kmean_model.centroids)
plot_kmeans(x, y, kmean_model.centroids, 122)
x_new = np.array([[10,7],[0,0]])
y_predict = kmean_model.predict(x_new)
print("predict y ", y_predict)
plt.scatter(x_new[:,0],x_new[:,1],s=100, c= "black")
c shape (100,) 0
[[ 4.343336  -5.112518 ]
 [-1.6609049  6.7436223]
 [-8.57988   -3.3460388]
 [ 2.7469435  6.05025  ]
 [ 2.490612   7.7450833]
 [ 4.1287684  6.6914167]]
predict y  [5 3]


<matplotlib.collections.PathCollection at 0x1576e5a9850>


![nginx: [emerg] unknown “connection_upgrade“ variable 解决与思考](https://i-blog.csdnimg.cn/direct/7d411d1ba0874e81a3d65863fcfc6a8b.png)