本节重点介绍 :
- blackbox_exporter grafana大盘导入和查看
- 告警配置讲解
grafana大盘
grafana 上导入 blackbox_exporter dashboard
- 地址 https://grafana.com/grafana/dashboards/13659
- 举例图片
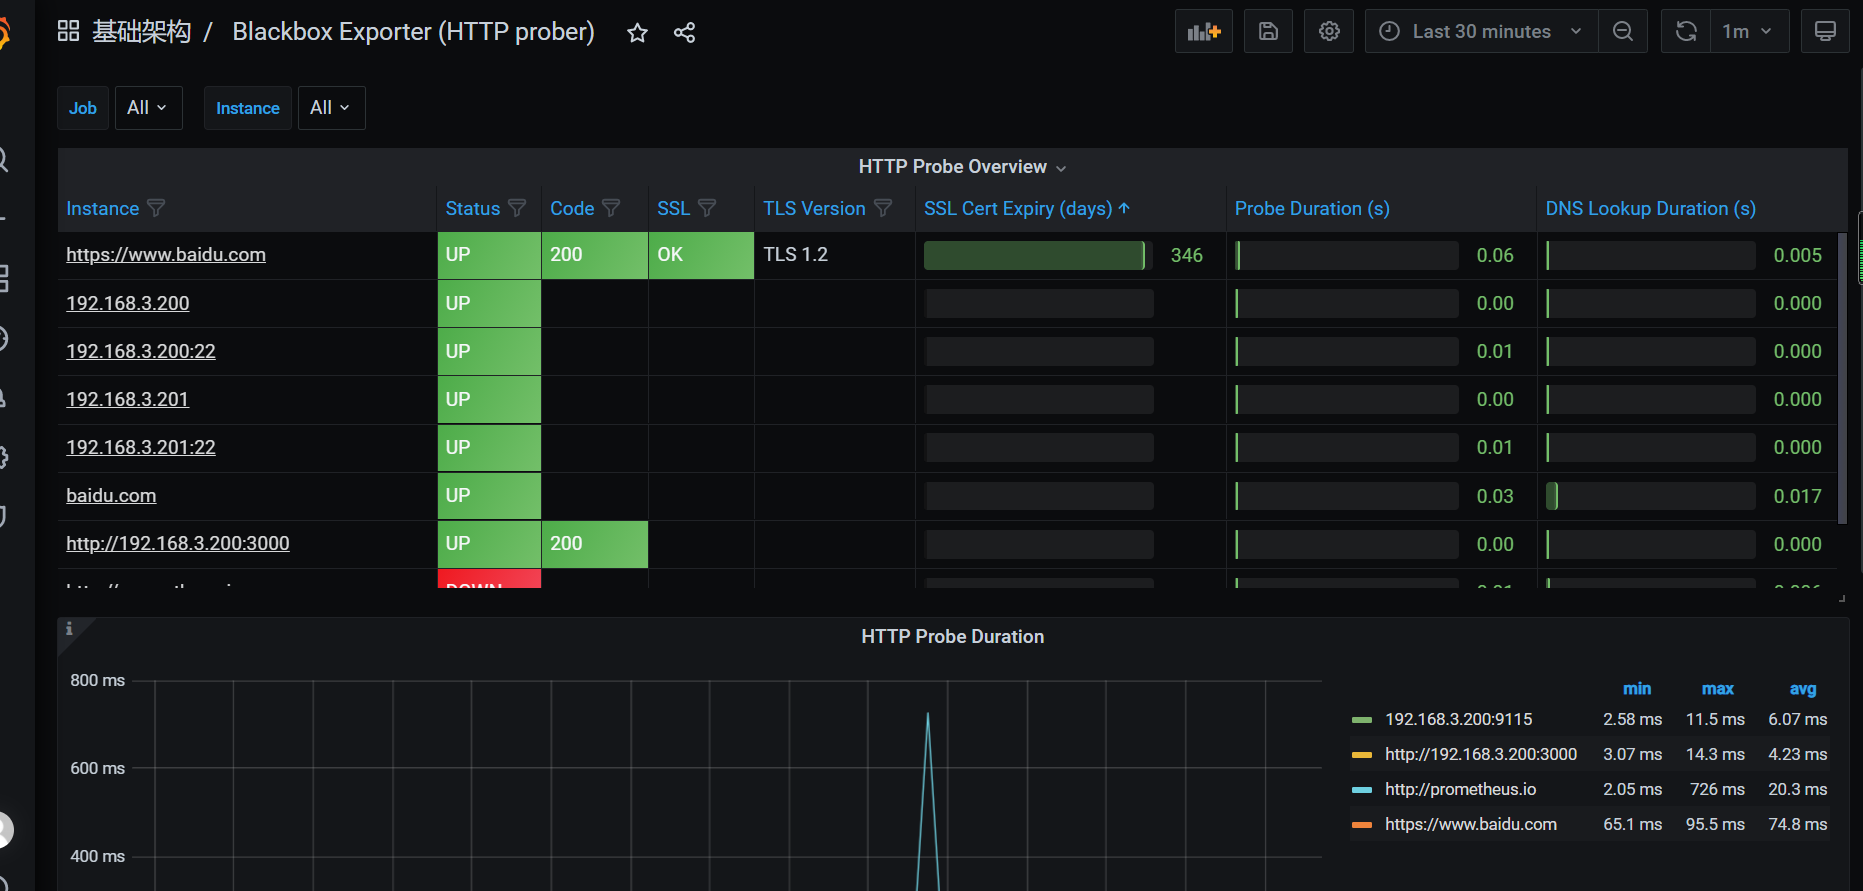
- http总览图
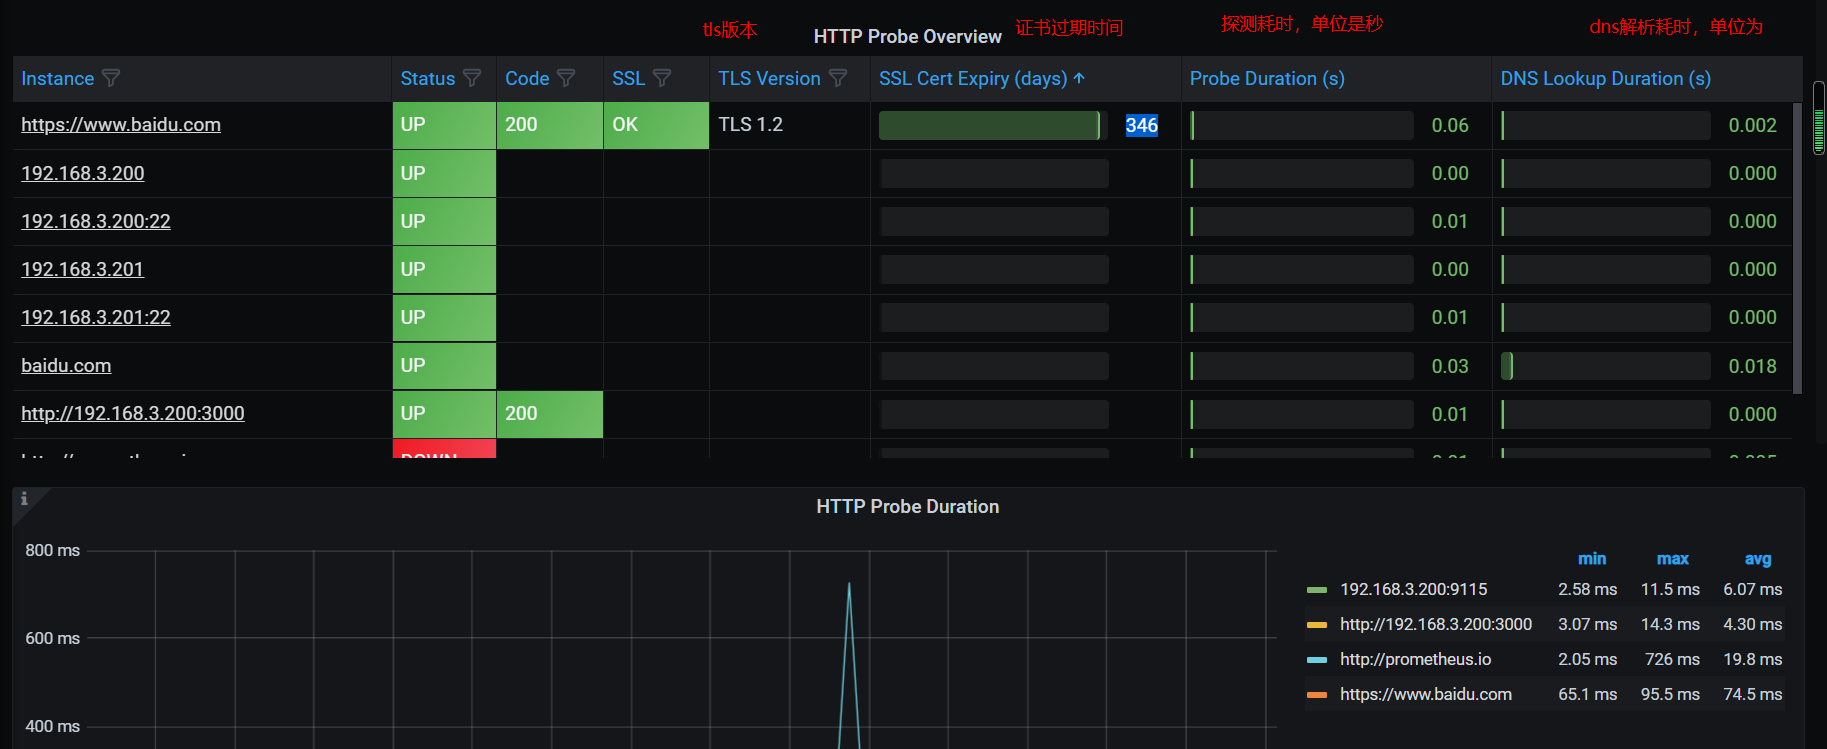
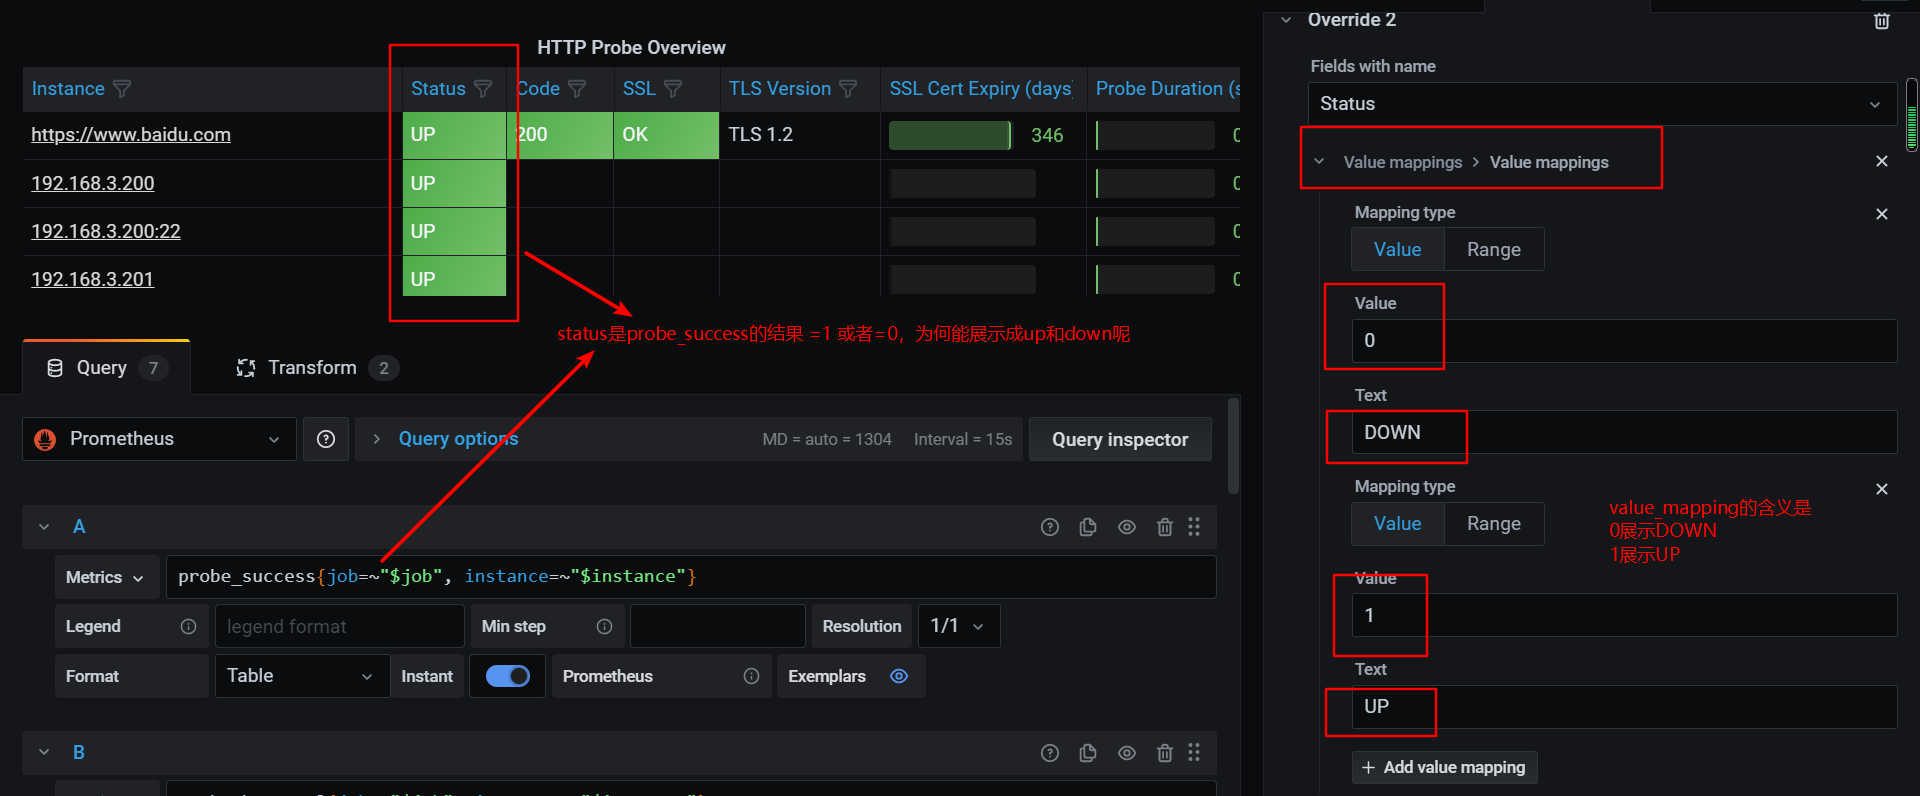
- value_mapping设置 展示
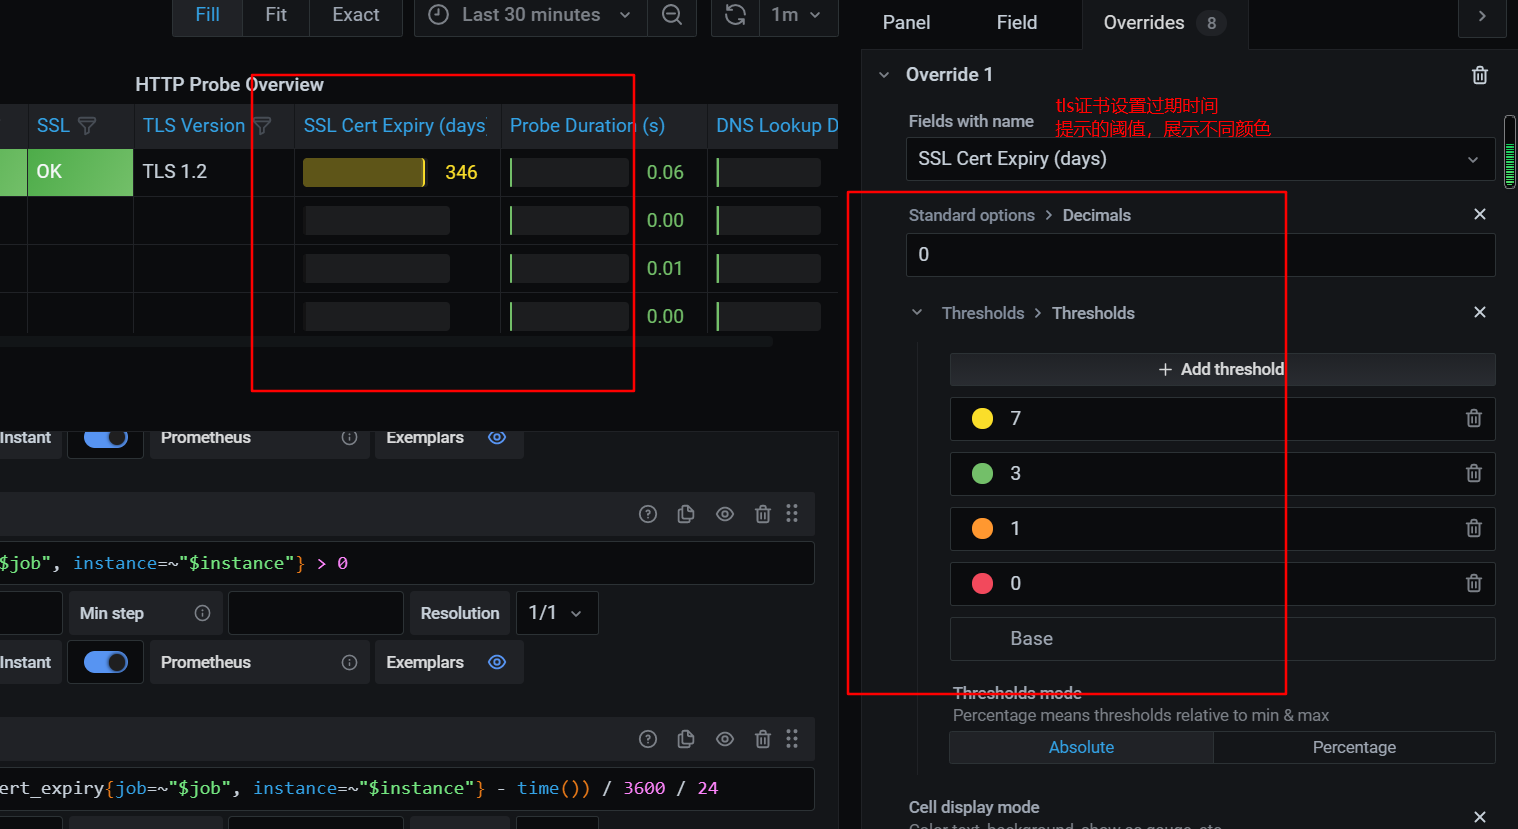
- 设置阈值,展示不同背景色
告警配置讲解
所有模块都适用的
- 探测失败
probe_success ==0 - 探测时间阈值
probe_duration_seconds > 5 - dns解析时间超过5秒
probe_dns_lookup_time_seconds > 5
http模块
- http接口返回状态码4xx/5xx错误
probe_http_status_code >=400 - https证书过期时间小于7天
(probe_ssl_earliest_cert_expiry - time()) / 3600 / 24 <7 - http探测连接耗时大于5秒
probe_http_duration_seconds{phase="connect"} >5 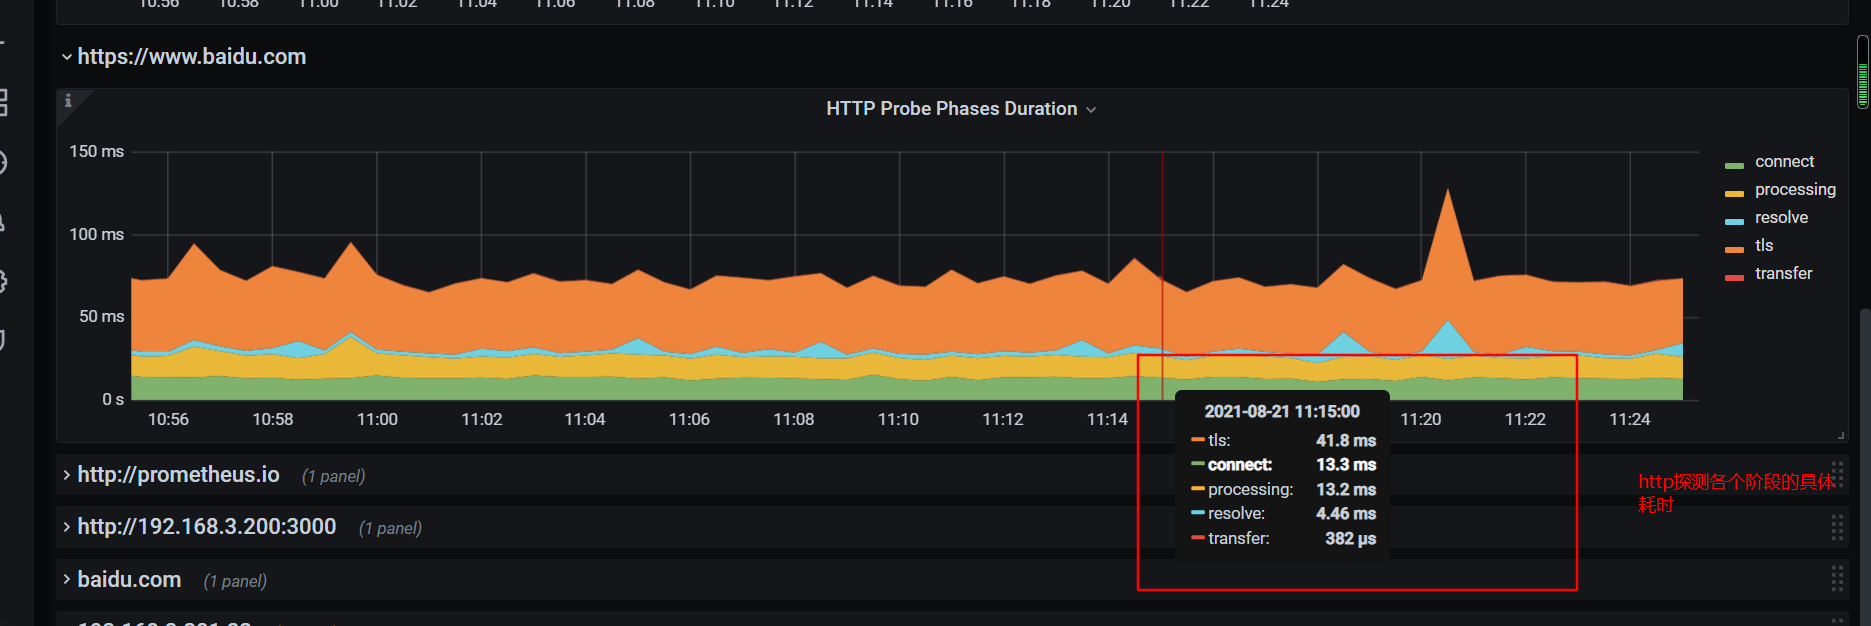
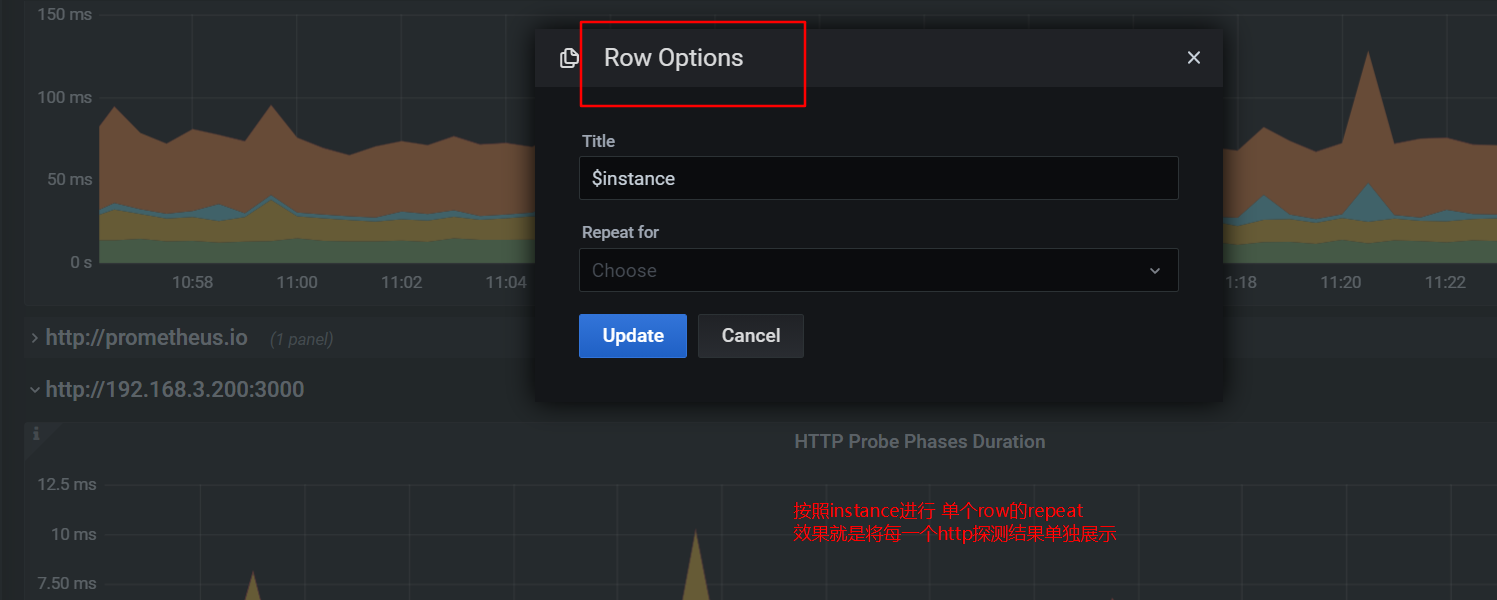
根据instance 进行row的repeat
本节重点总结 :
- blackbox_exporter grafana大盘导入和查看
- 告警配置讲解