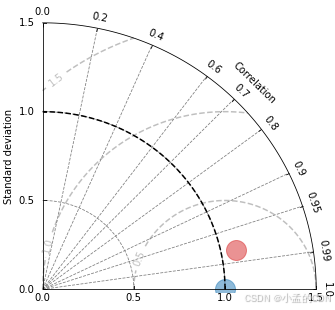
matplotlib绘制泰勒雷达图
import matplotlib. pyplot as plt
import numpy as np
from numpy. core. fromnumeric import shape
import pandas as pd
import dask. dataframe as dd
from matplotlib. projections import PolarAxes
import mpl_toolkits. axisartist. floating_axes as FA
import mpl_toolkits. axisartist. grid_finder as GF
from matplotlib. transforms import Affine2D
class TaylorDiagram :
"""
ref: pandas.DataFrame one column
samples: pandas.DataFrame multiple columns
"""
def __init__ ( self, ax, ref, samples, Normalize= False , markers= [ ] , colors= [ ] , scale= 1.2 , ms= 10 , pkwargs= { } ) :
self. points = [ ]
self. Normalize = Normalize
self. pkwargs = pkwargs
self. markers = markers if len ( markers) else [ 'o' , 'o' , 's' , 'v' , 'o' , 's' , 'v' ] * 100
self. colors = colors if len ( colors) else [ 'tab:blue' , 'tab:red' , 'tab:red' , 'tab:red' , 'tab:green' , 'tab:green' , 'tab:green' , '#1abc9c' , '#2ecc71' , '#3498db' , '#9b59b6' , '#34495e' ]
self. ms = ms
self. ref = ref
self. scale = scale
self. samples = samples
self. fig = plt. gcf( )
self. step_up( ax)
self. plot_sample( )
def calc_loc ( self, x, y) :
R = x. corr( other= y, method= 'pearson' )
theta = np. arccos( R)
r = y. std( )
return theta, r / self. _refstd if self. Normalize else r
def step_up ( self, ax) :
ax. axis( 'off' )
ll, bb, ww, hh = ax. get_position( ) . bounds
tr = PolarAxes. PolarTransform( )
Rlocs = np. array( [ 0 , 0.2 , 0.4 , 0.6 , 0.7 , 0.8 , 0.9 , 0.95 , 0.99 , 1 ] )
Tlocs = np. arccos( Rlocs)
gl1 = GF. FixedLocator( Tlocs)
tf1 = GF. DictFormatter( dict ( zip ( Tlocs, map ( str , Rlocs) ) ) )
self. _refstd = self. ref. std( )
self. stdmax = max ( [ self. samples[ col] . std( ) for col in self. samples. columns] + [ self. _refstd] )
self. Smax = ( 1 if self. Normalize else self. stdmax) * self. scale
self. refstd = 1 if self. Normalize else self. _refstd
Slocs = np. linspace( 0 , self. Smax, 4 )
gl2 = GF. FixedLocator( Slocs)
tf2 = GF. DictFormatter( dict ( zip ( Slocs, map ( lambda i: '%.1f' % i, Slocs) ) ) )
grid_helper = FA. GridHelperCurveLinear(
tr, extremes= ( 0 , np. pi / 2 , 0 , self. Smax) ,
grid_locator1= gl1, tick_formatter1= tf1,
grid_locator2= gl2, tick_formatter2= tf2,
)
ax = self. fig. add_axes( [ ll, bb, ww, hh] , facecolor= 'none' , axes_class= FA. FloatingAxes, grid_helper= grid_helper)
ax. axis[ "top" ] . set_axis_direction( "bottom" )
ax. axis[ "top" ] . toggle( ticklabels= True , label= True )
ax. axis[ "top" ] . major_ticklabels. set_axis_direction( "top" )
ax. axis[ "top" ] . label. set_axis_direction( "top" )
ax. axis[ "top" ] . label. set_text( "Correlation" )
ax. axis[ "top" ] . major_ticklabels. set_pad( 8 )
ax. axis[ "left" ] . set_axis_direction( "bottom" )
ax. axis[ "left" ] . toggle( ticklabels= True )
ax. axis[ "right" ] . set_axis_direction( "top" )
ax. axis[ "right" ] . toggle( ticklabels= True , label= True )
ax. axis[ "right" ] . label. set_text( "Standard deviation" )
ax. axis[ "right" ] . major_ticklabels. set_axis_direction( "left" )
ax. axis[ "right" ] . major_ticklabels. set_pad( 8 )
ax. axis[ 'bottom' ] . set_visible( False )
ax. grid( linestyle= '--' , color= 'gray' )
self. _ax = ax
self. ax = ax. get_aux_axes( tr)
t = np. linspace( 0 , np. pi/ 2 )
r = np. zeros_like( t) + self. refstd
self. ax. plot( t, r, 'k--' )
rs, ts = np. meshgrid( np. linspace( 0 , self. Smax, 100 ) , np. linspace( 0 , np. pi/ 2 , 100 ) )
rms = ( self. refstd** 2 + rs** 2 - 2 * self. refstd* rs* np. cos( ts) ) ** 0.5
contours = self. ax. contour( ts, rs, rms, levels= np. linspace( 0 , self. scale, 4 ) if self. Normalize else 4 ,
colors= 'gray' , linestyles= '--' , alpha= .5 )
self. ax. clabel( contours, contours. levels, inline= True , fmt= '%.1f' , fontsize= 10 )
p, = self. ax. plot( 0 , self. refstd, linestyle= '' , marker= self. markers[ 0 ] , color= self. colors[ 0 ] ,
markersize= self. ms, alpha= 0.5 , ** self. pkwargs)
p. set_label( self. ref. name)
p. set_clip_on( True )
self. points. append( p)
def plot_sample ( self) :
stds = [ ]
for col, marker, color in zip ( self. samples. columns, self. markers[ 1 : ] , self. colors[ 1 : ] ) :
t, s = self. calc_loc( self. ref, self. samples[ col] )
p, = self. ax. plot( t, s, linestyle= '' , marker= marker, color= color,
markersize= self. ms, alpha= .5 , ** self. pkwargs)
p. set_label( col)
self. points. append( p)
stds. append( s)
self. ax. set_xlim( xmax= max ( stds) )
def add_legend ( self) :
ll, bb, ww, hh = self. ax. get_position( ) . bounds
self. ax. legend( ncol= len ( self. samples) + 1 ,
loc= 'lower center' ,
frameon= False ,
bbox_to_anchor= ( ll, bb - hh* 0.3 , ww, hh* 0.1 ) )
if __name__ == "__main__" :
print ( 'read data' )
df = pd. read_csv( r'C:\Users\Administrator\Desktop\123.csv' )
fig, axes = plt. subplots( 1 , 1 , figsize= ( 5 , 5 ) )
td = TaylorDiagram( axes, df. iloc[ : , 0 ] , df. iloc[ : , 1 : ] , ms= 20 , Normalize= True , scale= 1.5 )
plt. show( )