Python拥有很多优秀的三维图像可视化工具,主要基于图形处理库WebGL、OpenGL或者VTK。
这些工具主要用于大规模空间标量数据、向量场数据、张量场数据等等的可视化,实际运用场景主要在海洋大气建模、飞机模型设计、桥梁设计、电磁场分析等等。
本文简单介绍几个Python三维图像可视化工具,工具都有大量demo、完善的使用文档、功能非常强大,系统学习可戳文中链接。
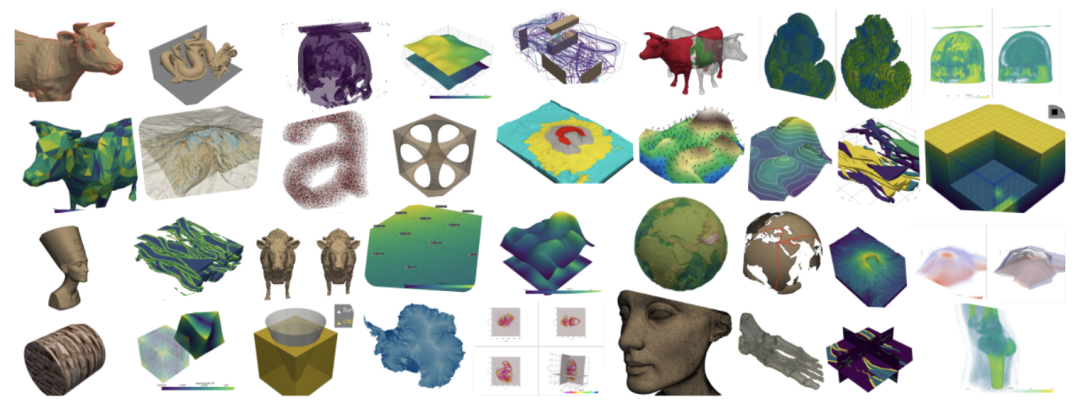
pyvista
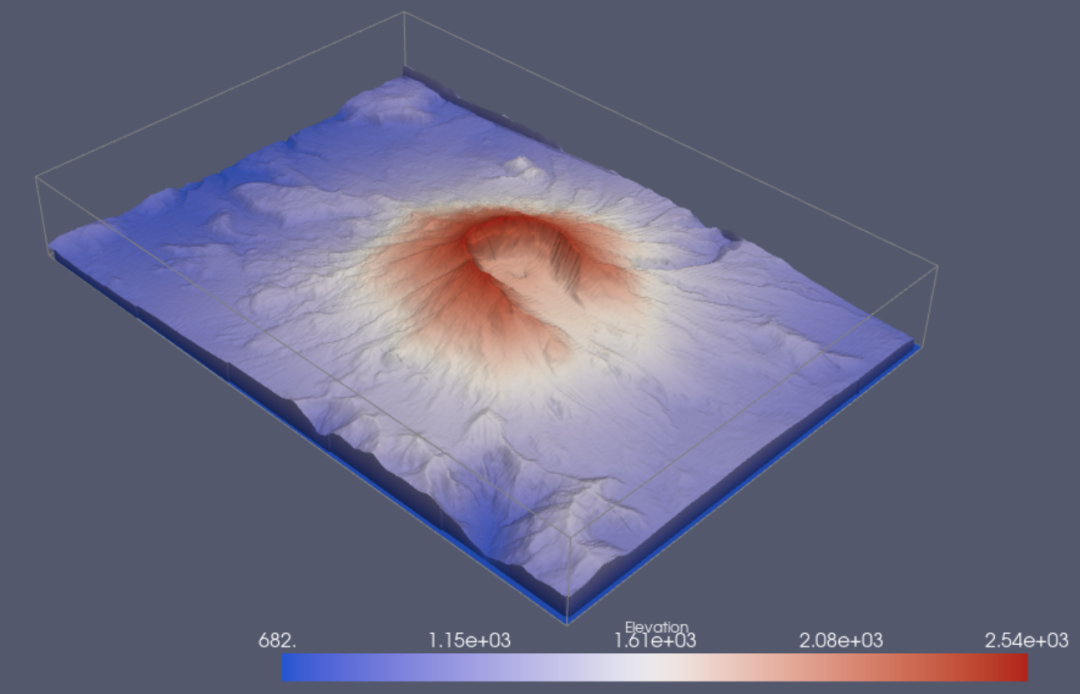
专注于3D可视化和mesh分析,底层是VTK👉[VTK: 三维图像处理和可视化利器]
Orbiting1
Orbiting1

支持GIF/MP4小电影
支持多种主题配色

支持多种主题配色
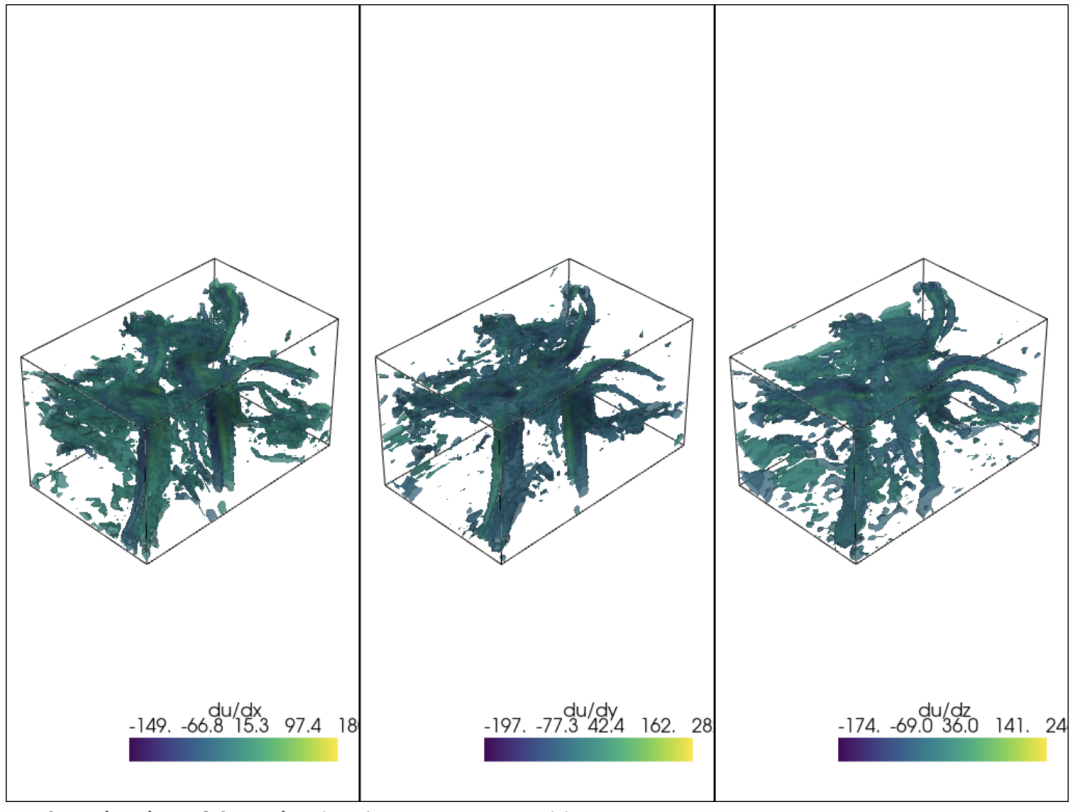
Compute Gradients of a Field
Add Background

Plot with Opacity
more…
项目地址:https://github.com/pyvista/pyvista
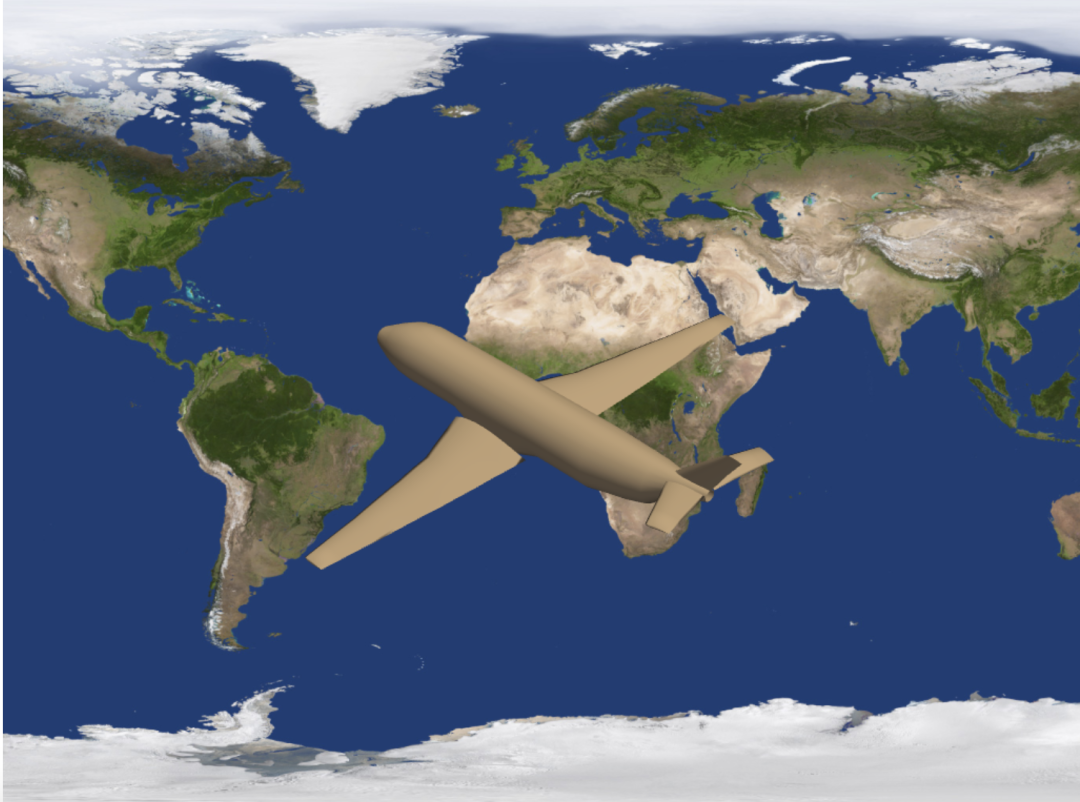
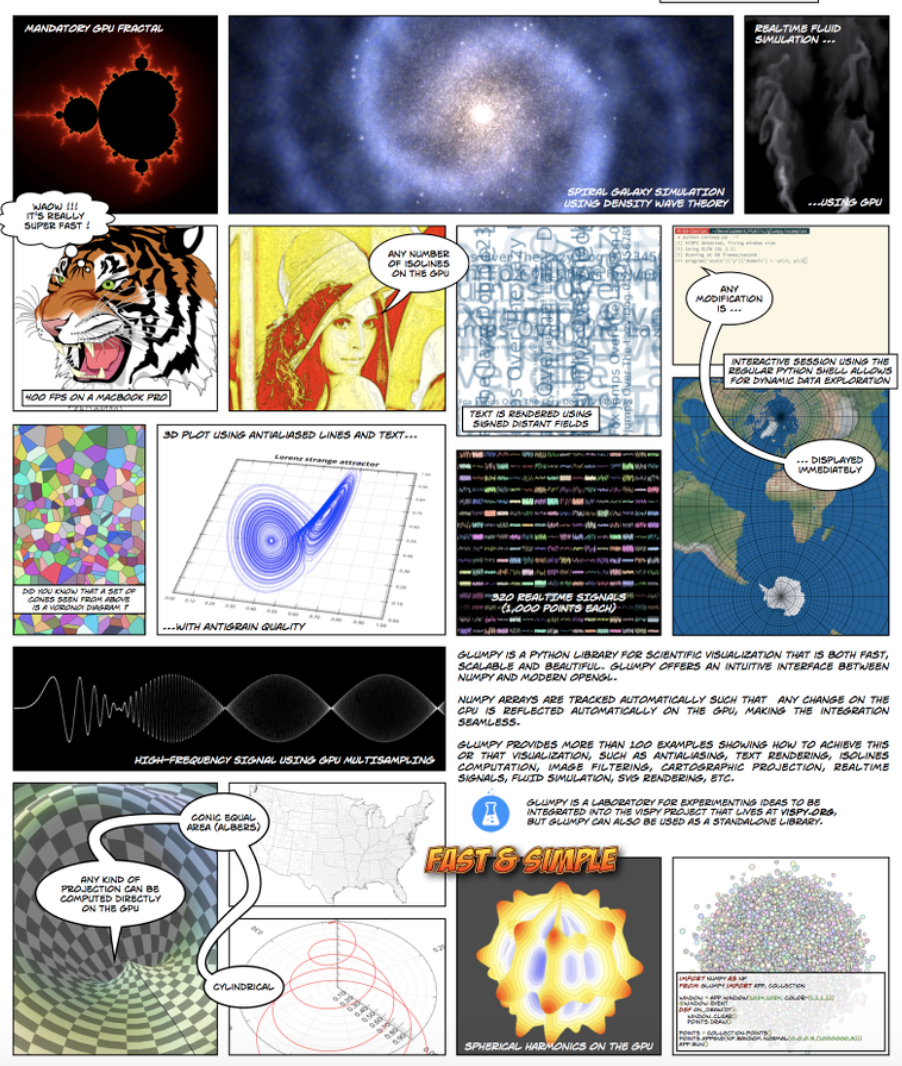
Glumpy
作者为Nicolas P. Rougier,Glumpy是Python、Numpy和OpenGL的完美结合,支持GPU加速,让可视化变得快速、美观、动态、可交互等。
银河系动态模拟

3D曲面图
more…
项目地址:https://github.com/glumpy/glumpy
itkwidgets
itkwidgets是Jupyter的一个交互式小部件,主要运用于可视化图像、点集和mesh。
小demo
项目地址:https://github.com/InsightSoftwareConsortium/itkwidgets
vedo
几行代码实现3D point clouds, meshes and volumes
1D, 2D and 3D histogramming

more…
项目地址:https://github.com/marcomusy/vedo
ipyvolume
可在Jupyter Notebook中渲染3D图,基于WebGL,功能较少。
小demo
项目地址:https://github.com/widgetti/ipyvolume
mayavi
 mayavi主要有两大部分功能:
-
mayavi.mlab用于处理图形可视化和图形操作,类似于matlab和matplotlib; -
mayavi.tools.pipeline用于操作管线对象窗口对象。
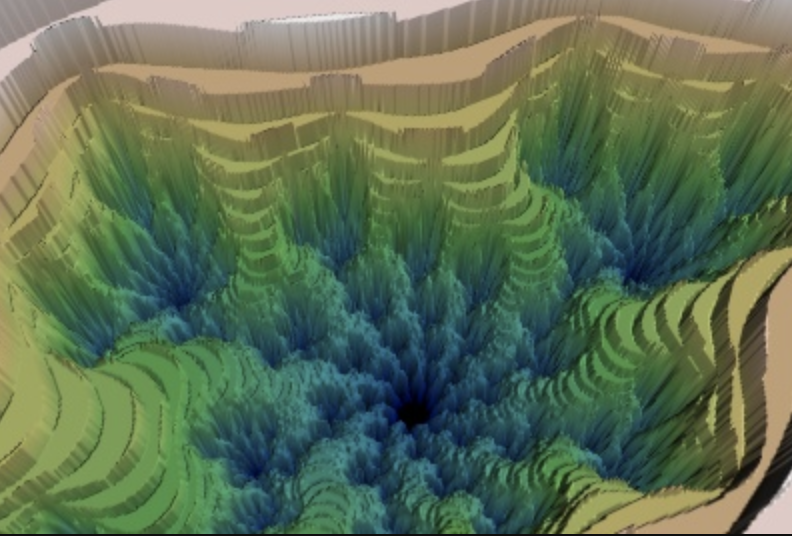
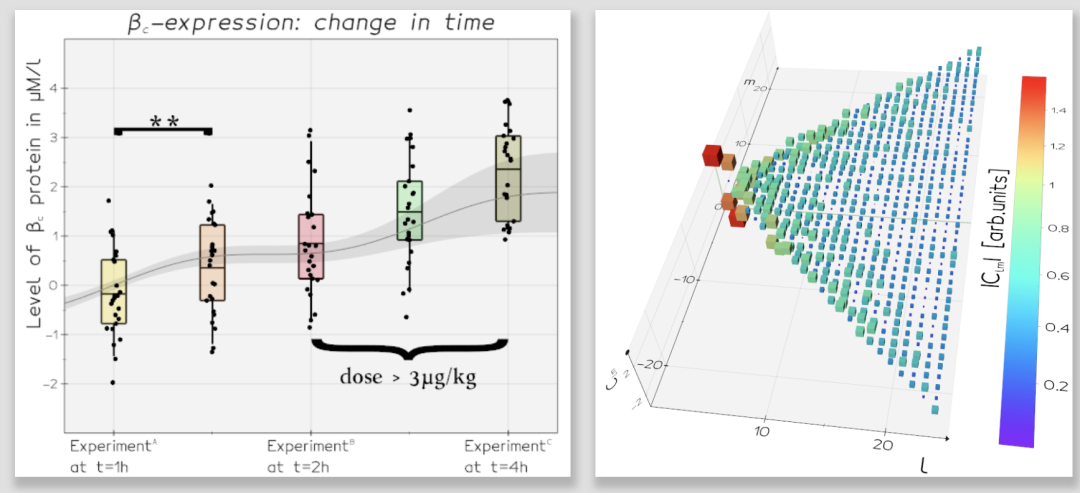
z-warped surface
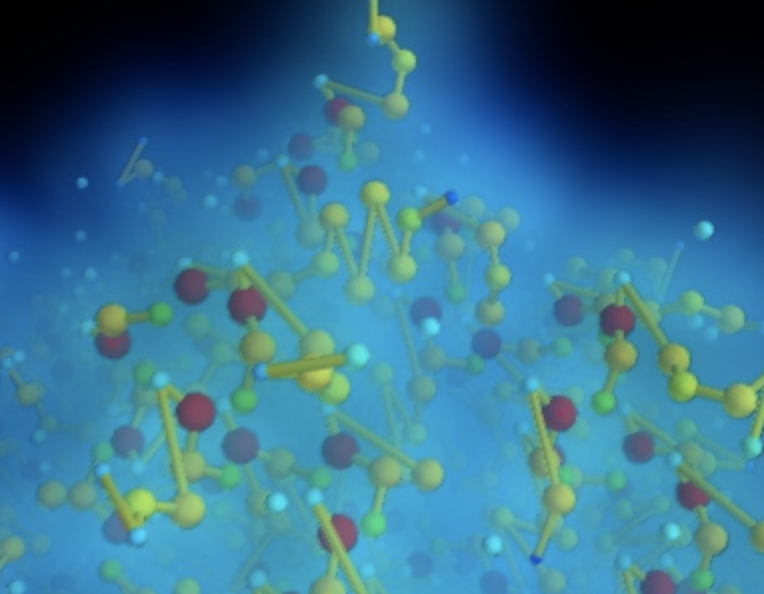
protein graph structure
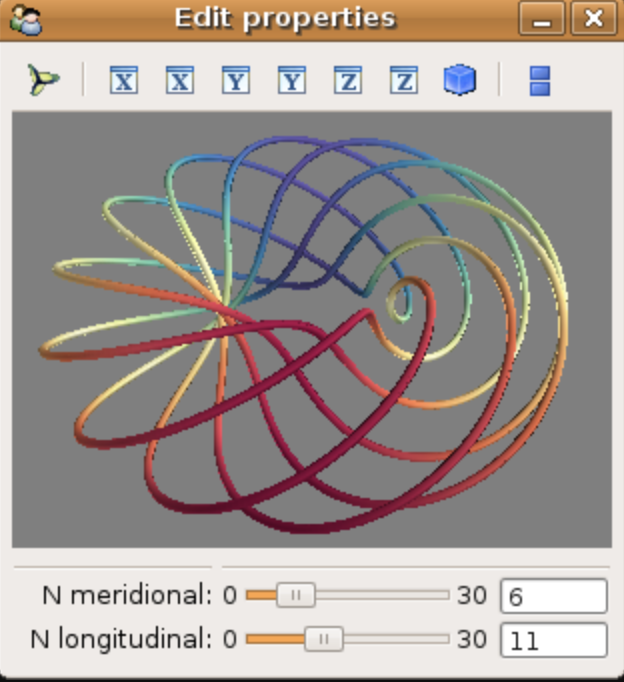
modify the data visualized via an interactive dialog.
项目地址:http://docs.enthought.com/mayavi/mayavi/index.html