一、效果
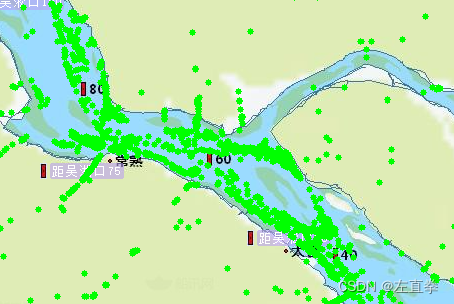
如图所示,地图缩小(即比例尺放大)时,显示聚合小绿点;
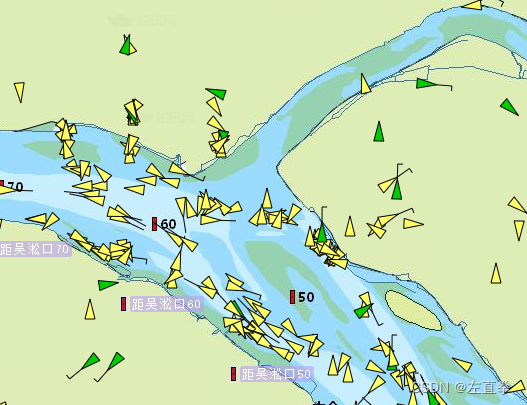
地图放大(比例尺缩小)时,展示具体船舶符号:
二、思路
1)设置2个图层,一个展示聚合小绿点;一个展示具体船舶符号。
2)它们通过设置minZoom和maxZoom属性来控制图层的显隐。缩小时,聚合小绿点图层显示,具体船舶符号图层隐藏;放大时,相反。
三、实现
1、上代码
import React, { useEffect, useRef } from 'react';
import 'ol/ol.css';
import Map from 'ol/Map';
import View from 'ol/View';
import TileLayer from 'ol/layer/Tile';
import OSM from 'ol/source/OSM';
import { fromLonLat } from 'ol/proj';
import WebGLPointsLayer from 'ol/layer/WebGLPoints';
import { Vector as VectorSource } from 'ol/source';
import { Feature } from 'ol';
import { Point } from 'ol/geom';
import Cluster from 'ol/source/Cluster';

const MapComponent = () => {
  const mapRef = useRef();

  useEffect(() => {
    const map = new Map({
      target: mapRef.current,
      layers: [
        new TileLayer({
          source: new OSM()
        })
      ],
      view: new View({
        center: fromLonLat([0, 0]),
        zoom: 2
      })
    });

    const vectorSource = new VectorSource();
    const clusterSource = new Cluster({
      distance: 3,
      source: vectorSource
    });

    const shipLayer = new WebGLPointsLayer({
      source: vectorSource,
      style: {
        symbol: {
          symbolType: 'image',
          src: 'path/to/ship-icon.png',
          size: 20,
          rotateWithView: false,
          displacement: [0, 0]
        }
      },
      minZoom: 10, // 显示船舶符号的最小缩放级别
      maxZoom: Infinity // 无限大,表示不会因为缩放级别过大而隐藏
    });

    const clusterLayer = new WebGLPointsLayer({
      source: clusterSource,
      style: {
        symbol: {
          symbolType: 'square', // 使用方块
          size: 8,
          color: 'rgba(0, 230, 0, 1)',
          rotateWithView: false,
          displacement: [0, 0],
          opacity: 1,
          stroke: {
            color: 'rgba(0, 230, 0, 1)',
            width: 1
          }
        }
      },
      minZoom: 0, // 显示聚合点的最小缩放级别
      maxZoom: 10 // 显示聚合点的最大缩放级别
    });

    map.addLayer(shipLayer);
    map.addLayer(clusterLayer);

  	return <div ref={mapRef} style={{ width: '100%', height: '400px' }}></div>;
}));

export default MapComponent;
2、代码解释
openlayers中,图层(layer)会有一个数据来源(source)。其中,简单小点图层的数据来源,又来源于具体船舶图层的数据来源。
1)数据来源:
const vectorSource = new VectorSource();
const clusterSource = new Cluster({
  distance: 3,
  source: vectorSource
});
2)图层:
const shipLayer = new WebGLPointsLayer({
  source: vectorSource,
  。。。
});

const clusterLayer = new WebGLPointsLayer({
  source: clusterSource,
  。。。
});
3)图层设置缩放属性,控制显隐:
const shipLayer = new WebGLPointsLayer({
	。。。
  minZoom: 10, // 显示船舶符号的最小缩放级别
  maxZoom: Infinity // 无限大,表示不会因为缩放级别过大而隐藏。其实不设置也可以
});

const clusterLayer = new WebGLPointsLayer({
	。。。
  minZoom: 0, // 显示聚合点的最小缩放级别
  maxZoom: 9 // 显示聚合点的最大缩放级别
});
四、题外话
openlayers中,控制图层中的对象变化特别简单,只需操作source里面的feature就可以了。