柱状图扩展
- 一、前言
- 二、思路
- 1、新增面
- ①、在drawShape方法中,新增一个实际左侧面,
- ②、 在drawShape方法中,新增一个实际右侧面,
- ③ 绘制
- 2、新增series对象
- ① 添加实际值的左侧面和右侧面
- 三、效果图
一、前言
事情是这样子的,收到一个粉丝的评论,说想做一个这样的立体柱状图,我没有写过,但是我大概知道了一个思路,然后给粉丝回复以后就开始尝试了,

二、思路
这图我的想法是在原本的柱状图上在加两个面,关于如何绘制柱状图的,请看我的另一篇文章,链接如下:03-echarts如何画立体柱状图
说干就干,
1、新增面
①、在drawShape方法中,新增一个实际左侧面,
  const trueLeft = echarts.graphic.extendShape({
        buildPath (ctx, shape) {
          const { topBasicsYAxis, bottomYAxis, basicsXAxis } = shape;
          // 侧面宽度
          const WIDTH = 15;
          // 斜角高度
          const OBLIQUE_ANGLE_HEIGHT = 3.6;

          const p1 = [basicsXAxis - WIDTH, topBasicsYAxis - OBLIQUE_ANGLE_HEIGHT];
          const p2 = [basicsXAxis - WIDTH, bottomYAxis];
          const p3 = [basicsXAxis, bottomYAxis];
          const p4 = [basicsXAxis, topBasicsYAxis- OBLIQUE_ANGLE_HEIGHT];

          ctx.moveTo(p1[0], p1[1]);
          ctx.lineTo(p2[0], p2[1]);
          ctx.lineTo(p3[0], p3[1]);
          ctx.lineTo(p4[0], p4[1]);
          console.log('ctx---',ctx)
        },
      });
关于P1,P2,P3,P4的位置在我的柱状图文章中也有仔细描述,就不细讲了,根据效果图可以知道,P1和P4的位置是水平的,所以Y轴是一致的,将原先的leftShape变量复制过来,更改一下P4的y轴定义,
②、 在drawShape方法中,新增一个实际右侧面,
 const trueRight = echarts.graphic.extendShape({
        buildPath (ctx, shape) {
          const { topBasicsYAxis, bottomYAxis, basicsXAxis } = shape;
          // 侧面宽度
          const WIDTH = 15;
          // 斜角高度
          const OBLIQUE_ANGLE_HEIGHT = 3.6;

          const p1 = [basicsXAxis, topBasicsYAxis - OBLIQUE_ANGLE_HEIGHT];
          const p2 = [basicsXAxis, bottomYAxis];
          const p3 = [basicsXAxis + WIDTH, bottomYAxis];
          const p4 = [basicsXAxis + WIDTH, topBasicsYAxis - OBLIQUE_ANGLE_HEIGHT];

          ctx.moveTo(p1[0], p1[1]);
          ctx.lineTo(p2[0], p2[1]);
          ctx.lineTo(p3[0], p3[1]);
          ctx.lineTo(p4[0], p4[1]);
        },
      });
由效果图可知,P1和P4的y轴依旧是一致的,所以将rightShape变量复制过来,更改P1的y轴定义,
③ 绘制
      echarts.graphic.registerShape("trueLeft", trueLeft);
      echarts.graphic.registerShape("trueRight", trueRight);
2、新增series对象
① 添加实际值的左侧面和右侧面
series的新对象中只有实际的两个面,所以可以直接将series的第一个对象复制过来,然后在return中的children中只留下两个对象,然后更改type名字分别为trueLeft和trueRight,我更改了一下柱子的颜色,具体情况可以根据自己所需的颜色来更改
 {
            type: "custom",
            data: [50],
            barWidth: 30,
            renderItem (params, api) {
              // 基础坐标
              const basicsCoord = api.coord([api.value(0), api.value(1)]);
              // 顶部基础 y 轴
              const topBasicsYAxis = basicsCoord[1];
              // 基础 x 轴
              const basicsXAxis = basicsCoord[0];
              // 底部 y 轴
              const bottomYAxis = api.coord([api.value(0), 0])[1];
              return {
                type: "group",
                children: [
                  {
                    type: "trueLeft",
                    shape: {
                      topBasicsYAxis,
                      basicsXAxis,
                      bottomYAxis,
                    },
                    style: {
                      fill: new echarts.graphic.LinearGradient(0, 0, 0, 1, [
                        {
                          offset: 0,
                          color: 'rgb(0, 192, 238,0.8)',
                        },

                        {
                          offset: 0.8,
                          color: 'rgb(0, 194, 239,0.2)',
                        },
                        {
                          offset: 1,
                          color: 'rgb(0, 194, 239,0)',
                        },


                      ]),
                      emphasis: {
                        fill: 'yellow', // 鼠标高亮时的填充颜色
                      },
                    },
                  },
                  {
                    type: "trueRight",
                    shape: {
                      topBasicsYAxis,
                      basicsXAxis,
                      bottomYAxis,
                    },
                    style: {
                      fill: new echarts.graphic.LinearGradient(0, 0, 0, 1, [
                        {
                          offset: 0,
                          color: '#00CCF5 ',
                        },

                        {
                          offset: 0.8,
                          color: 'rgb(4, 88, 115,0.8)',
                        },
                        {
                          offset: 1,
                          color: 'rgb(4, 88, 115,0.6)',
                        },


                      ]),
                      emphasis: {
                        fill: 'yellow', // 鼠标高亮时的填充颜色
                      },
                    },
                  },
                ],
              };
            }
          },
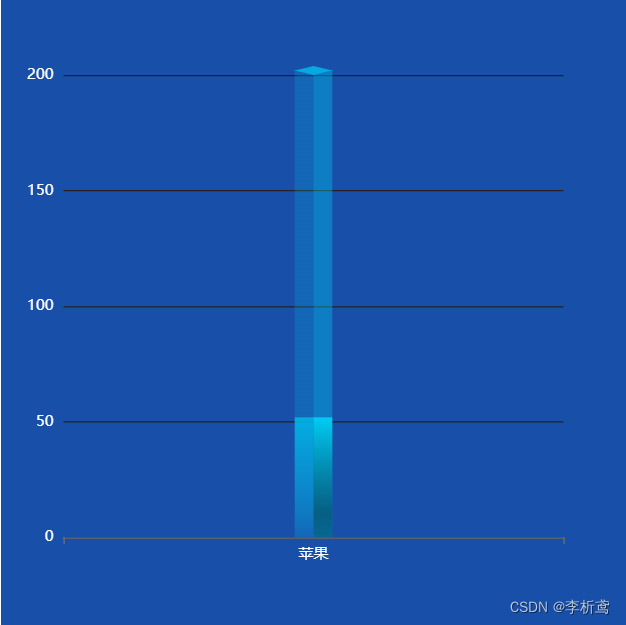
三、效果图
具体的颜色什么的自己可以调整,每个children对象里面的style就是用来调整


![[巨详细]使用HBuilder-X新建uniapp项目教程](https://img-blog.csdnimg.cn/direct/a661158f25d145909719097e881d1327.png)