参考知乎
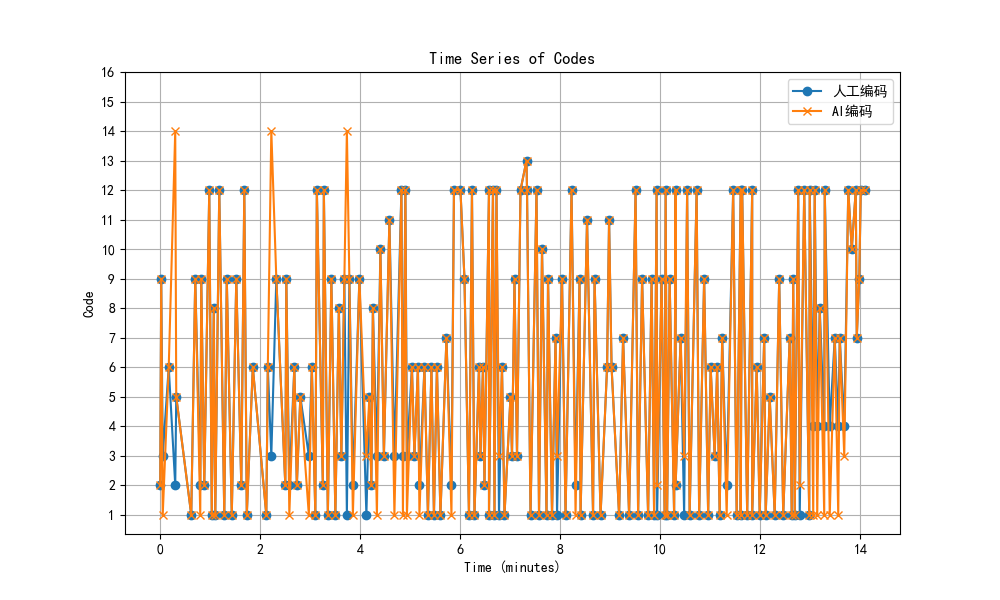
折线图
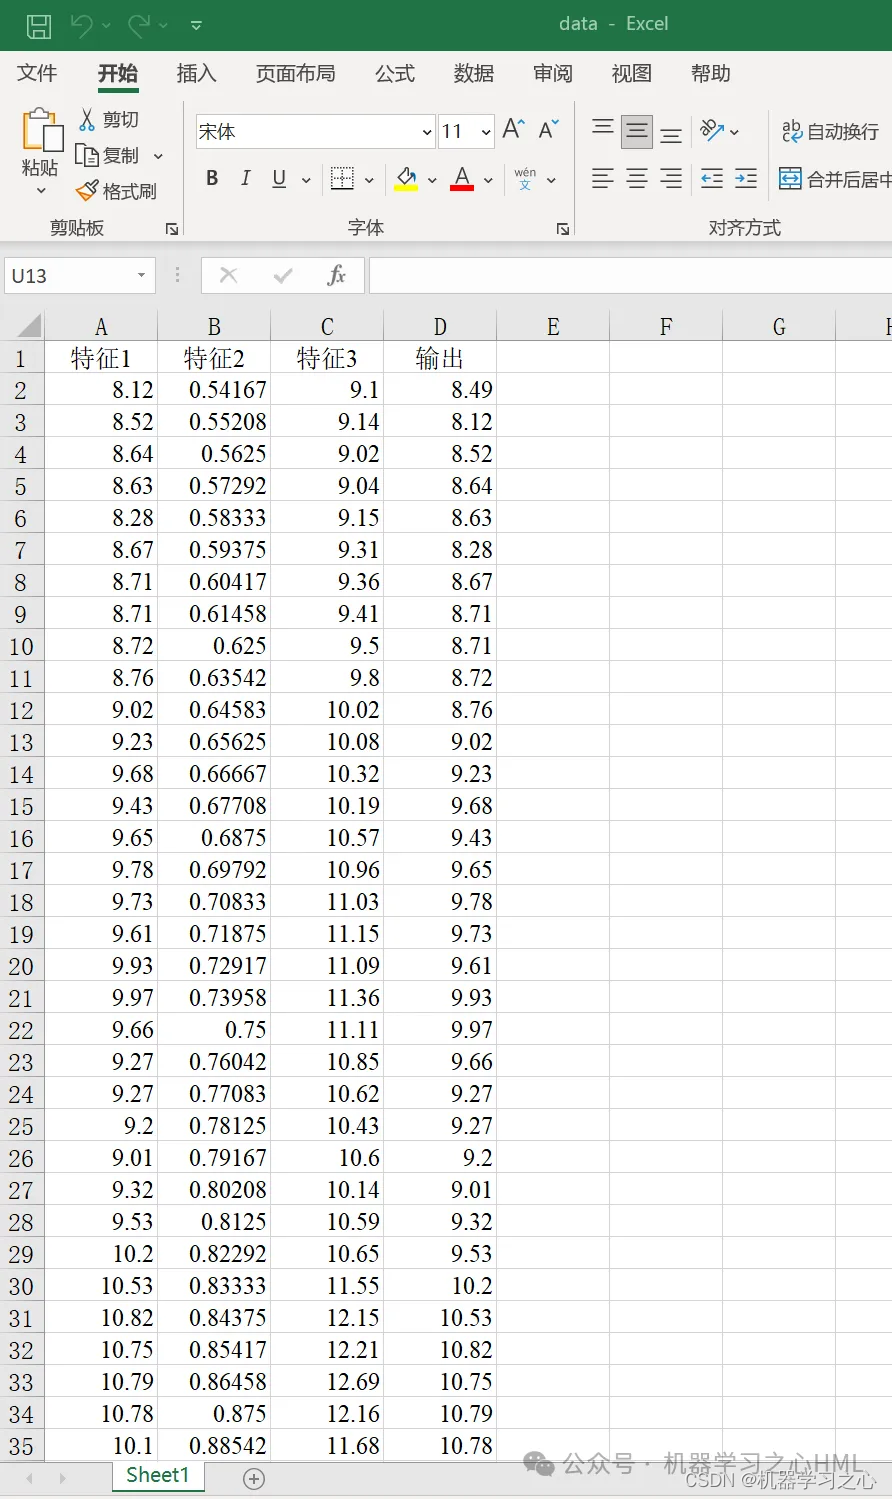
我需要从两个不同的excel都读取第一列作为时间列,第二列作为编码列。
在同一张图上画出两条时间序列的折线图
横坐标是分钟,纵坐标是编码
帮我画的好看一些,记得解决中文乱码问题
英文版折线图
,先搞个英文版,导师要求中文的话,再换成中文版
import pandas as pd
import matplotlib.pyplot as plt

# Reading the Excel files
file1 = 'merged_output.xlsx'
file2 = 'mAI.xlsx'

# Assuming the sheets are named "Sheet1" in both files
df1 = pd.read_excel(file1, sheet_name='Sheet1')
df2 = pd.read_excel(file2, sheet_name='Sheet1')

# Extracting the first and second columns as time and code
code1,time1 = df1.iloc[:, 0], df1.iloc[:, 1]
code2,time2 = df2.iloc[:, 0], df2.iloc[:, 1]

# Plotting the time series
plt.figure(figsize


![[Vue3:axios]:实现登录跳转页面展示列表(查看教师所承担课程的学生选课情况)](https://img-blog.csdnimg.cn/direct/1669a6191741481795a1c0ff618bc73d.png)