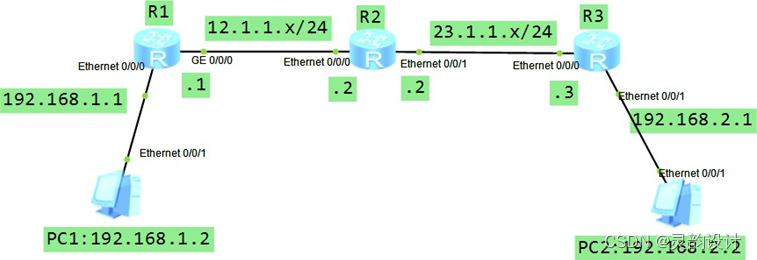
官网demo地址:
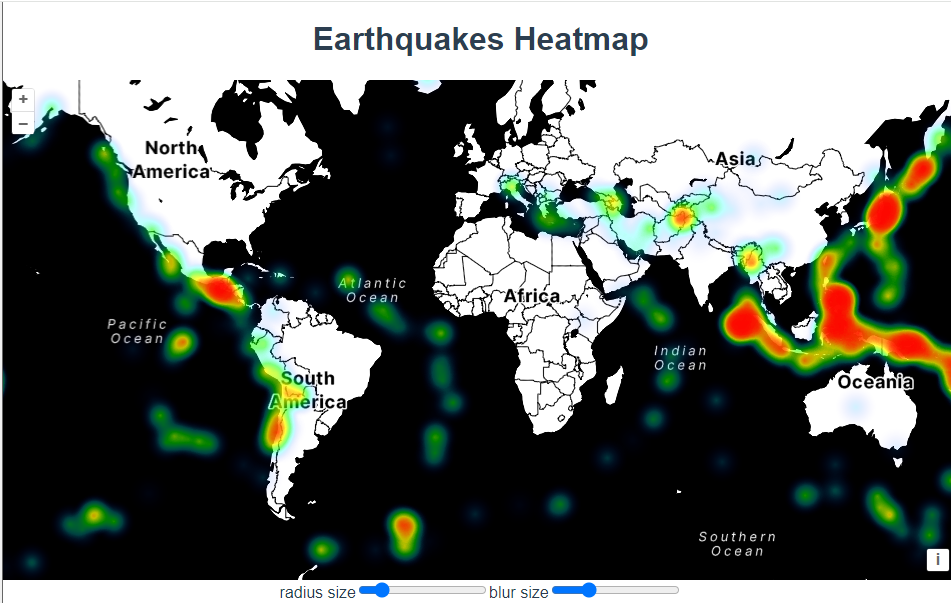
Earthquakes Heatmap
这篇主要介绍了热力图HeatmapLayer
HeatmapLayer 是一个用于在地图上显示热力图的图层类型,通常用于表示地理数据中的密度或强度。例如,它可以用来显示地震、人口密度或其他空间数据的热点区域。在这个示例中,HeatmapLayer 被用来显示从 KML 文件中提取的地震数据。
 const vector = new HeatmapLayer({
      source: new VectorSource({
        url: "https://openlayers.org/en/latest/examples/data/kml/2012_Earthquakes_Mag5.kml",
        format: new KML({
          extractStyles: false,
        }),
      }),
      //热力图的模糊半径,以像素为单位。
      blur: parseInt(blur.value, 10),
      //每个点的影响半径,以像素为单位。
      radius: parseInt(radius.value, 10),
      //用于根据特征属性计算热力图中每个点的权重 权重值 应介于 0 到 1 之间
      weight: function (feature) {
        const name = feature.get("name");
        const magnitude = parseFloat(name.substr(2));
        console.log("magnitude", magnitude);
        return magnitude - 5;
      },
    });
通过滑块的改变控制图层的半径和模糊度
 blur.addEventListener("input", function () {
      vector.setBlur(parseInt(blur.value, 10));
    });

    radius.addEventListener("input", function () {
      vector.setRadius(parseInt(radius.value, 10));
    });
完整代码:
<template>
  <div class="box">
    <h1>Earthquakes Heatmap</h1>
    <div id="map"></div>
    <form>
      <label for="radius">radius size</label>
      <input id="radius" type="range" min="1" max="50" step="1" value="5" />
      <label for="blur">blur size</label>
      <input id="blur" type="range" min="1" max="50" step="1" value="15" />
    </form>
  </div>
</template>

<script>
import KML from "ol/format/KML.js";
import Map from "ol/Map.js";
import StadiaMaps from "ol/source/StadiaMaps.js";
import VectorSource from "ol/source/Vector.js";
import View from "ol/View.js";
import { Heatmap as HeatmapLayer, Tile as TileLayer } from "ol/layer.js";
export default {
  name: "",
  components: {},
  data() {
    return {
      map: null,
    };
  },
  computed: {},
  created() {},
  mounted() {
    const blur = document.getElementById("blur");
    const radius = document.getElementById("radius");

    const vector = new HeatmapLayer({
      source: new VectorSource({
        url: "https://openlayers.org/en/latest/examples/data/kml/2012_Earthquakes_Mag5.kml",
        format: new KML({
          extractStyles: false,
        }),
      }),
      //热力图的模糊半径,以像素为单位。
      blur: parseInt(blur.value, 10),
      //每个点的影响半径,以像素为单位。
      radius: parseInt(radius.value, 10),
      //用于根据特征属性计算热力图中每个点的权重 权重值 应介于 0 到 1 之间
      weight: function (feature) {
        const name = feature.get("name");
        const magnitude = parseFloat(name.substr(2));
        console.log("magnitude", magnitude);
        return magnitude-5;
      },
    });

    const raster = new TileLayer({
      source: new StadiaMaps({
        layer: "stamen_toner",
      }),
    });

    new Map({
      layers: [raster, vector],
      target: "map",
      view: new View({
        center: [0, 0],
        zoom: 2,
      }),
    });

    blur.addEventListener("input", function () {
      vector.setBlur(parseInt(blur.value, 10));
    });

    radius.addEventListener("input", function () {
      vector.setRadius(parseInt(radius.value, 10));
    });
  },
  methods: {},
};
</script>

<style lang="scss" scoped>
#map {
  width: 100%;
  height: 500px;
}
.box {
  height: 100%;
}
</style>


![[vue2项目]vue2+supermap[mapboxgl]+天地图之地图的初始化](https://img-blog.csdnimg.cn/direct/f12ddac87117433782be271be802caf5.png)