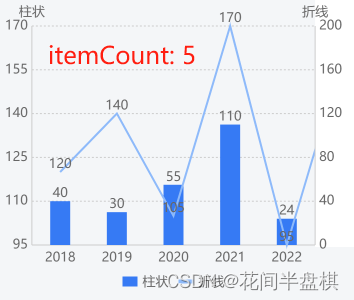
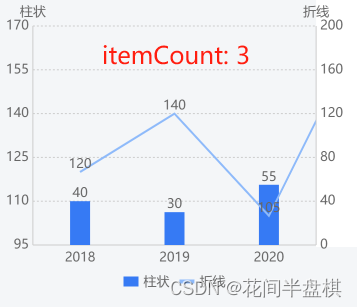
效果参考:
实现:
- 需要在 opts 中配置:
enableScroll: true和ontouch:true; - 在 opts 的 xAxis 中配置:
itemCount: 5(值可以自定义,如图,为默认展示几个);
效果图的完整示例代码:
<template>
  <view class="charts-box">
    <qiun-data-charts type="mix" canvas2d="true" ontouch="true" :opts="opts" :chartData="chartData" />
  </view>
</template>

<script>
export default {
  data() {
    return {
      chartData: {},
      opts: {
        color: ["#367AF4"],
        padding: [15, 15, 0, 15],
        enableScroll: true,
        ontouch:true,
        legend: {},
        xAxis: {
          disableGrid: true,
          itemCount: 5
        },
        yAxis: {
          disabled: false,
          disableGrid: false,
          splitNumber: 5,
          gridType: "dash",
          dashLength: 4,
          gridColor: "#CCCCCC",
          padding: 10,
          showTitle: true,
          data: [
            {
              position: "left",
              title: "柱状"
            },
            {
              position: "right",
              min: 0,
              max: 200,
              title: "折线",
              textAlign: "left"
            },
          ]
        },
        extra: {
          mix: {
            column: {
              width: 20
            }
          }
        }
      }
    };
  },
  mounted() {
    this.getServerData();
  },
  methods: {
    getServerData() {
      //模拟从服务器获取数据时的延时
      setTimeout(() => {
        //模拟服务器返回数据,如果数据格式和标准格式不同,需自行按下面的格式拼接
        let res = {
          categories: ["2018", "2019", "2020", "2021", "2022", "2023"],
          series: [
            {
              name: "柱状",
              index: 1,
              type: "column",
              data: [40, 30, 55, 110, 24, 58]
            },
            {
              name: "折线",
              type: "line",
              color: "#8EBAFA",
              data: [120, 140, 105, 170, 95, 160]
            },
          ]
        };
        this.chartData = JSON.parse(JSON.stringify(res));
      }, 500);
    },
  }
};
</script>

<style lang="scss" scoped>
/* 请根据实际需求修改父元素尺寸,组件自动识别宽高 */
.charts-box {
  width: 100%;
  height: 300px;
}
</style>