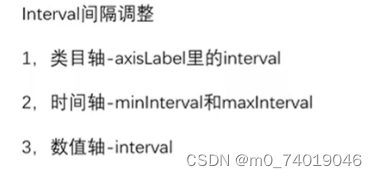
刻度的间隔
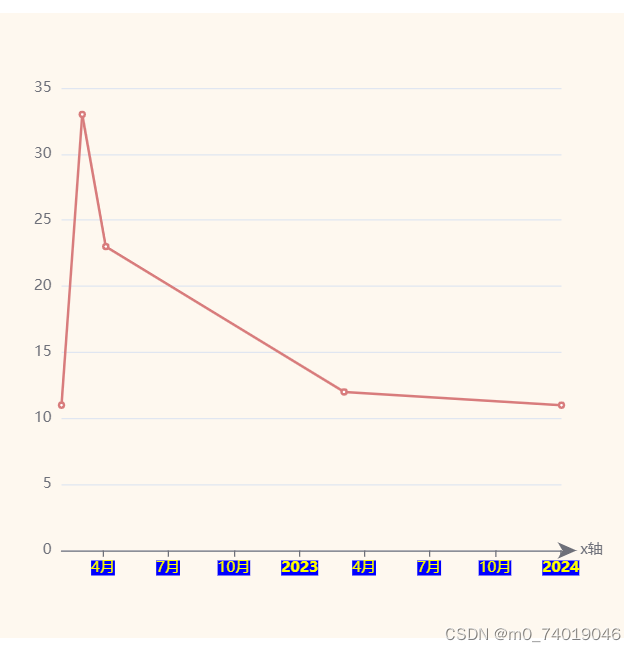
类目轴的间隔 interval
 xAxis: {
     type: "category",
     name: "x轴",
     axisLine: {
     },
     axisLabel: {
       show: true,
       color: "yellow",
       backgroundColor: "blue",
       interval: 5,
     },
     data: [
       11, 22, 322, 422, 522, 622, 722, 822, 229, 1220, 1, 22, 322, 422, 522,
       622, 722, 822, 229, 1220,
     ],
   },
时间轴的间隔 minInterval,maxInterval
 let options = {
    xAxis: {
      type: "time",
      name: "x轴",
      axisLine: {
        show: true,
        symbol: ["none", "arrow"],
        symbolOffset: [0, 12],
      },
      axisLabel: {
        show: true,
        color: "yellow",
        backgroundColor: "blue",
        //  interval: 5,
      },
      interval: 120 * 24 * 3600 * 1000, //强制设置坐标轴分割间隔。一般不会生效,可以不用设置。
      minInterval: 120 * 24 * 3600 * 1000,  //坐标轴最小间隔大小
      maxInterval: 120 * 24 * 3600 * 1000, //坐标轴最大间隔大小。
      // data: data,
    },
    yAxis: {},
    series: [
      {
        id: 0,
        name: "d1",
        type: "line",
        data: data,
      },
    ],
  };
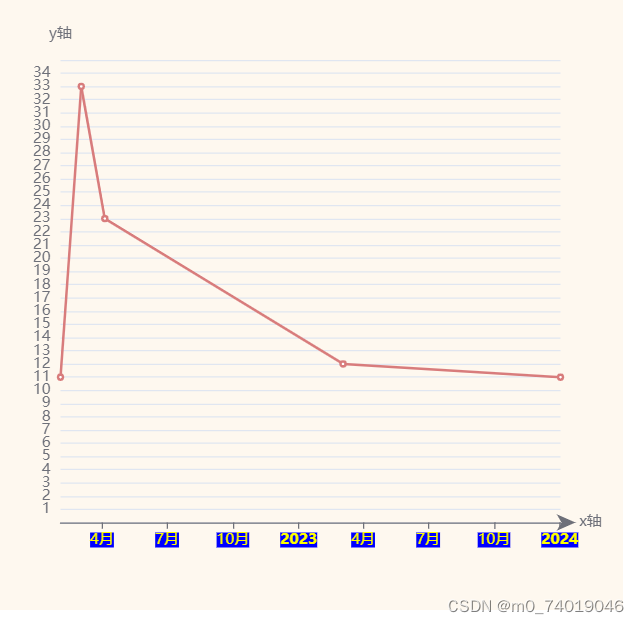
数值轴一般不建议设置间隔
 let options = {
    xAxis: { },
    yAxis: {
      name: "y轴",
      interval: 1,
    },
    series: [],
  };
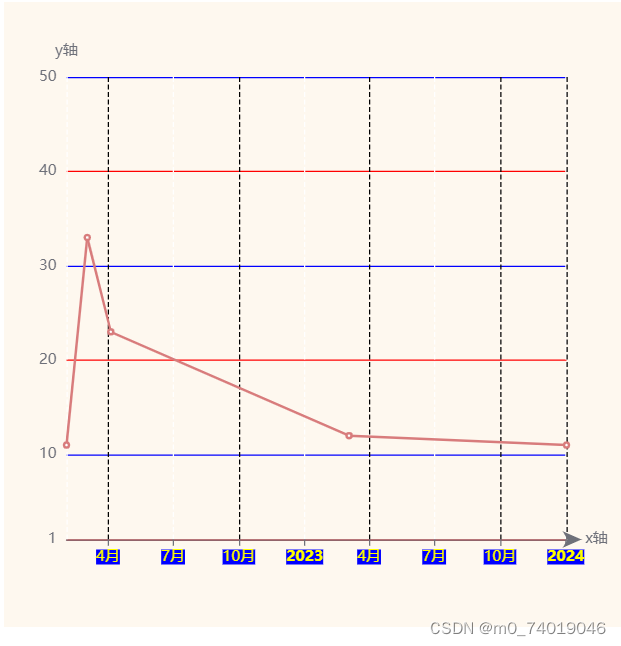
min和 max只用数值轴才支持。
  xAxis: {
  },
   yAxis: {
     name: "y轴",
     min: 1,
     max: 50,
  },
网格线
splitLine
 let options = {
    xAxis: {
      type: "time",
      name: "x轴",
      axisLine: {},
      axisLabel: {},
      minInterval: 120 * 24 * 3600 * 1000,
      maxInterval: 120 * 24 * 3600 * 1000,
      splitLine: {
        show: true,
        lineStyle: {
          color: ["#fff", "black"],
          type: "dashed",
        },
      },
    },
    yAxis: {
      name: "y轴",
      min: 1,
      max: 50,
      splitLine: {
        show: true,
        lineStyle: {
          color: ["red", "blue"],
        },
      },
    },
    series: [
      {
        id: 0,
        name: "d1",
        type: "line",
        data: data,
      },
    ],
  };
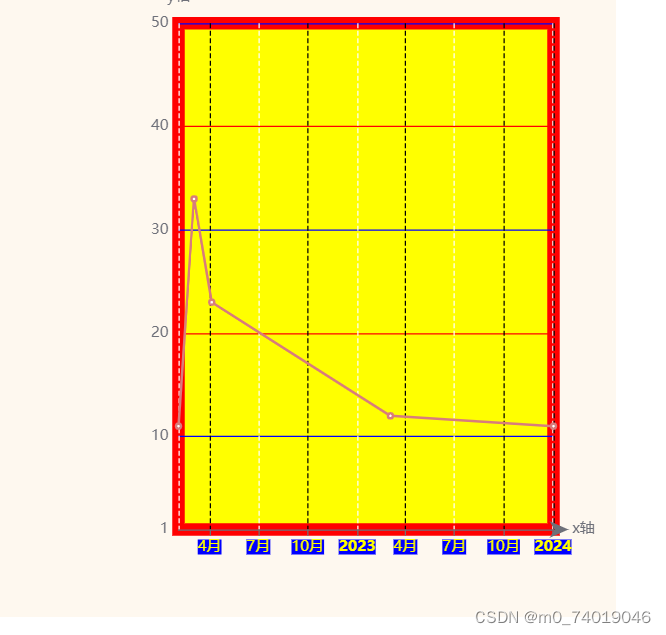
grid 直角坐标系内绘图网格
可以调整网格的位置、背景色边框等。
 let options = {
    grid: {
      show: true,
      backgroundColor: "yellow",
      borderWidth: 10,
      borderColor: "red",
      left: "30%",
      top: "5%",
    },
    xAxis: {
      type: "time",
      name: "x轴",
      axisLine: {},
      axisLabel: {},
      minInterval: 120 * 24 * 3600 * 1000,
      maxInterval: 120 * 24 * 3600 * 1000,
      splitLine: {
        show: true,
        lineStyle: {
          color: ["#fff", "black"],
          type: "dashed",
        },
      },
    },
    yAxis: {
      name: "y轴",
      min: 1,
      max: 50,
      splitLine: {
        show: true,
        lineStyle: {
          color: ["red", "blue"],
        },
      },
    },
    series: [
      {
        id: 0,
        name: "d1",
        type: "line",
        data: data,
      },
    ],
  };
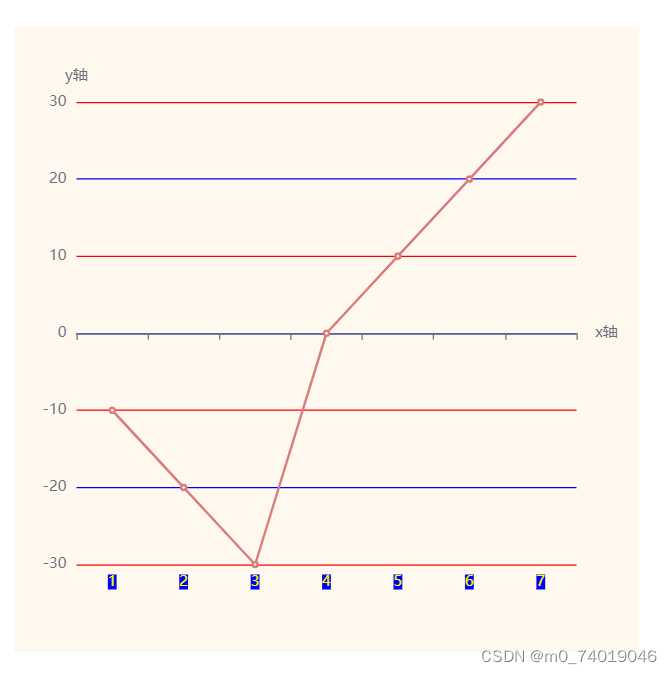
原点的调整
原点不能自己调整,只能通过数据来改变。
例如有负值时,x轴会在中间。
 const d1 = [-10, -20, -30, 0, 10, 20, 30];
  let options = {
    xAxis: {
      type: "category",
      name: "x轴",
      axisLine: {},
      axisLabel: {},
      data: [1, 2, 3, 4, 5, 6, 7],
    },
    yAxis: {name: "y轴",},
    series: [
      {
        id: 0,
        name: "d1",
        type: "line",
        data: d1,
      },
    ],
  };
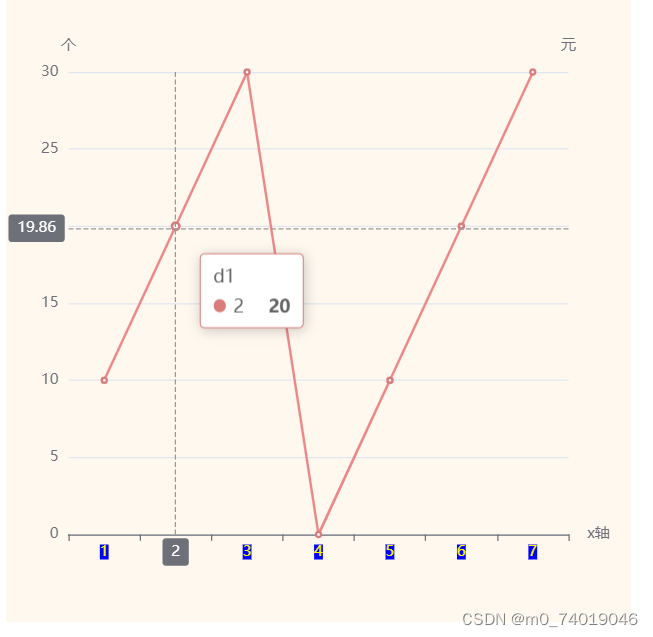
多坐标轴
多y轴
yAxis 可以设为数组,存放多个对象
 const d1 = [10, 20, 30, 0, 10, 20, 30];
  let options = {
    xAxis: {
      type: "category",
      name: "x轴",
      axisLine: {},
      axisLabel: { },
      data: [1, 2, 3, 4, 5, 6, 7],
    },
    tooltip: {
      show: true,
      axisPointer: {
        type: "cross", //十字准星指示器
      },
    },
    yAxis: [
      {
        name: "个",
      },
      {
        name: "元",
      },
    ],
    series: [
      {
        id: 0,
        name: "d1",
        type: "line",
        data: d1,
      },
    ],
  };
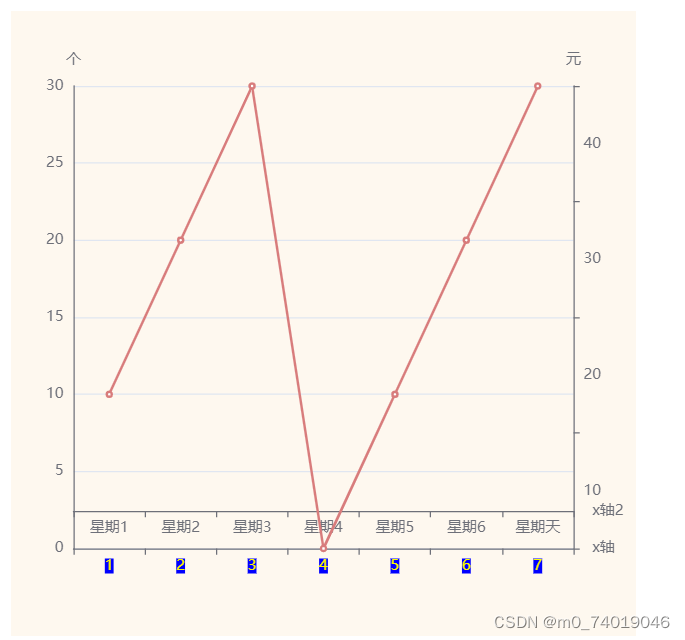
多x轴
xAxis也可以设为数组,存放多个对象
 const d1 = [10, 20, 30, 0, 10, 20, 30];
  let options = {
    xAxis: [
      {
        type: "category",
        name: "x轴",
        axisLine: {
          show: true,
        },
        axisLabel: {
          show: true,
          color: "yellow",
          backgroundColor: "blue",
        },
        data: [1, 2, 3, 4, 5, 6, 7],
      },
      {
        type: "category",
        name: "x轴2",
        position: "bottom",
        offset: -30,
        data: ["星期1", "星期2", "星期3", "星期4", "星期5", "星期6", "星期天"],
      },
    ],

    tooltip: {
      show: true,
      axisPointer: {
        type: "cross", //十字准星指示器
      },
    },
    yAxis: [
      {
        name: "个",
        axisLine: {
          show: true,
        },
      },
      {
        name: "元",
        axisLine: {
          show: true,
        },
        data: [10, 20, 30, 40],
      },
    ],
    series: [
      {
        id: 0,
        name: "d1",
        type: "line",
        data: d1,
      },
    ],
  };
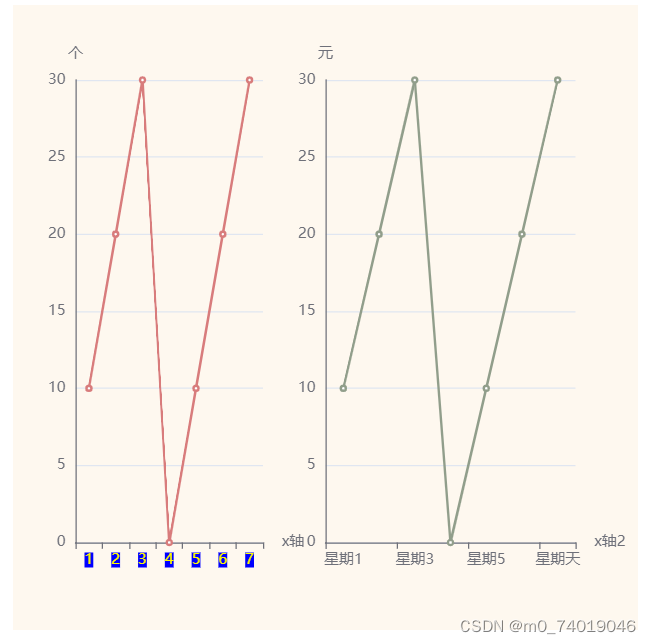
多坐标系
grid可以是一个数组,设置多个直角坐标系内绘图网格。
xAxis和yAxis有个gridIndex可以匹配对应的grid。
series里的数据也有 yAxisIndex和 xAxisIndex去匹配对应的grid。
 const d1 = [10, 20, 30, 0, 10, 20, 30];
  let options = {
    grid: [
      {
        width: "30%",
      },
      {
        width: "40%",
        left: "50%",
      },
    ],
    xAxis: [
      {
        gridIndex: 0,
        type: "category",
        name: "x轴",
        axisLine: {
          show: true,
        },
        axisLabel: {
          show: true,
          color: "yellow",
          backgroundColor: "blue",
        },
        data: [1, 2, 3, 4, 5, 6, 7],
      },
      {
        gridIndex: 1,
        type: "category",
        name: "x轴2",
        position: "bottom",

        data: ["星期1", "星期2", "星期3", "星期4", "星期5", "星期6", "星期天"],
      },
    ],

    tooltip: {
      show: true,
      axisPointer: {
        type: "cross", //十字准星指示器
      },
    },
    yAxis: [
      {
        gridIndex: 0,
        name: "个",
        axisLine: {
          show: true,
        },
      },
      {
        gridIndex: 1,
        name: "元",
        axisLine: {
          show: true,
        },
      },
    ],
    series: [
      {
        yAxisIndex: 0,
        xAxisIndex: 0,
        name: "d1",
        type: "line",
        data: d1,
      },
      {
        yAxisIndex: 1,
        xAxisIndex: 1,
        name: "d2",
        type: "line",
        data: d1,
      },
    ],
  };
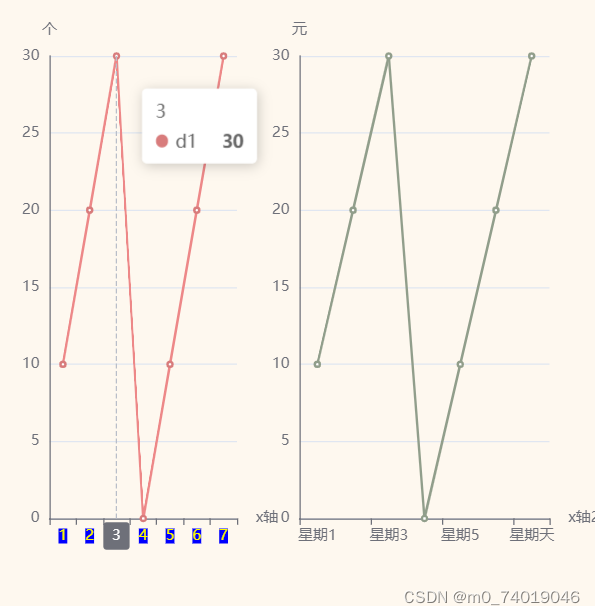
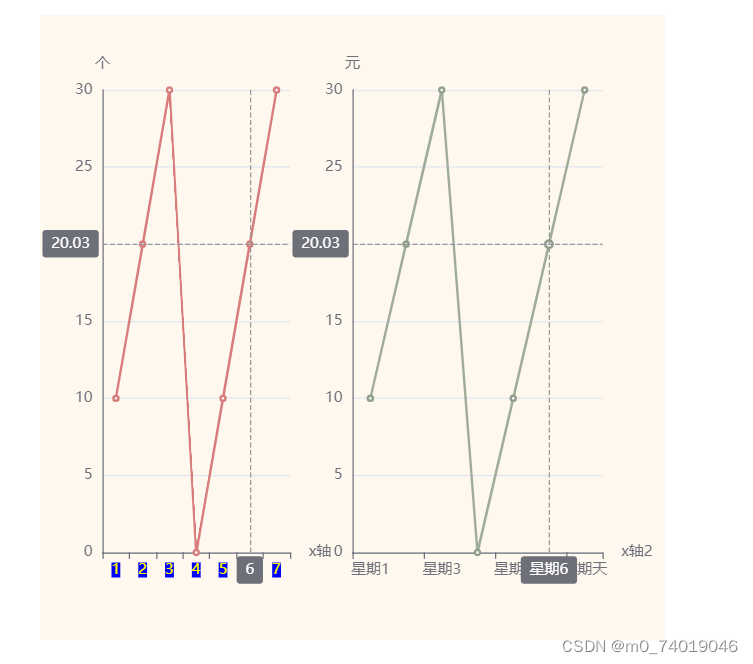
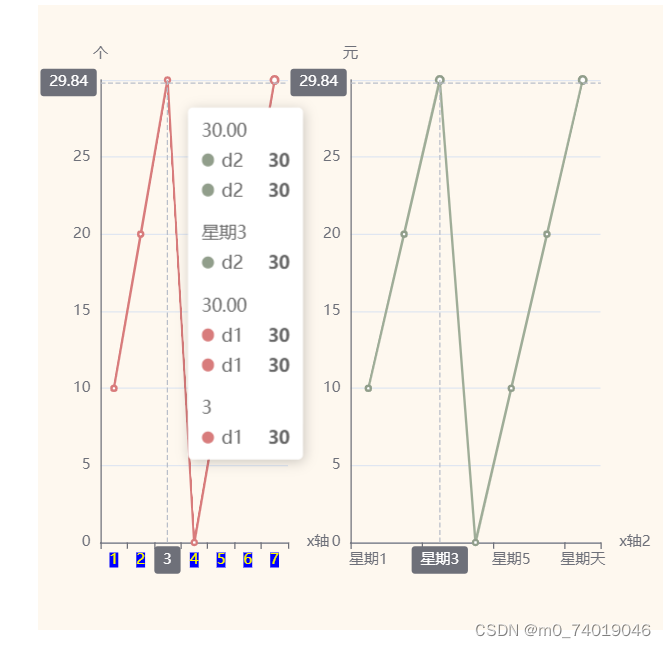
多坐标系联动
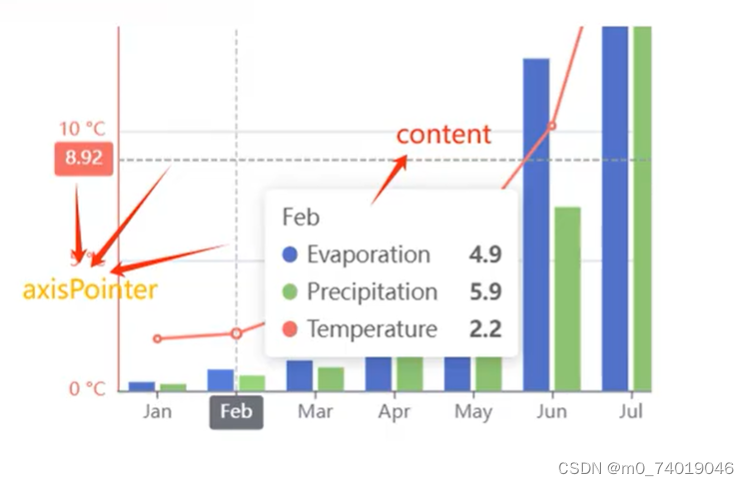
axisPointer 坐标轴指示器配置项。
坐标轴指示器是指示坐标轴当前刻度的工具。
tooltip.axisPointer 是配置坐标轴指示器的快捷方式。
link :可以使不同轴的 axisPointer 可以进行联动。
link 是一个数组,其中每一项表示一个 link group,一个 group 中的坐标轴互相联动。
const d1 = [10, 20, 30, 0, 10, 20, 30];
 let options = {
   grid: [
     {
       width: "30%",
     },
     {
       width: "40%",
       left: "50%",
     },
   ],
   axisPointer: {
     link: [
         {
           xAxisIndex: "all"
            // 也可以用 yAxisName: 'someName'
         }, {
          yAxisIndex: "all"
        }
      ],
   },
   xAxis: [
     {
       gridIndex: 0,
       type: "category",
       name: "x轴",
       axisLine: {
         show: true,
       },
       axisLabel: {
         show: true,
         color: "yellow",
         backgroundColor: "blue",
       },
       data: [1, 2, 3, 4, 5, 6, 7],
     },
     {
       gridIndex: 1,
       type: "category",
       name: "x轴2",
       position: "bottom",

       data: ["星期1", "星期2", "星期3", "星期4", "星期5", "星期6", "星期天"],
     },
   ],

   tooltip: {
     show: true,
     axisPointer: {
       type: "cross", //十字准星指示器
     },
   },
   yAxis: [
     {
       gridIndex: 0,
       name: "个",
       axisLine: {
         show: true,
       },
     },
     {
       gridIndex: 1,
       name: "元",
       axisLine: {
         show: true,
       },
     },
   ],
   series: [
     {
       yAxisIndex: 0,
       xAxisIndex: 0,
       name: "d1",
       type: "line",
       data: d1,
     },
     {
       yAxisIndex: 1,
       xAxisIndex: 1,
       name: "d2",
       type: "line",
       data: d1,
     },
   ],
 };
几个axisPointer的优先级问题
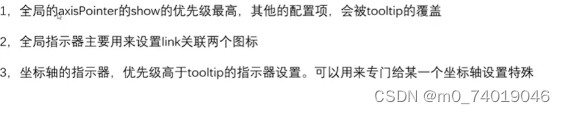
axisPointer的优先级高于xAxis的axisPointer和tooltip的axisPointer。有些配置 axisPointer没有,可以在tooltip修改
 let options = {
    grid: [
      {
        width: "30%",
      },
      {
        width: "40%",
        left: "50%",
      },
    ],
    axisPointer: {
      show: true,
      link: [{ xAxisIndex: "all" }, { yAxisIndex: "all" }],
    },
    xAxis: [
      {
        gridIndex: 0,
        type: "category",
        name: "x轴",
        axisLine: {
          show: true,
        },
        axisLabel: {
          show: true,
          color: "yellow",
          backgroundColor: "blue",
        },
        data: [1, 2, 3, 4, 5, 6, 7],
        axisPointer: {
          show: false,
        },
      },
      {
        gridIndex: 1,
        type: "category",
        name: "x轴2",
        position: "bottom",

        data: ["星期1", "星期2", "星期3", "星期4", "星期5", "星期6", "星期天"],
      },
    ],

   tooltip: {
      show: true,
      axisPointer: {
        type: "none",
        label: {
          show: true,
          textStyle: {
            color: "#fff",
          },
        },
      },
    },
    yAxis: [],
    series: [ ],
  };
坐标轴的 axisPointer优先级高于tooltip的axisPointer
 let options = {
    grid: [
      {
        width: "30%",
      },
      {
        width: "40%",
        left: "50%",
      },
    ],

    xAxis: [
      {
        gridIndex: 0,
        type: "category",
        name: "x轴",
        axisLine: {
          show: true,
        },
        axisLabel: {
          show: true,
          color: "yellow",
          backgroundColor: "blue",
        },
        data: [1, 2, 3, 4, 5, 6, 7],
        axisPointer: {
          show: true,
        },
      },
      { },
    ],

    tooltip: {
      show: true,
      axisPointer: {
        type: "none",
        label: {
          show: true,
          textStyle: {
            color: "#fff",
          },
        },
      },
    },
    yAxis: [],
    series: [],
  };