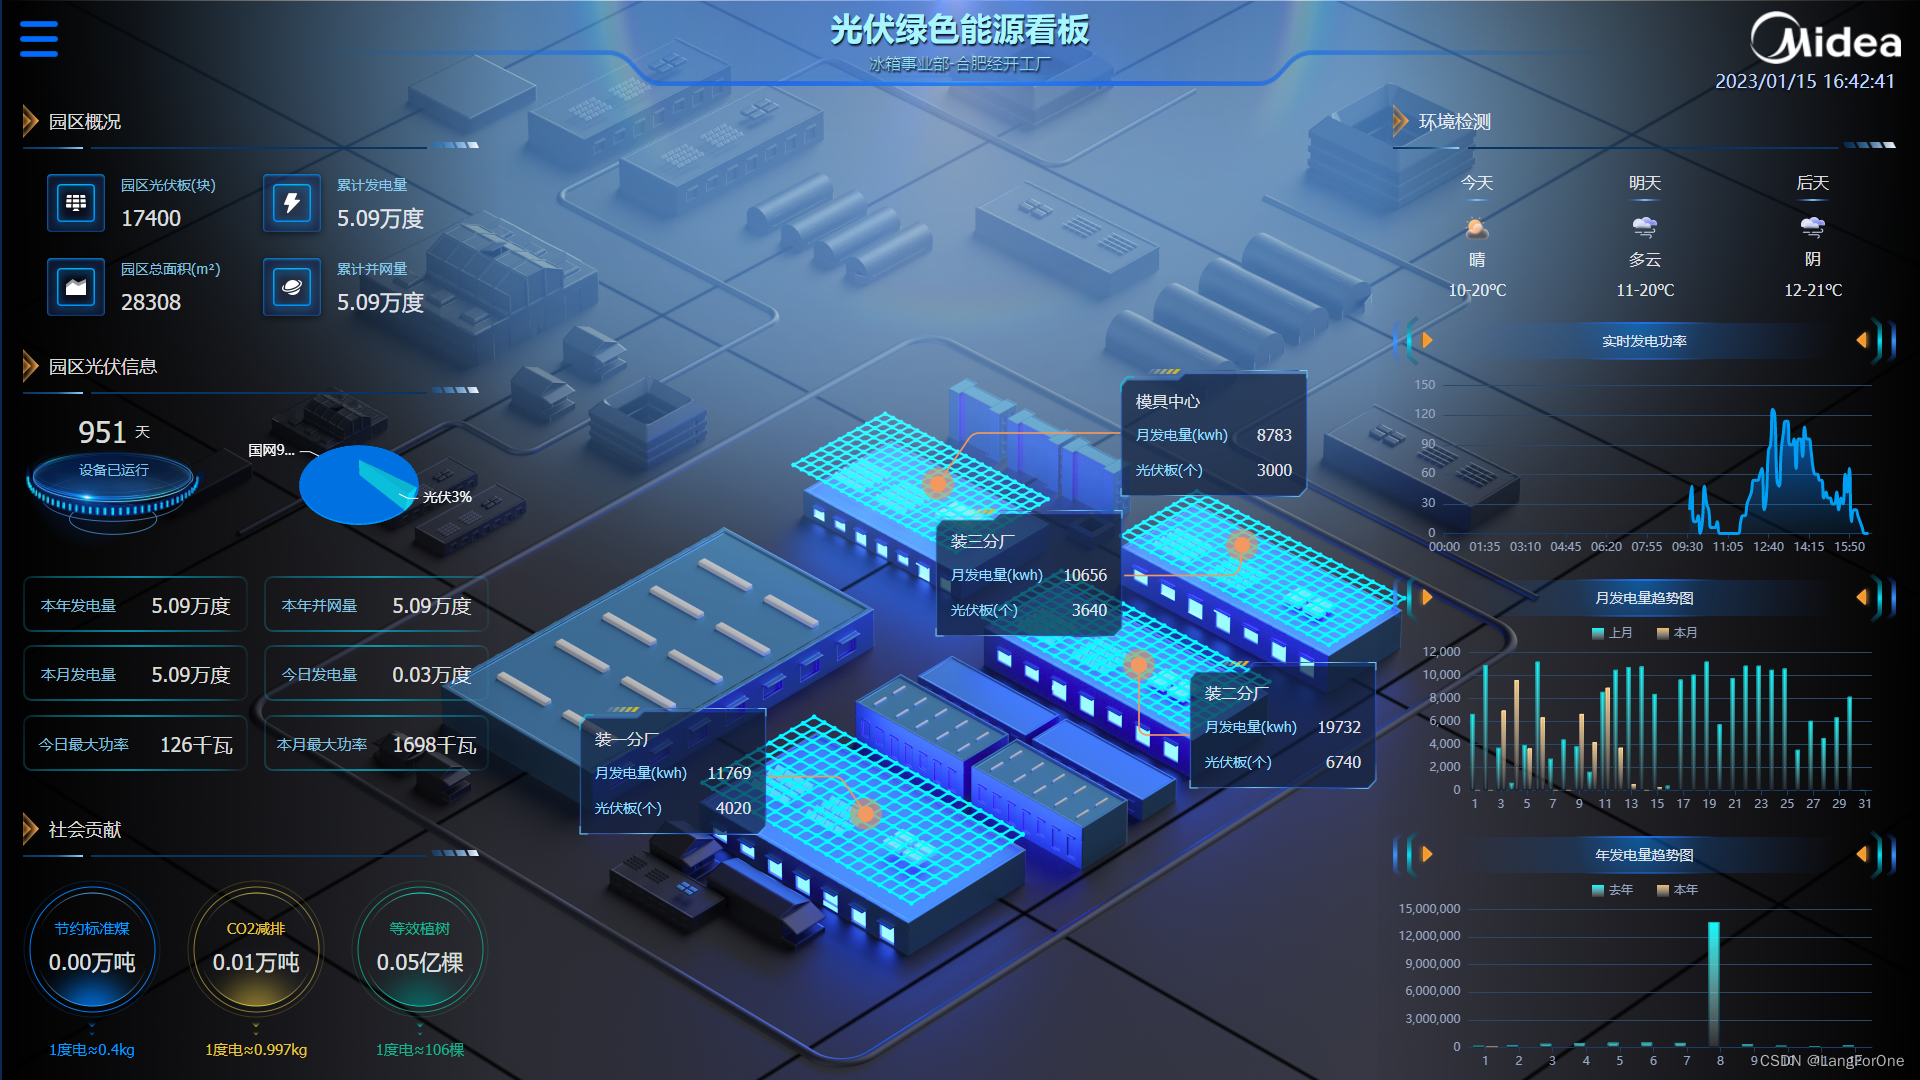
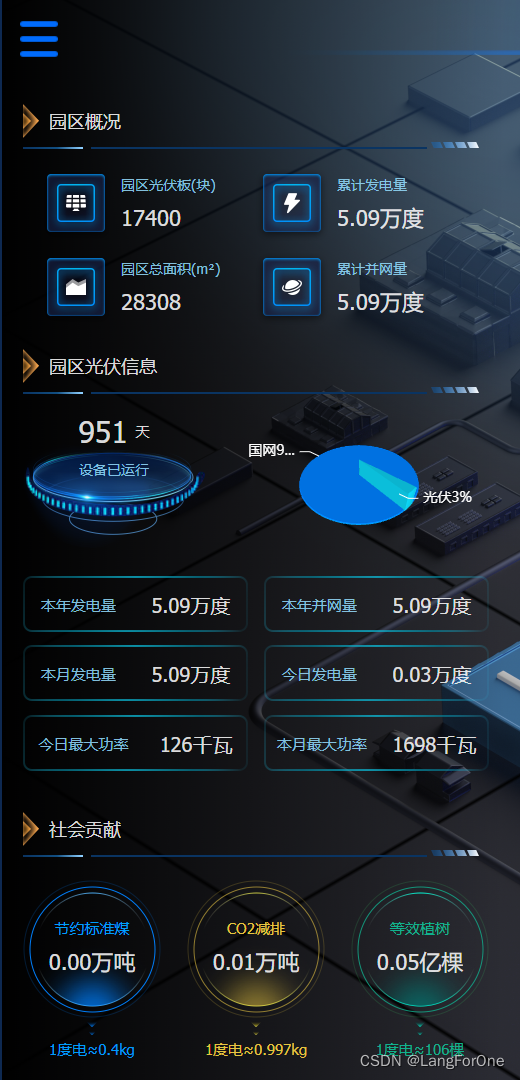
今天新开一个系列,专门介绍近期工作中开发的几个比较酷炫的看板的开发思路与经验分享。第一节我们就来介绍下这个光伏绿色能源看板,整体浏览如下:
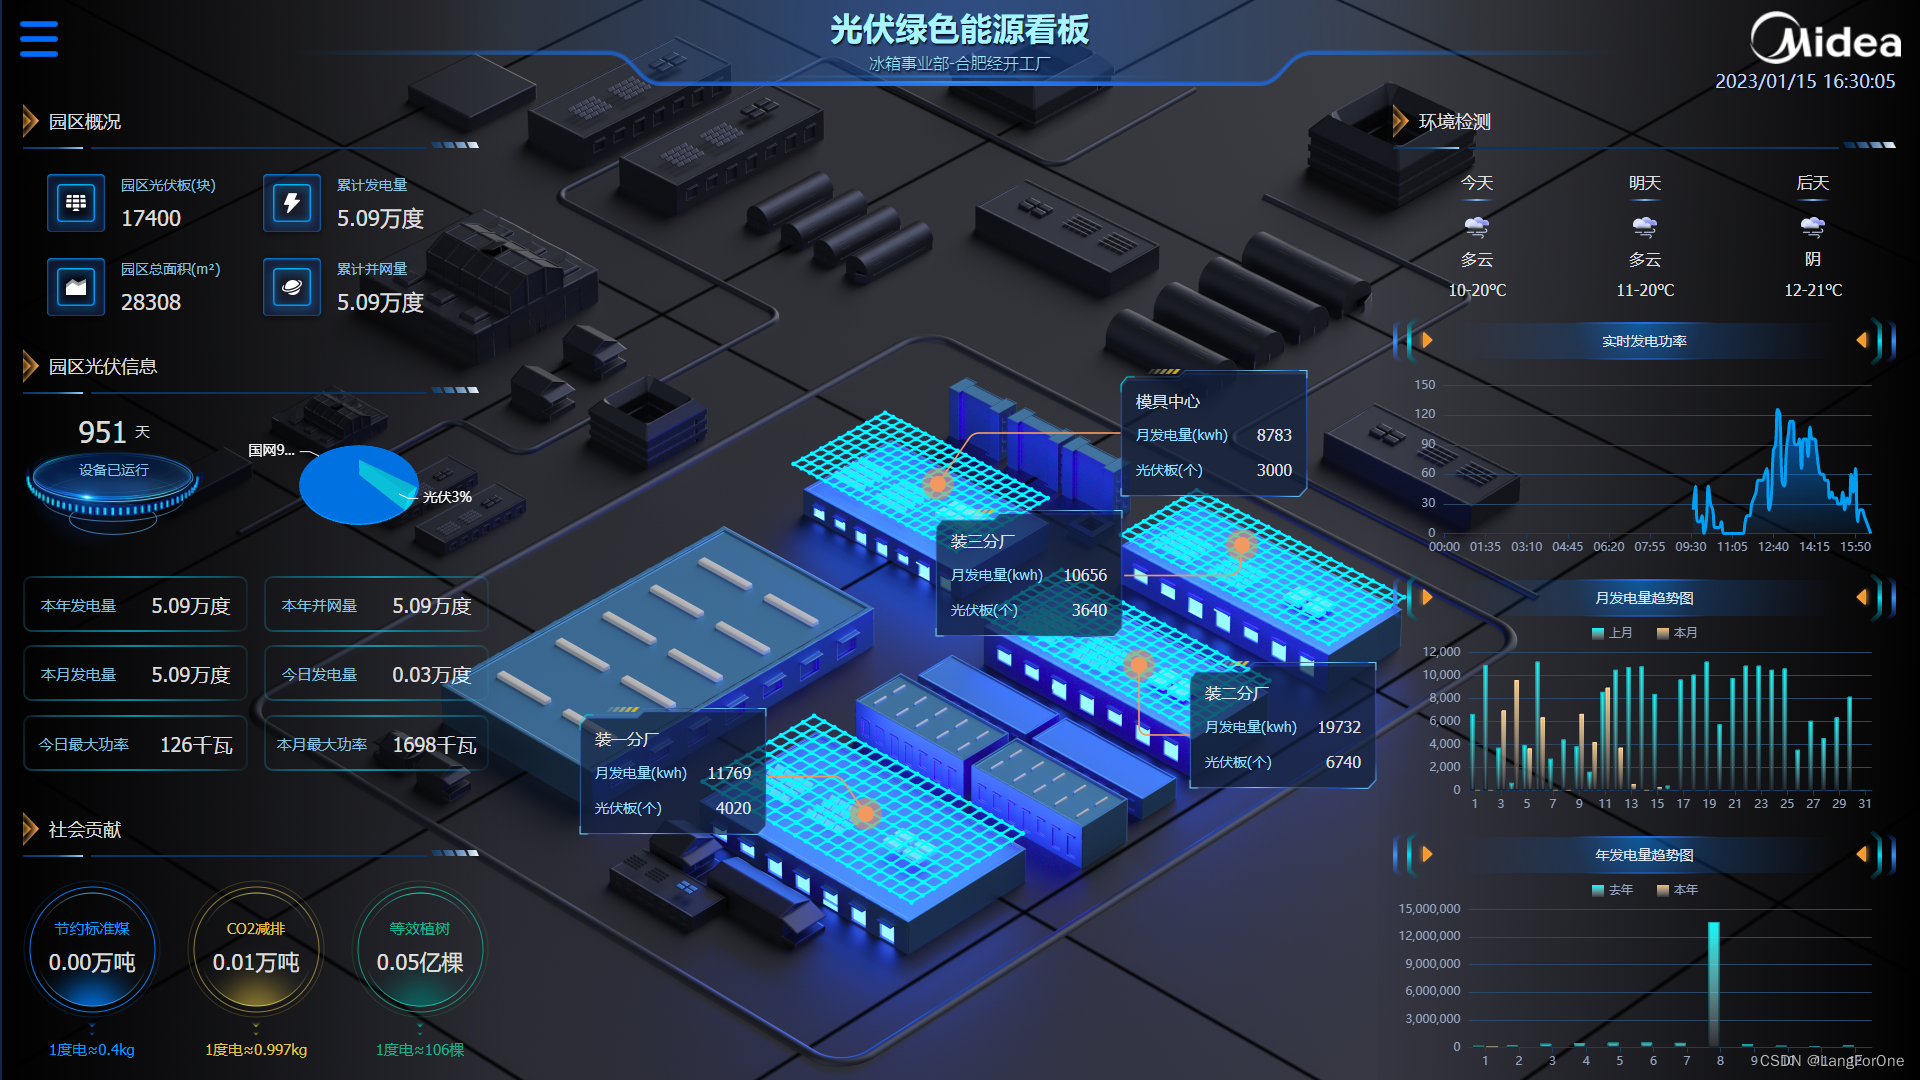
那就直接进入正题吧——
0、可复用组件panel
在讲解各个模块之前,我们先来完成一个安放每个模块title标题的可复用组件:panel
在同一个甚至不同看板内要多次重复使用的样式,将其做成组件会省事很多,这也是面试题中常出现的组件的可重用性。
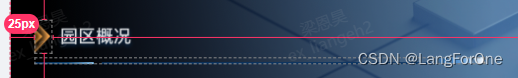
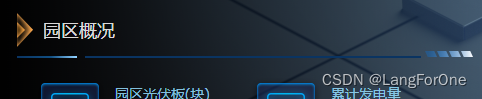
在蓝湖上ued提供的两张图
引入panel文件:
import panel from './components/panel';

export default {
  name: "kanban_photovoltaic_energy",
  components: {
    panel
  },

 ...
组件完整代码:
<template>
  <div class="photovoltaic_panel">
    <div class="title">
      <div class="arrow"></div>
      <div class="title_text">{{title}}</div>
    </div>
    <div class="underline" :style="`width:${underlineWidth}`"></div>
    <slot></slot>
    <!-- `slot`插槽为未来的组件扩展占个地,但按理来说基本用不到 -->
  </div>
</template>
  <script>
export default {
  props: {
    title: {
      type: String,
      default: () => {
        return '表头';
      }
    },
    underlineWidth: {
      type: String,
      default: () => {
        return '456px';
      }
    }
  }
};
  </script>
  <style lang="less">
.photovoltaic_panel {
  overflow: hidden;
  .title {
    font-size: 18px;
    color: rgba(255, 255, 255, 0.85);
    display: flex;
    line-height: 34px;
    margin-bottom: 4px;
    .arrow {
      width: 18px;
      height: 34px;
      background-image: url(./../../../assets/photovoltaicEnergy/panel_arrow.png);
      background-repeat: no-repeat;
      background-size: 100% 100%;
      margin-right: 8px;
    }
  }
  .underline {
    width: 456px;
    height: 7px;
    background-image: url(./../../../assets/photovoltaicEnergy/panel_underline.png);
    background-repeat: no-repeat;
    background-size: 100% 100%;
  }
}
</style>
看板中调用:
<panel :title="'园区概况'"></panel>
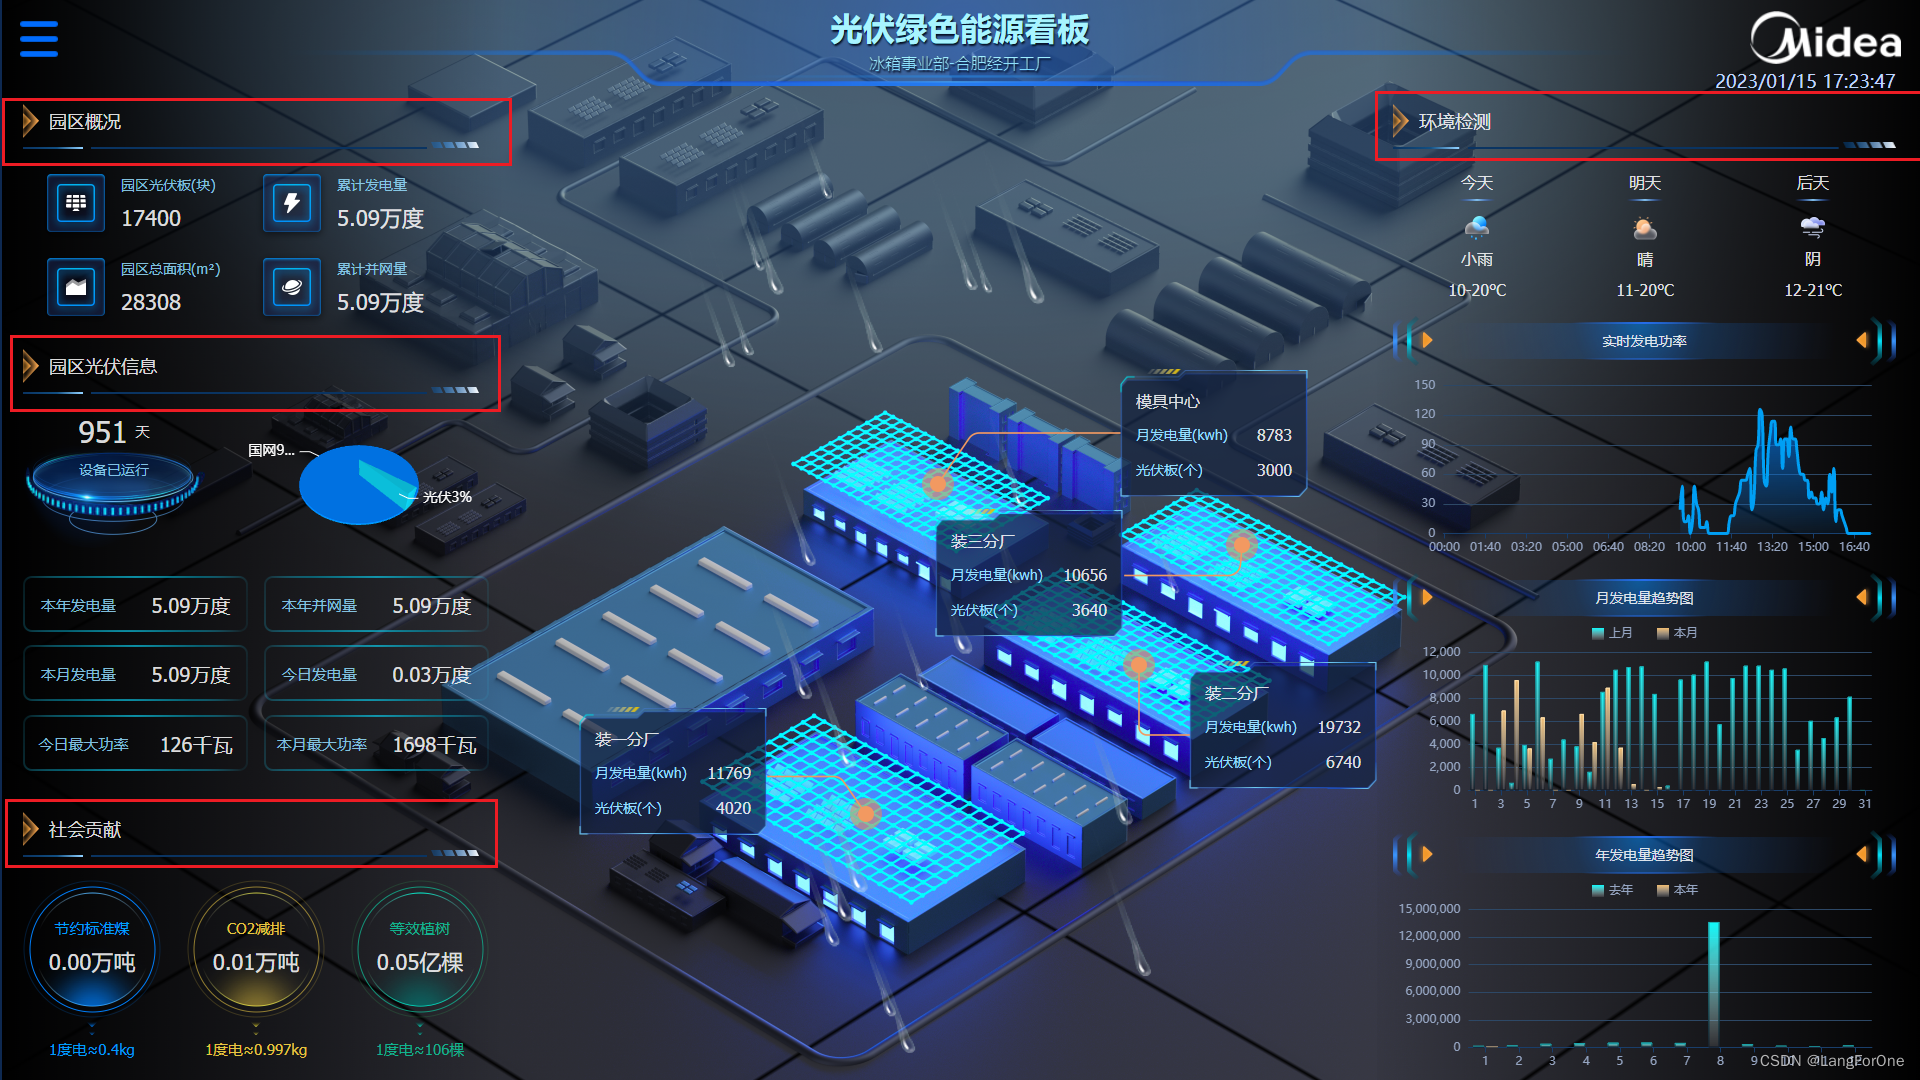
1、动态背景background
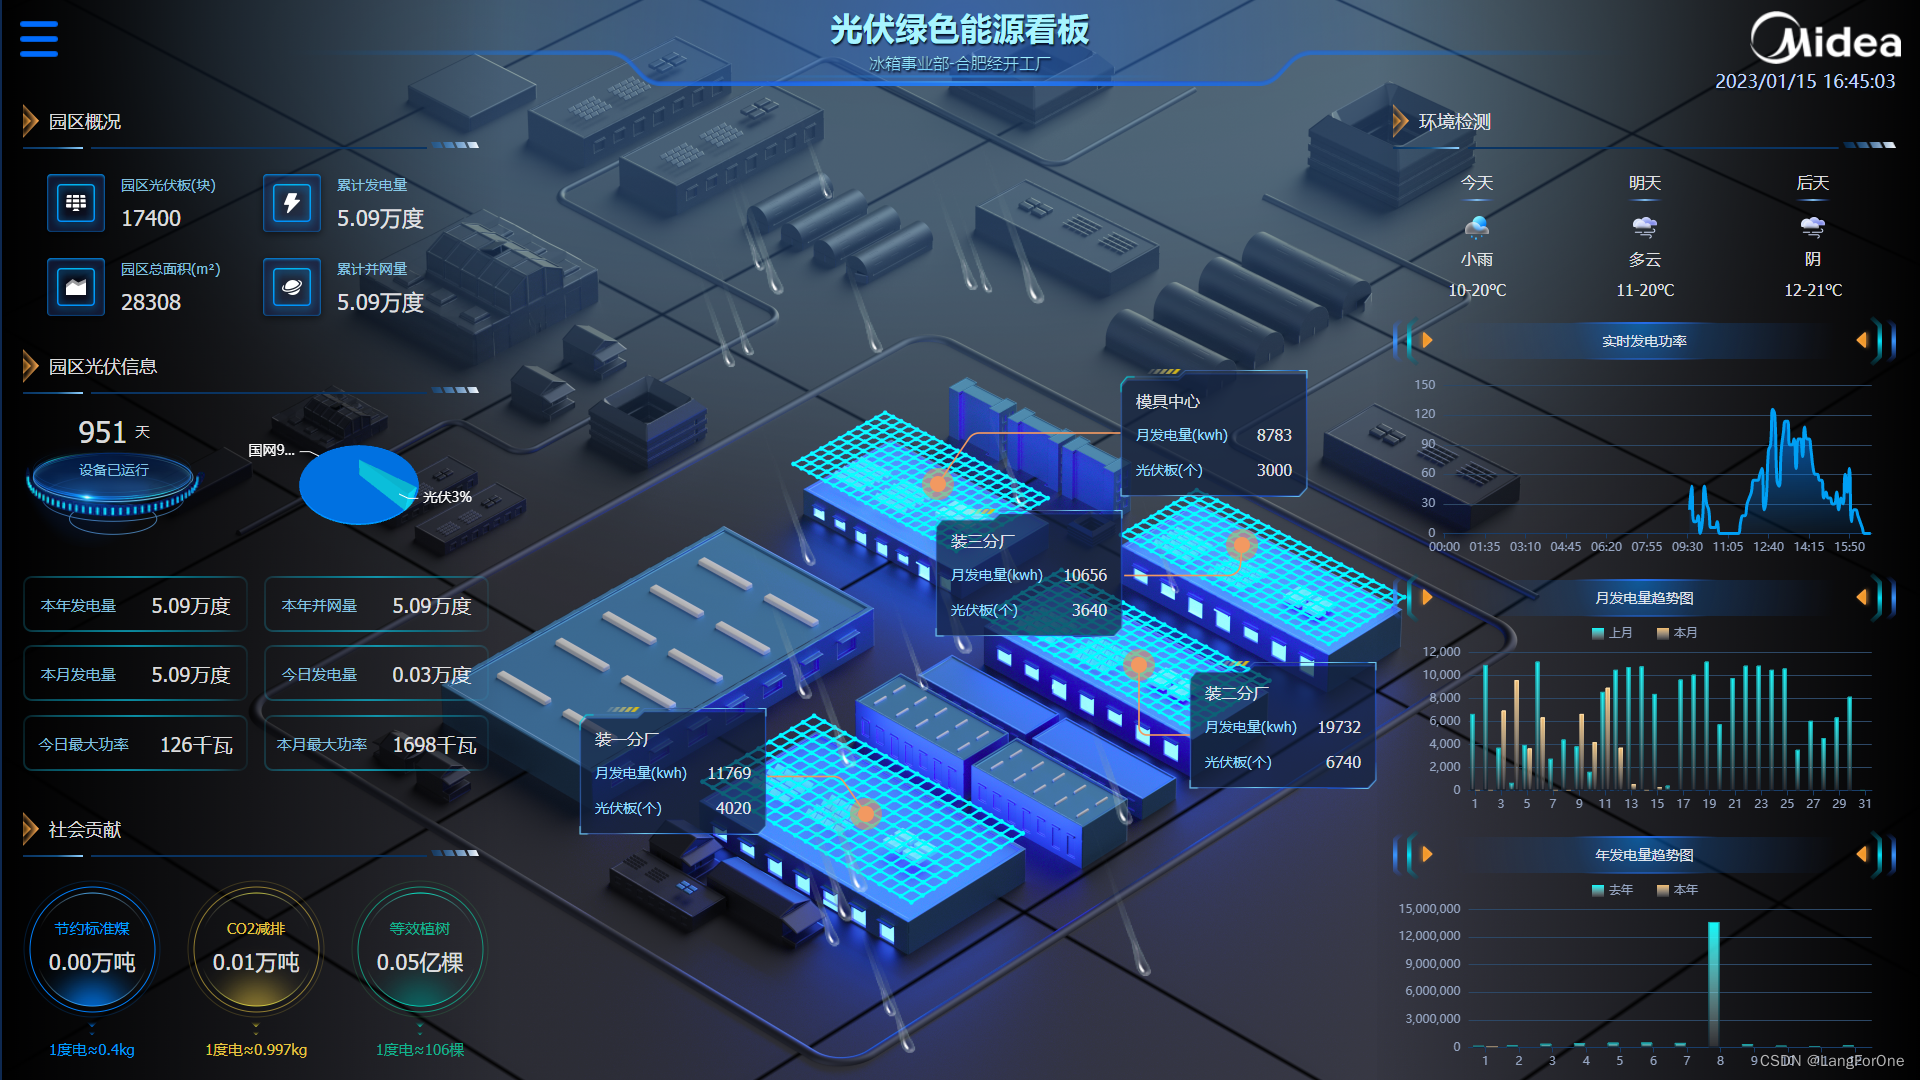
该看板在开启时会调用天气接口获取当天天气,并根据不同的天气给看板表层加不同滤镜,例如:
晴天
雨天
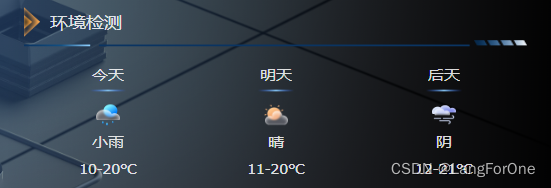
近三天的天气会反映在右上角的环境监测里
来看看这部分怎么实现,首先我们看一下后端给我们的天气接口:
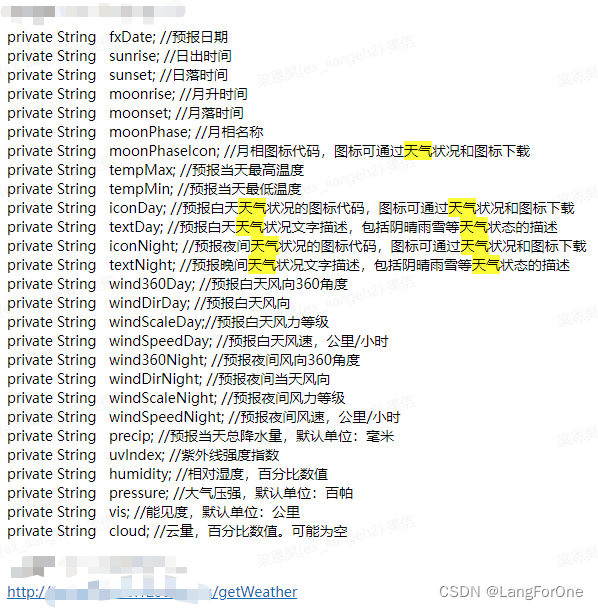
不难发现对我们有用的只有:
private String textDay; //预报白天天气状况文字描述,包括阴晴雨雪等天气状态的描述
private String tempMax; //预报当天最高温度
private String tempMin; //预报当天最低温度
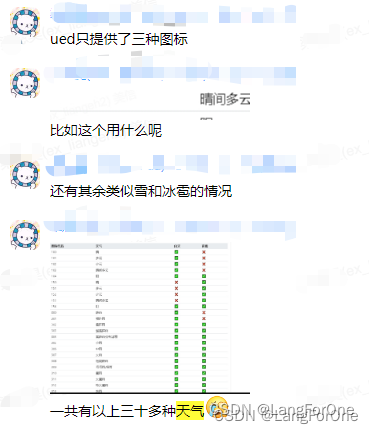
然而textDay的天气类型有几十种,而我们看板上需要显示的只有阴、雨、晴三种
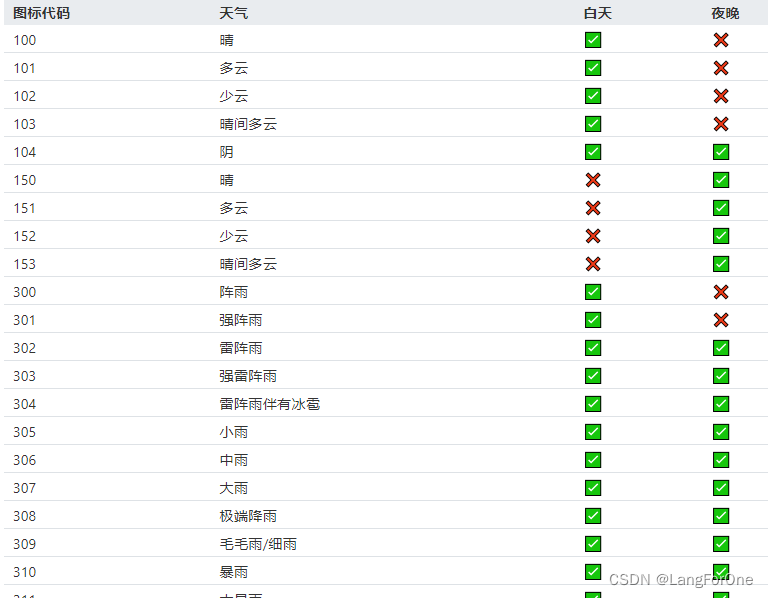
此时该怎么办呢?不要犹豫,直接去找产品询问取值规则:


ok,明白取值规则后,封装一个简单的判断天气的函数:
    // 判断天气
    setWeather(name) {
      let type = '';
      if (name.indexOf('晴') != -1) {
        type = 'sunny';
      } else if (name.indexOf('雨') != -1) {
        type = 'rain';
      } else {
        type = 'cloudy';
      }
      return type
    },
然后在生命周期mounted内执行的search()函数中获取天气:
    search() {
      // 获取城市天气情况
      axios.getWeather().then((res) => {
        if (res && res.data.body.length) {
          this.todayWeather = this.setWeather(res.data.body[0].textDay); // todayWeather用来判断背景图
          for (let i = 0; i < 3; i++) {
            // 数组weatherData用来渲染右上环境监测的数据
            this.weatherData[i].type = this.setWeather(res.data.body[i].textDay);
            this.weatherData[i].wheatherName = res.data.body[i].textDay;
            this.weatherData[i].temp_min = res.data.body[i].tempMin;
            this.weatherData[i].temp_max = res.data.body[i].tempMax;
          }
        }
      })

      // ......
    }
动态背景的实现:在该vue文件最外层的div标签(或占据整个看板全屏的标签)上加一个动态style控制backgroundImage属性:
    <div
      class="kanban_photovoltaic_energy"
      v-loading="loading"
      element-loading-text="loading..."
      element-loading-background="rgba(0, 0, 0, 0.5)"
      :style="{backgroundImage:`url(${todayWeather=='cloudy'?backgroundImg.cloudy:todayWeather=='sunny'?backgroundImg.sunny:backgroundImg.rain})`}"
    >
    <!-- v-loading是elementui提供的加载动画 -->
根据todayWeather的不同而决定backgroundImg引用哪张图片。在data中:
backgroundImg: {
        cloudy: require('./../../assets/photovoltaicEnergy/bg_overcast.png'),
        sunny: require('./../../assets/photovoltaicEnergy/bg_sunny.png'),
        rain: require('./../../assets/photovoltaicEnergy/bg_rain.png'),
      },
当然不要忘了css中给该标签添加background-repeat与background-size属性使得背景图片得以平铺:
.kanban_photovoltaic_energy {
  height: 1080px;
  width: 1920px;
  background-repeat: no-repeat;
  background-size: 100% 100%;

  ......
而右上角的环境监测模块则是直接根据包装处理好的weatherData数组搭配上v-for和css来完成:
标签
          <div class="right_top">
            <panel :title="'环境检测'" :underlineWidth="'503px'"></panel>
            <div class="weather">
              <div class="weather_box" v-for="(item, index) in weatherData" :key="index">
                <div class="label">{{item.label}}</div>
                <div class="line"></div>
                <div class="icon sunny" v-if="item.type == 'sunny'"></div>
                <div class="icon cloudy" v-if="item.type == 'cloudy'"></div>
                <div class="icon rain" v-if="item.type == 'rain'"></div>
                <div class="type">{{item.wheatherName}}</div>
                <div class="temp">{{item.temp_min}}-{{item.temp_max}}℃</div>
              </div>
            </div>
          </div>
css
      .right_top {
        .weather {
          height: 167px;
          display: flex; // 经典flex布局
          justify-content: space-around;
          .weather_box {
            text-align: center;
            .label {
              margin: 24px auto 8px;
            }
            .line {
              width: 36px;
              height: 2px;
              background-image: url(./../../assets/photovoltaicEnergy/weather_line.png);
              background-repeat: no-repeat;
              background-size: 100% 100%;
              margin: 0 auto 15px;
            }
            .icon {
              width: 24px;
              height: 24px;
              background-repeat: no-repeat;
              background-size: 100% 100%;
              margin: 0 auto 0;
            }
            .sunny {
              background-image: url(./../../assets/photovoltaicEnergy/icon_sunny.png);
            }
            .cloudy {
              background-image: url(./../../assets/photovoltaicEnergy/icon_cloudy.png);
            }
            .rain {
              background-image: url(./../../assets/photovoltaicEnergy/icon_rain.png);
            }
            .type {
              margin: 10px auto 12px;
            }
            .temp {
              margin: 0 auto 0;
            }
          }
        }
      }
第一个模块就完成了。
2、 左边一列
基本上也都是用v-for搭配css的flex布局完成,没什么好讲的直接上代码吧,看了代码就懂了。
html:
        <div class="body_left">
          <div class="left_top">
            <panel :title="'园区概况'"></panel>
            <div class="content">
              <div class="box" v-for="(item, index) in overviewData" :key="index">
                <img :src="item.img_url" />
                <div class="text">
                  <div class="title">{{item.title}}</div>
                  <div class="value">{{item.val}}</div>
                </div>
              </div>
            </div>
          </div>
          <div class="left_middle">
            <panel :title="'园区光伏信息'"></panel>
            <div class="info_top">
              <div class="base_days">
                <div class="base_text">设备已运行</div>
                <div class="days_val">
                  {{runningDays}}
                  <div class="unit">天</div>
                </div>
              </div>
              <div class="pieChart" ref="pieChart"></div>
            </div>
            <div class="info_bottom">
              <div class="info_box" v-for="(item, index) in infoData" :key="index">
                <div class="label">{{item.label}}</div>
                <div class="value">{{item.val}}{{item.unit}}</div>
              </div>
            </div>
          </div>
          <div class="left_bottom">
            <panel :title="'社会贡献'"></panel>
            <div class="social_box">
              <div class="social_circle blue">
                节约标准煤
                <div class="social_val">{{socialData.savingCoal}}万吨</div>
                <img :src="socialArrow.blue" />
                1度电≈0.4kg
              </div>
              <div class="social_circle yellow">
                CO2减排
                <div class="social_val">{{socialData.savingCO2}}万吨</div>
                <img :src="socialArrow.yellow" />
                1度电≈0.997kg
              </div>
              <div class="social_circle green">
                等效植树
                <div class="social_val">{{socialData.planting}}亿棵</div>
                <img :src="socialArrow.green" />
                1度电≈106棵
              </div>
            </div>
          </div>
        </div>
date数据:
  data() {
    return {
      overviewData: [
        {
          prop: 'photovoltaicNum',
          title: '园区光伏板(块)',
          val: '--',
          img_url: require('./../../assets/photovoltaicEnergy/icon_photovoltaicNum.png'),
        },
        {
          prop: 'electricTotal',
          title: '累计发电量',
          val: '--万亿度',
          img_url: require('./../../assets/photovoltaicEnergy/icon_electricTotal.png'),
        },
        {
          prop: 'areaVoltaic',
          title: '园区总面积(m²)',
          val: '--',
          img_url: require('./../../assets/photovoltaicEnergy/icon_areaVoltaic.png'),
        },
        {
          prop: 'ongridTotal',
          title: '累计并网量',
          val: '--万亿度',
          img_url: require('./../../assets/photovoltaicEnergy/icon_ongridTotal.png'),
        },
      ],
      infoData: [
        {
          prop: 'yearElectric',
          label: '本年发电量',
          val: '--',
          unit: '万度',
        },
        {
          prop: 'yearElectric',
          label: '本年并网量',
          val: '--',
          unit: '万度',
        },
        {
          prop: 'yearElectric',
          label: '本月发电量',
          val: '--',
          unit: '万度',
        },
        {
          prop: 'yearElectric',
          label: '今日发电量',
          val: '--',
          unit: '万度',
        },
        {
          prop: 'yearElectric',
          label: '今日最大功率',
          val: '--',
          unit: '千瓦',
        },
        {
          prop: 'yearElectric',
          label: '本月最大功率',
          val: '--',
          unit: '千瓦',
        },
      ],
      socialData: {
        savingCoal: '--',
        savingCO2: '--',
        planting: '--',
      },
      socialArrow: {
        blue: require('./../../assets/photovoltaicEnergy/social_arrow_blue.png'),
        yellow: require('./../../assets/photovoltaicEnergy/social_arrow_yellow.png'),
        green: require('./../../assets/photovoltaicEnergy/social_arrow_green.png'),
      },
    };
  },
css:
    .body_left {
      float: left;
      width: 505px;
      height: 100%;
      padding: 104px 16px 0 23px;
      // background: rgba(0, 255, 255, 0.3);
      background: linear-gradient(270deg, rgba(5, 19, 53, 0) 0%, #000000 100%);
      .left_top {
        .content {
          height: 200px;
          width: 100%;
          display: flex;
          flex-wrap: wrap;
          padding: 19px 0 23px 16px;
          .box {
            width: 216px;
            height: 74px;
            margin-bottom: 10px;
            display: flex;
            img {
              width: 74px;
              height: 74px;
              margin-right: 8px;
            }
            .text {
              .title {
                height: 34px;
                line-height: 34px;
                color: rgba(151, 222, 255, 0.85);
                font-size: 14px;
              }
              .value {
                height: 32px;
                line-height: 32px;
                font-size: 22px;
              }
            }
          }
        }
      }
      .left_middle {
        .info_top {
          height: 162px;
          width: 100%;
          display: flex;
          justify-content: space-between;
          .base_days {
            width: 182px;
            height: 104px;
            margin-top: 50px;
            background-image: url(./../../assets/photovoltaicEnergy/base_img.png);
            background-repeat: no-repeat;
            background-size: 100% 100%;
            position: relative;
            .base_text {
              position: absolute;
              font-size: 14px;
              color: rgba(151, 222, 255, 0.85);
              left: 50%;
              transform: translateX(-50%);
              top: 18px;
            }
            .days_val {
              position: absolute;
              font-size: 30px;
              left: 50%;
              transform: translateX(-50%);
              top: -30px;
              display: flex;
              .unit {
                height: 35px;
                line-height: 35px;
                font-size: 14px;
                margin-left: 8px;
              }
            }
          }
          .pieChart {
            width: 260px;
            height: 162px;
          }
        }
        .info_bottom {
          height: 256px;
          padding: 20px 0 28px;
          display: flex;
          flex-wrap: wrap;
          justify-content: space-between;
          .info_box {
            width: 225px;
            height: 56px;
            line-height: 58px;
            font-size: 20px;
            background-image: url(./../../assets/photovoltaicEnergy/info_border.png);
            background-repeat: no-repeat;
            background-size: 100% 100%;
            display: flex;
            justify-content: space-around;
            .label {
              font-size: 15px;
              color: rgba(151, 222, 255, 0.85);
            }
          }
        }
      }
      .left_bottom {
        .social_box {
          height: 138px;
          margin-top: 23px;
          display: flex;
          justify-content: space-between;
          .blue {
            background-image: url(./../../assets/photovoltaicEnergy/circle_blue.png);
            color: rgba(0, 158, 250, 1);
          }
          .yellow {
            background-image: url(./../../assets/photovoltaicEnergy/circle_yellow.png);
            color: rgba(231, 197, 66, 1);
          }
          .green {
            background-image: url(./../../assets/photovoltaicEnergy/circle_green.png);
            color: rgba(16, 178, 143, 1);
          }
          .social_circle {
            height: 138px;
            width: 138px;
            background-repeat: no-repeat;
            background-size: 100% 100%;
            text-align: center;
            font-size: 15px;
            padding-top: 40px;
            .social_val {
              font-size: 22px;
              margin-top: 12px;
              color: rgba(255, 255, 255, 0.85);
            }
            img {
              display: block;
              width: 12px;
              height: 15px;
              margin: 45px auto 6px;
            }
          }
        }
      }
    }
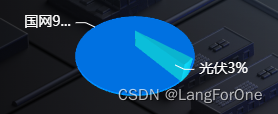
这一块的3D饼图我建议是百度找个案例直接照搬一下,我自己也是复制粘贴后修改数据弄出来的,这玩意代码太长了,不复杂就是很费时间,建议直接ctrl c + ctrl v一下
3、右边一列
待更新