1、SQL执行流程
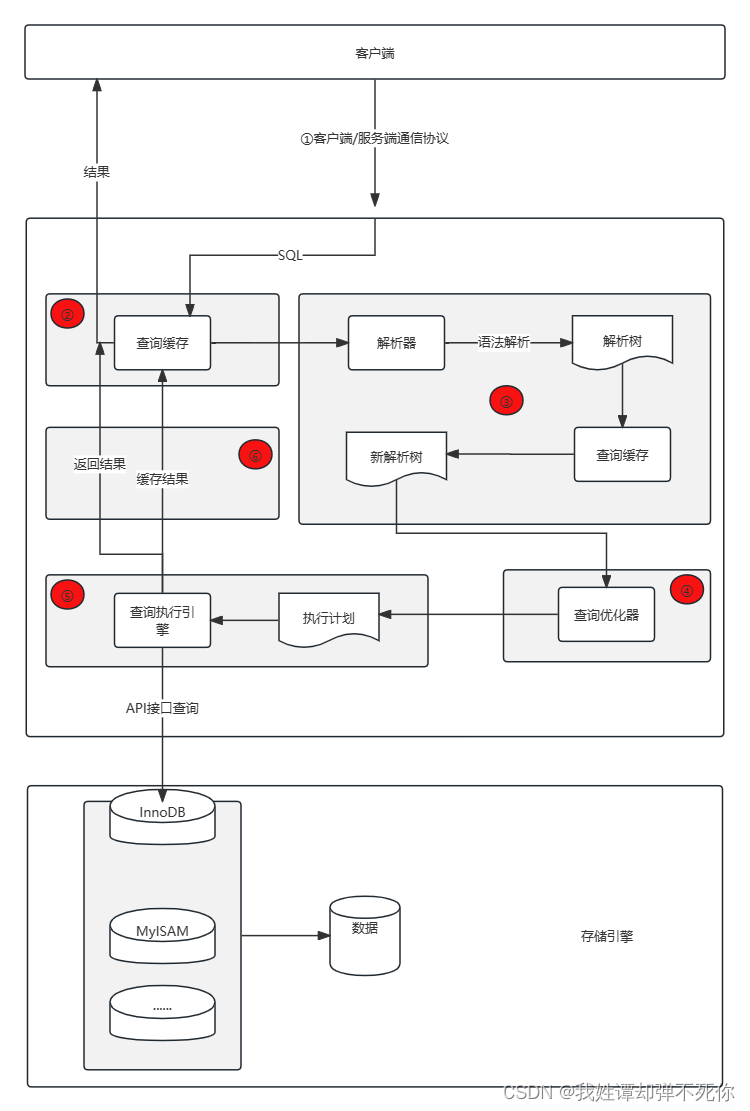
2、查询流程
查询缓存: MySQL服务器如果在查询缓存中存在该SQL语句,就直接将结果返回给客户端,没有就进入解析器解析阶段。(MySQL 8.0 删除该功能)解析器:在解析器中对SQL语句进行语法及语义分析查询优化器:在优化器中确定SQL语句的执行路径,比如:根据全表检索或索引检索。优化器的作用就是找到最好的执行计划。可以分为逻辑查询优化阶段(“通过SQL等价变化”提升查询效率)和物理查询优化阶段(“通过索引和表的连接方式”进行优化)执行器:在执行之前判断当前连接用户是否具备执行权限。没有则返回权限错误,有则执行SQL查询并返回结果。
3、执行原理
①MySQL8.0中SQL执行原理
- 确认profiling是否开启,执行
select @@profiling或show variables like '%prifiling%'查看是否开启计划,开启后可以收集SQL执行时所使用的资源情况。profiling=0 代表关闭,设置为profiling=1表示开启
mysql> show variables like '%profiling%';
+------------------------+-------+
| Variable_name          | Value |
+------------------------+-------+
| have_profiling         | YES   |
| profiling              | OFF   |
| profiling_history_size | 15    |
+------------------------+-------+
3 rows in set (8.27 sec)
mysql> select @@profiling;
+-------------+
| @@profiling |
+-------------+
|           0 |
+-------------+
1 row in set, 1 warning (0.25 sec)
mysql> set profiling=1;
Query OK, 0 rows affected, 1 warning (0.08 sec)

mysql> select @@profiling;
+-------------+
| @@profiling |
+-------------+
|           1 |
+-------------+
1 row in set, 1 warning (0.01 sec)
- 执行相关SQL脚本
- 查看profiles:执行
show profile 和 show profiles语句可以展示当前会话中执行语句的资源使用情况
mysql> show profiles;
+----------+------------+-----------------------------------+
| Query_ID | Duration   | Query                             |
+----------+------------+-----------------------------------+
|        1 | 0.01602275 | select @@profiling                |
|        2 | 0.59588800 | show variables like '%profiling%' |
|        3 | 2.45071500 | show databases                    |
|        4 | 0.08227075 | SELECT DATABASE()                 |
|        5 | 0.03805175 | show databases                    |
|        6 | 1.01924225 | show tables                       |
|        7 | 0.04931425 | SELECT DATABASE()                 |
|        8 | 0.00020850 | show profiling                    |
+----------+------------+-----------------------------------+
8 rows in set, 1 warning (0.05 sec)
- 查看profile:默认查询最近一次SQL语句执行情况
mysql> show profile;
+---------------+----------+
| Status        | Duration |
+---------------+----------+
| starting      | 0.000125 |
| freeing items | 0.000062 |
| cleaning up   | 0.000022 |
+---------------+----------+
3 rows in set, 1 warning (0.17 sec)
如果查看执行某一次SQL执行情况,执行:show profile for query num(num 表示上述show profiles 语句返回的 query_id),如下所示
mysql> show profile for query 7;
+----------------------+----------+
| Status               | Duration |
+----------------------+----------+
| starting             | 0.000052 |
| checking permissions | 0.000007 |
| Opening tables       | 0.000011 |
| init                 | 0.000005 |
| optimizing           | 0.000008 |
| executing            | 0.000009 |
| end                  | 0.000003 |
| query end            | 0.000006 |
| closing tables       | 0.000004 |
| freeing items        | 0.000009 |
| cleaning up          | 0.049202 |
+----------------------+----------+
11 rows in set, 1 warning (0.11 sec)
- 通过查看 show profile all 可以查看MySQL服务器在执行SQL语句时内存,cpu等相关信息。
mysql> show profile all\G
*************************** 1. row ***************************
             Status: starting
           Duration: 0.140282
           CPU_user: 0.068184
         CPU_system: 0.071855
  Context_voluntary: 5
Context_involuntary: 2
       Block_ops_in: 0
      Block_ops_out: 0
      Messages_sent: 0
  Messages_received: 0
  Page_faults_major: 0
  Page_faults_minor: 0
              Swaps: 0
    Source_function: NULL
        Source_file: NULL
        Source_line: NULL
*************************** 2. row ***************************
             Status: freeing items
           Duration: 0.040331
           CPU_user: 0.020129
         CPU_system: 0.020204
  Context_voluntary: 0
Context_involuntary: 0
       Block_ops_in: 0
      Block_ops_out: 0
      Messages_sent: 0
  Messages_received: 0
  Page_faults_major: 0
  Page_faults_minor: 0
              Swaps: 0
    Source_function: dispatch_sql_command
        Source_file: sql_parse.cc
        Source_line: 5042
*************************** 3. row ***************************
             Status: cleaning up
           Duration: 0.000018
           CPU_user: 0.000004
         CPU_system: 0.000006
  Context_voluntary: 0
Context_involuntary: 0
       Block_ops_in: 0
      Block_ops_out: 0
      Messages_sent: 0
  Messages_received: 0
  Page_faults_major: 0
  Page_faults_minor: 0
              Swaps: 0
    Source_function: dispatch_command
        Source_file: sql_parse.cc
        Source_line: 2252
3 rows in set, 1 warning (0.00 sec)
②MySQL5.7中SQL执行原理
- 配置文件中开启查询缓存
[root@rqtanc ~]# vim /etc/my.cnf

[mysqld]
query_cache_type=1

[root@rqtanc ~]# systemctl restart mysqld
- 后续同
MySQL8.0中SQL执行原理


![P9422 [蓝桥杯 2023 国 B] 合并数列](https://img-blog.csdnimg.cn/direct/16ffd2e5020c4ec2a0cf15ba79f85680.png)
