文章目录
- Part.I Introduction
- Part.II 解决方案
- Chap.I plt.savefig
- Chap.II plt.subplots_adjust
- Chap.III plt.margins
- Part.III 探索历程
- Chap.I 默认保存方式
- Chap.II 使用 bbox_inches 参数控制
- Chap.III 自定义留白
- Reference
Part.I Introduction
Python 绘图默认保存,图片边缘空白很多,看起来很难看,本文将探索如何解决 Python 绘图边缘留白问题。

Part.II 解决方案
下面直接上结论
import matplotlib.pyplot as plt
方法一
plt.savefig(path, bbox_inches='tight', pad_inches=0.05, dpi=200)
通过 pad_inches 可以控制留白部分的大小
方法二
plt.subplots_adjust(top=0.93, bottom=0.1, right=0.98, left=0.07, hspace=0, wspace=0)
plt.margins(0.1, 0.1)
plt.savefig(path, dpi=200)
可通过调整 plt.subplots_adjust 函数中的参数值 top/ bottom/ right/ left 等来控制周围留白的多少。
下面将对函数 plt.savefig() 、plt.subplots_adjust() 和 plt.margins() 中的参数进行简要的介绍。
Chap.I plt.savefig
函数原型如下
savefig(fname, *, dpi='figure', format=None, metadata=None,
        bbox_inches=None, pad_inches=0.1,
        facecolor='auto', edgecolor='auto',
        backend=None, **kwargs
       )
其中:
fname:图片的保存路径(含文件名)dpi:图片分辨率,一般设为300就很清晰了format:图片保存格式,如png/ pdf/ svg ...metadata:要存储在图像元数据中的键/值对。支持的键和默认值取决于图像格式和后端(比较高深,一般用不到)。bbox_inches:可取str或Bbox。其中Bbox是以英寸为单位的边界框,仅保存图形的给定部分。如果设为tight,那么则以『紧凑』模式保存图形。pad_inches:浮点数,当bbox_inches='tight'时,图形周围的空白,默认0.1,建议0.05~0.2.facecolor:前景色,绘图区域以外的部分颜色设置edgecolor:xx颜色,(不知道)
Chap.II plt.subplots_adjust
函数原型如下
subplots_adjust(left = None, bottom = None, right = None, top = None, wspace = None, hspace = None)
其中
left:左边缘的位置bottom:下边缘的位置right:右边缘的位置top:上边缘的位置wspace:子图间的横向距离,一幅图不考虑hspace:子图间的竖向距离,一幅图不考虑
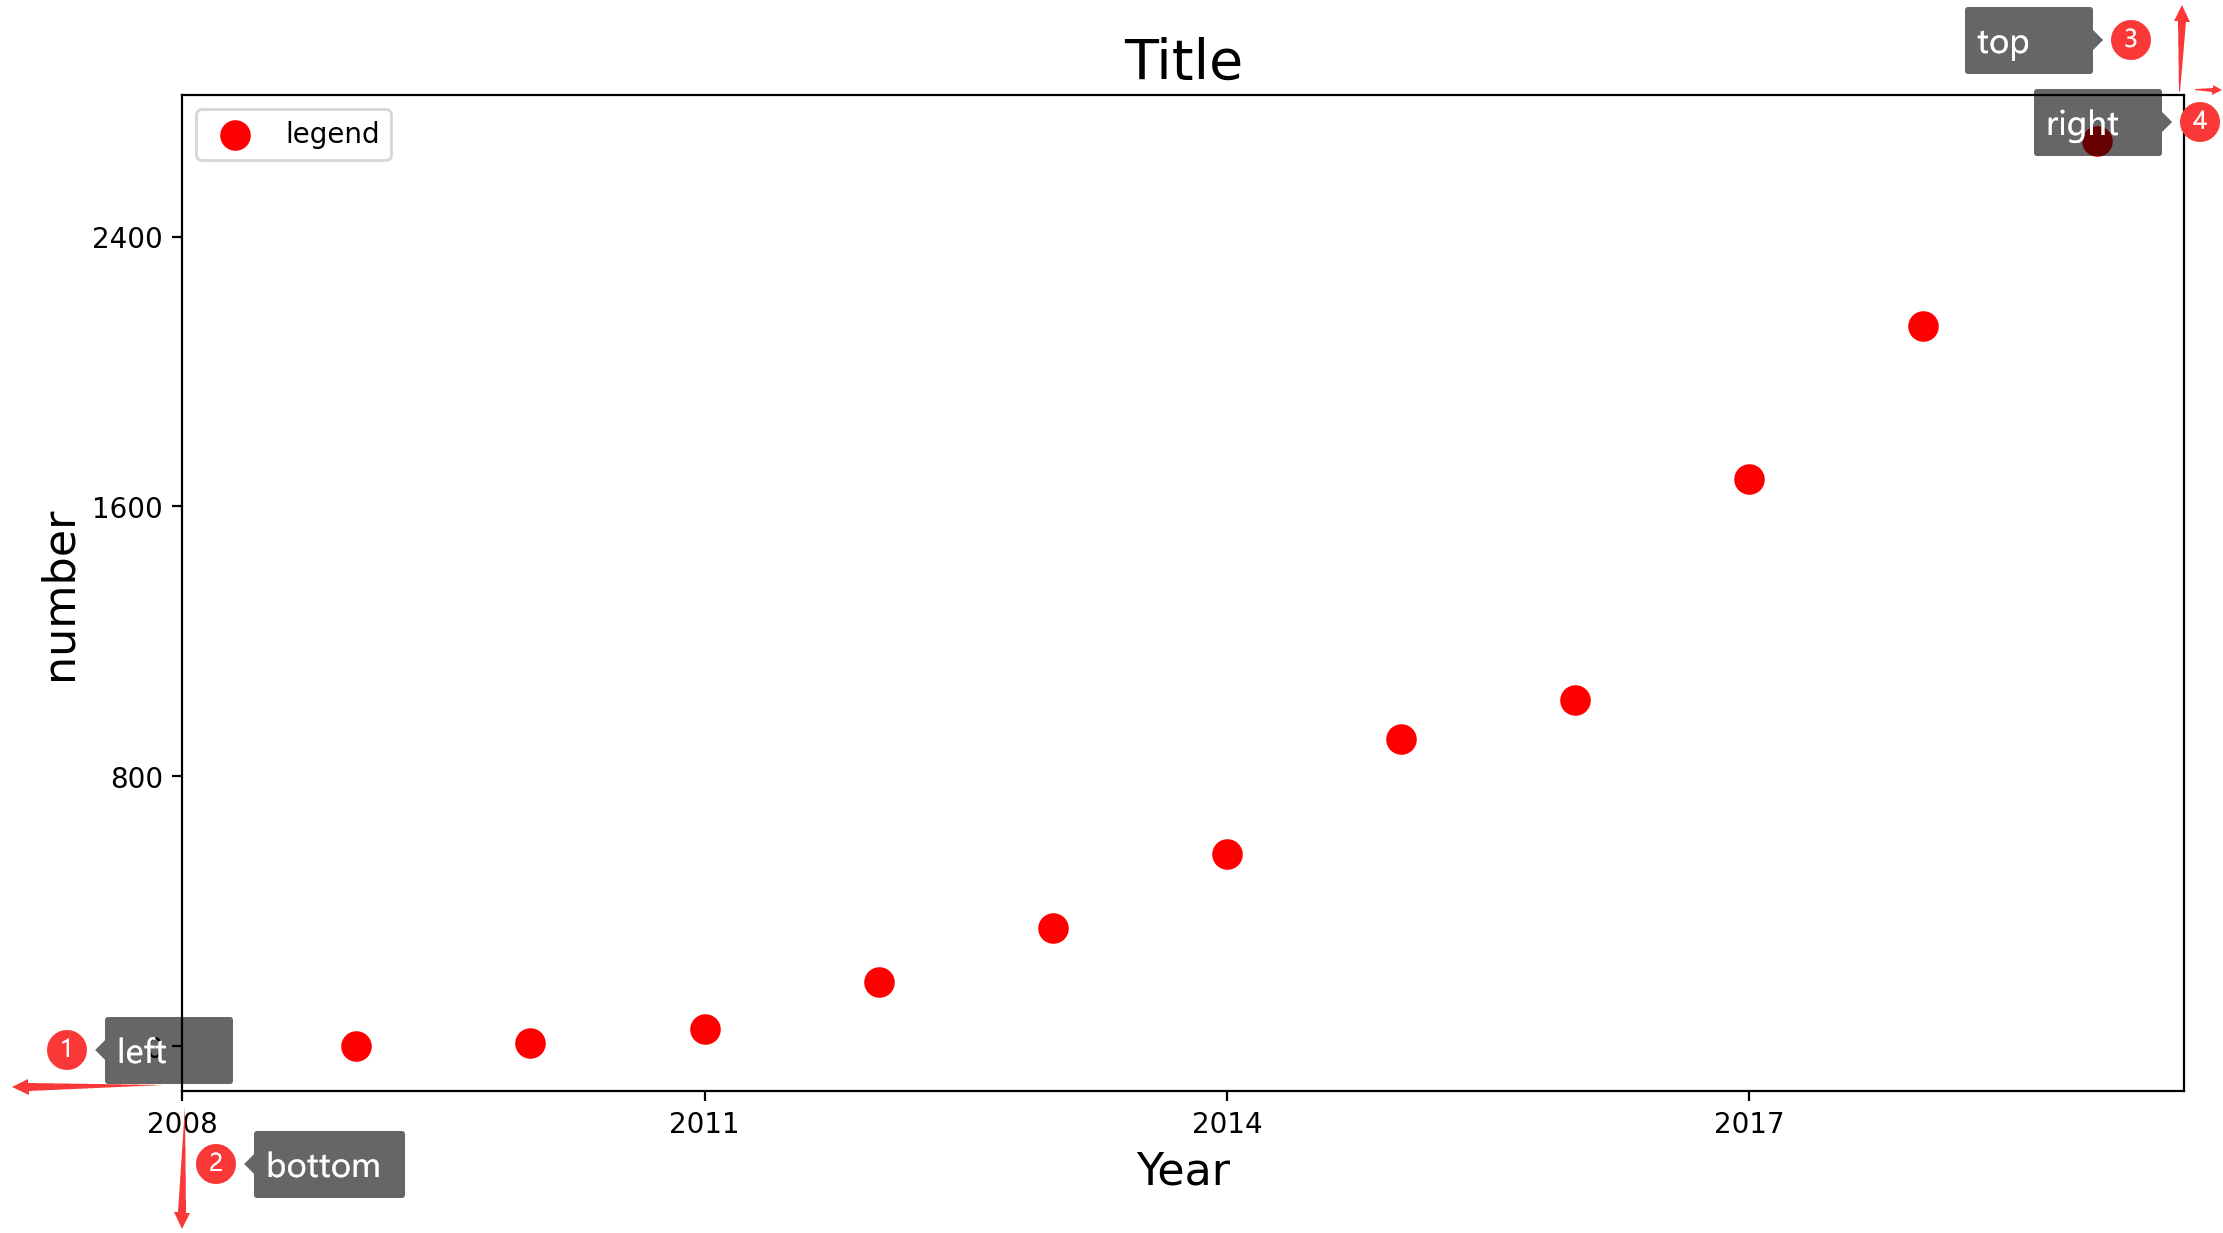
Chap.III plt.margins
函数原型如下:
margins(x = None, y = None, tight = True)
图像到黑框的距离,取值为[0,1]
Part.III 探索历程
测试所用的绘图代码如下:
import matplotlib.pyplot as plt

def test():
    years = [2009, 2010, 2011, 2012, 2013, 2014, 2015, 2016, 2017, 2018, 2019]
    turnovers = [0.5, 9.36, 52, 191, 350, 571, 912, 1027, 1682, 2135, 2684]
    fig, ax = plt.subplots(1, 1, figsize=(11, 6), dpi=100, facecolor='w')
    plt.scatter(years, turnovers, c='red', s=100, label='legend')
    plt.xticks(range(2008, 2020, 3))
    plt.yticks(range(0, 3200, 800))
    plt.xlabel("Year", fontdict={'size': 16})
    plt.ylabel("number", fontdict={'size': 16})
    plt.title("Title", fontdict={'size': 20})
    plt.legend(loc='best')
    path=r'A:\OHanlon\Desktop\temp\a.png'
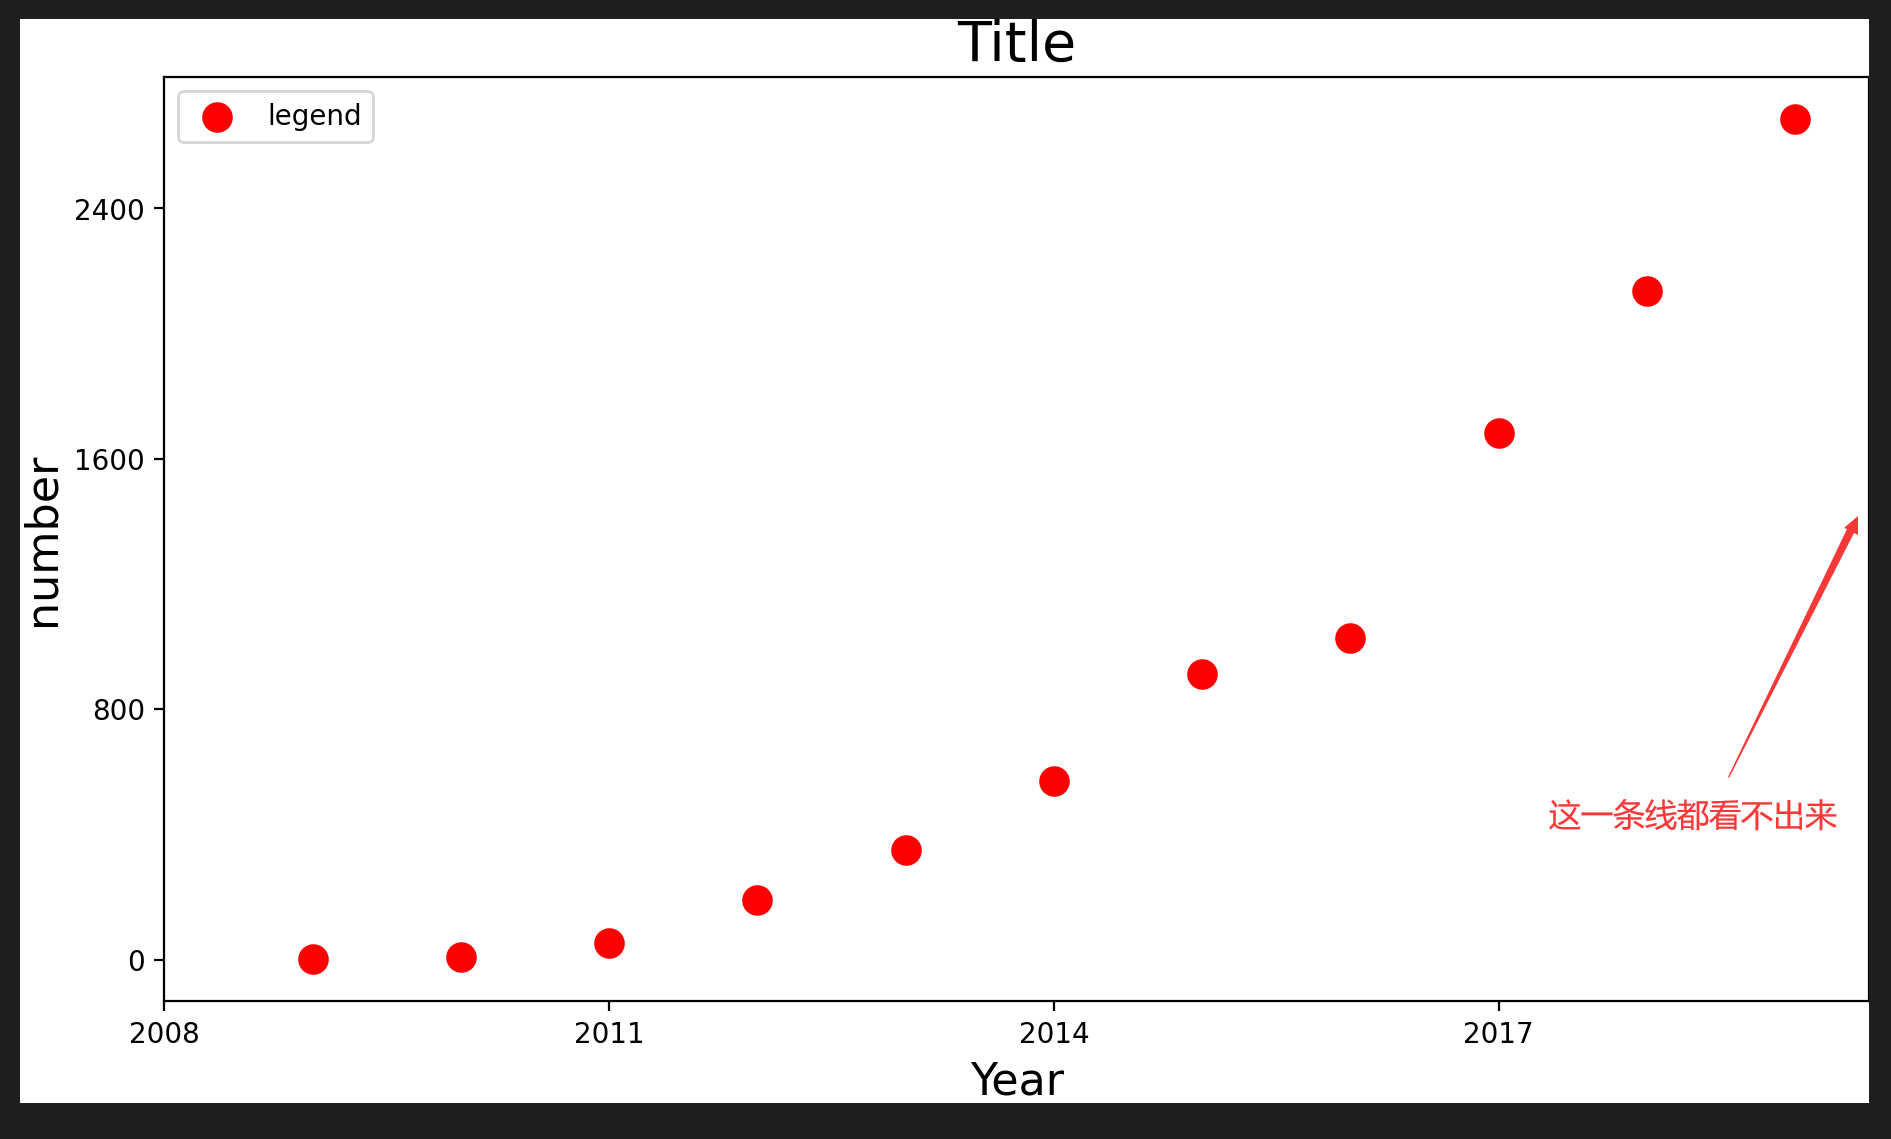
Chap.I 默认保存方式
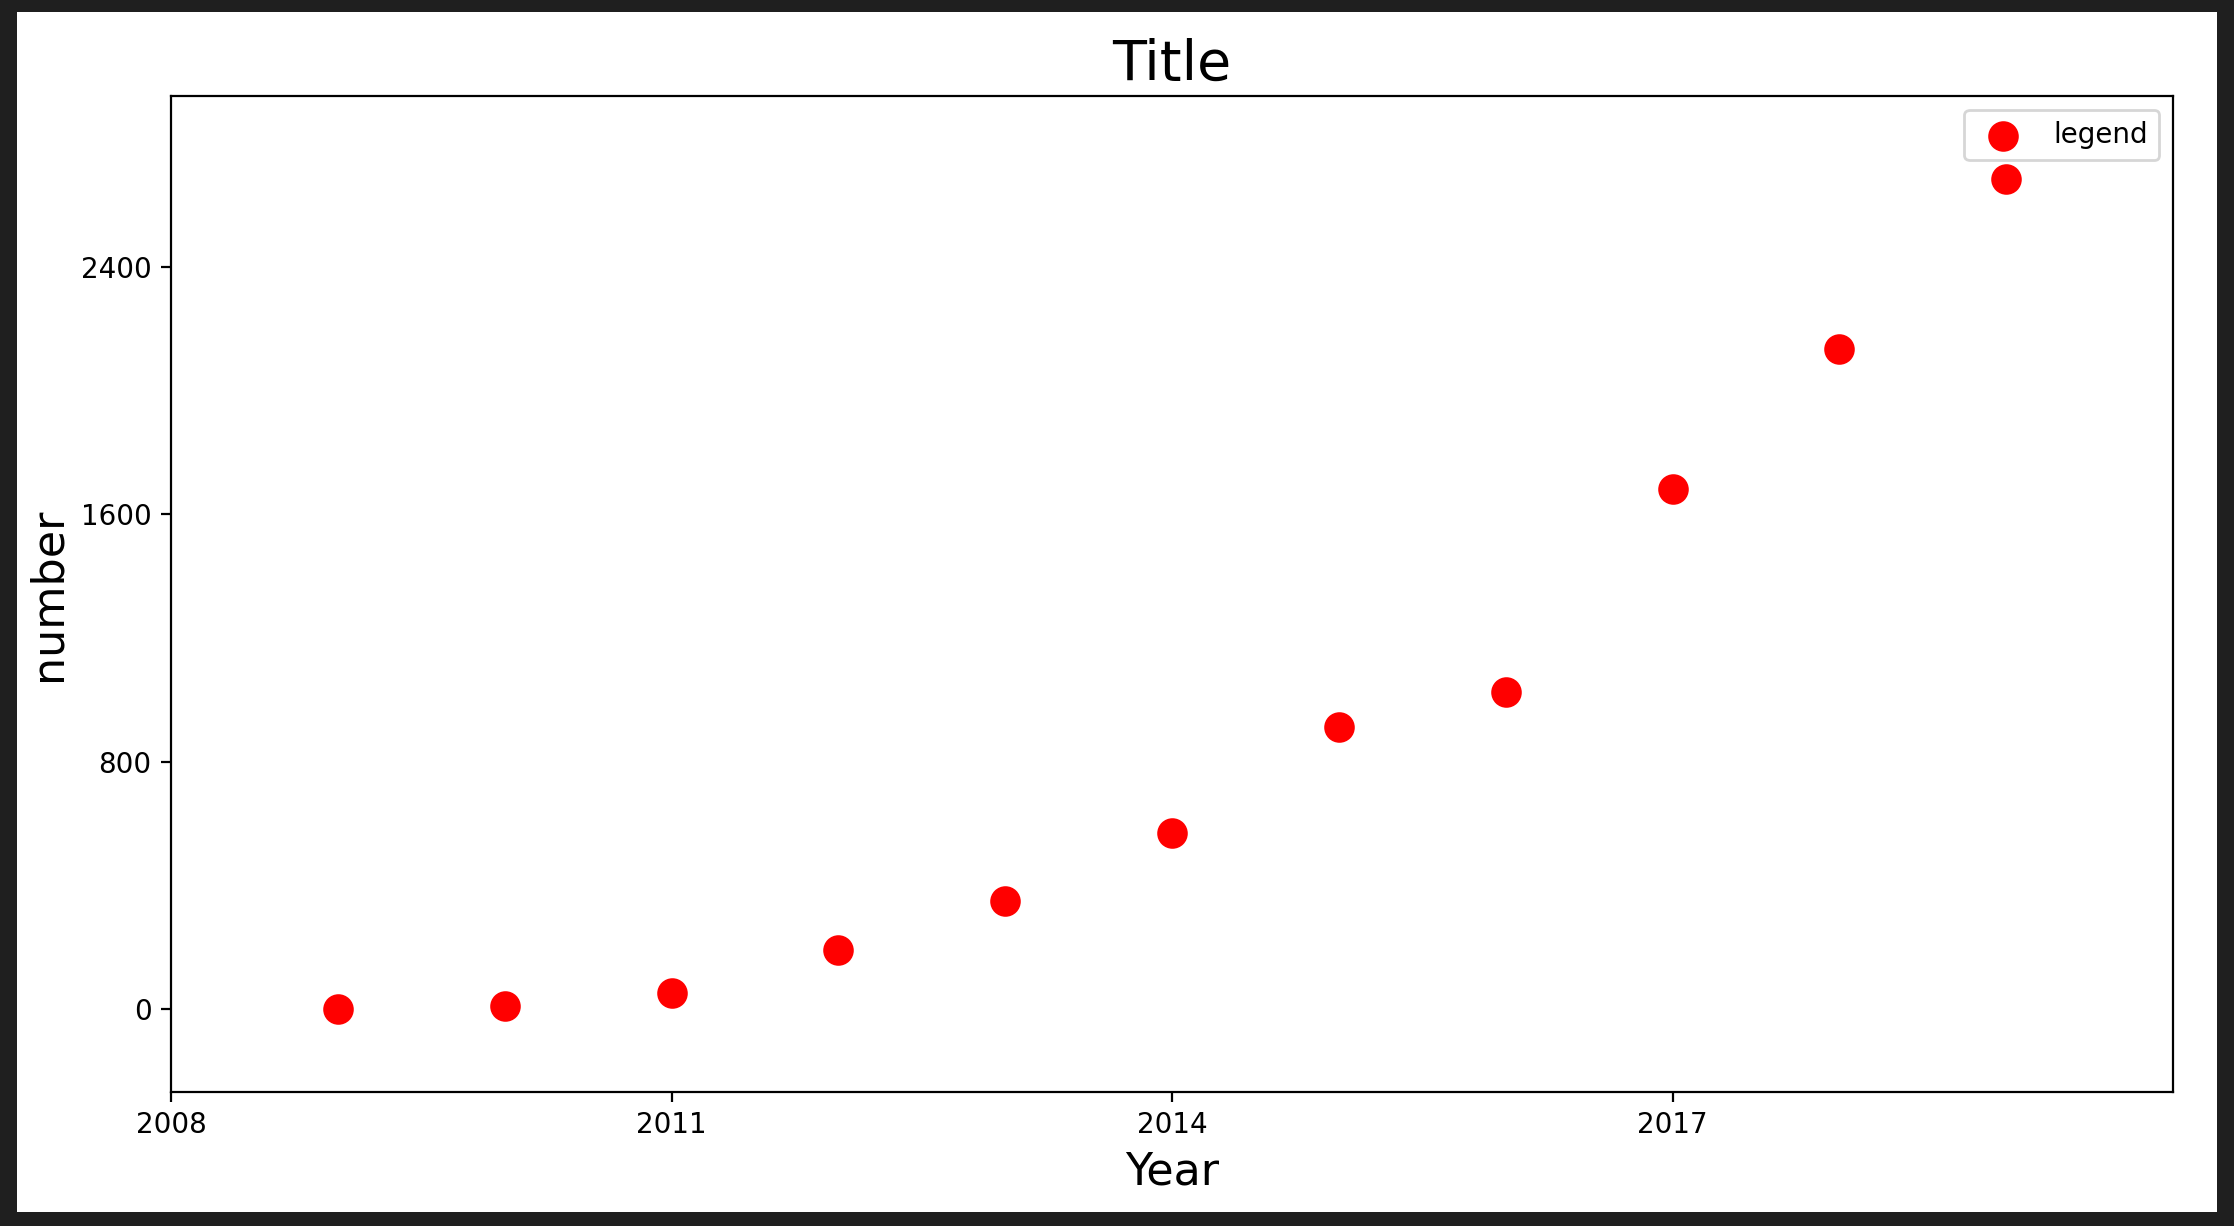
在上面函数最后一行后面追加
plt.savefig(path, dpi=200)
为了能看出来图片边缘留白部分,用了一个黑框将其框起来了,如下图所示。可以看出默认情况下图片边缘留白部分很大。

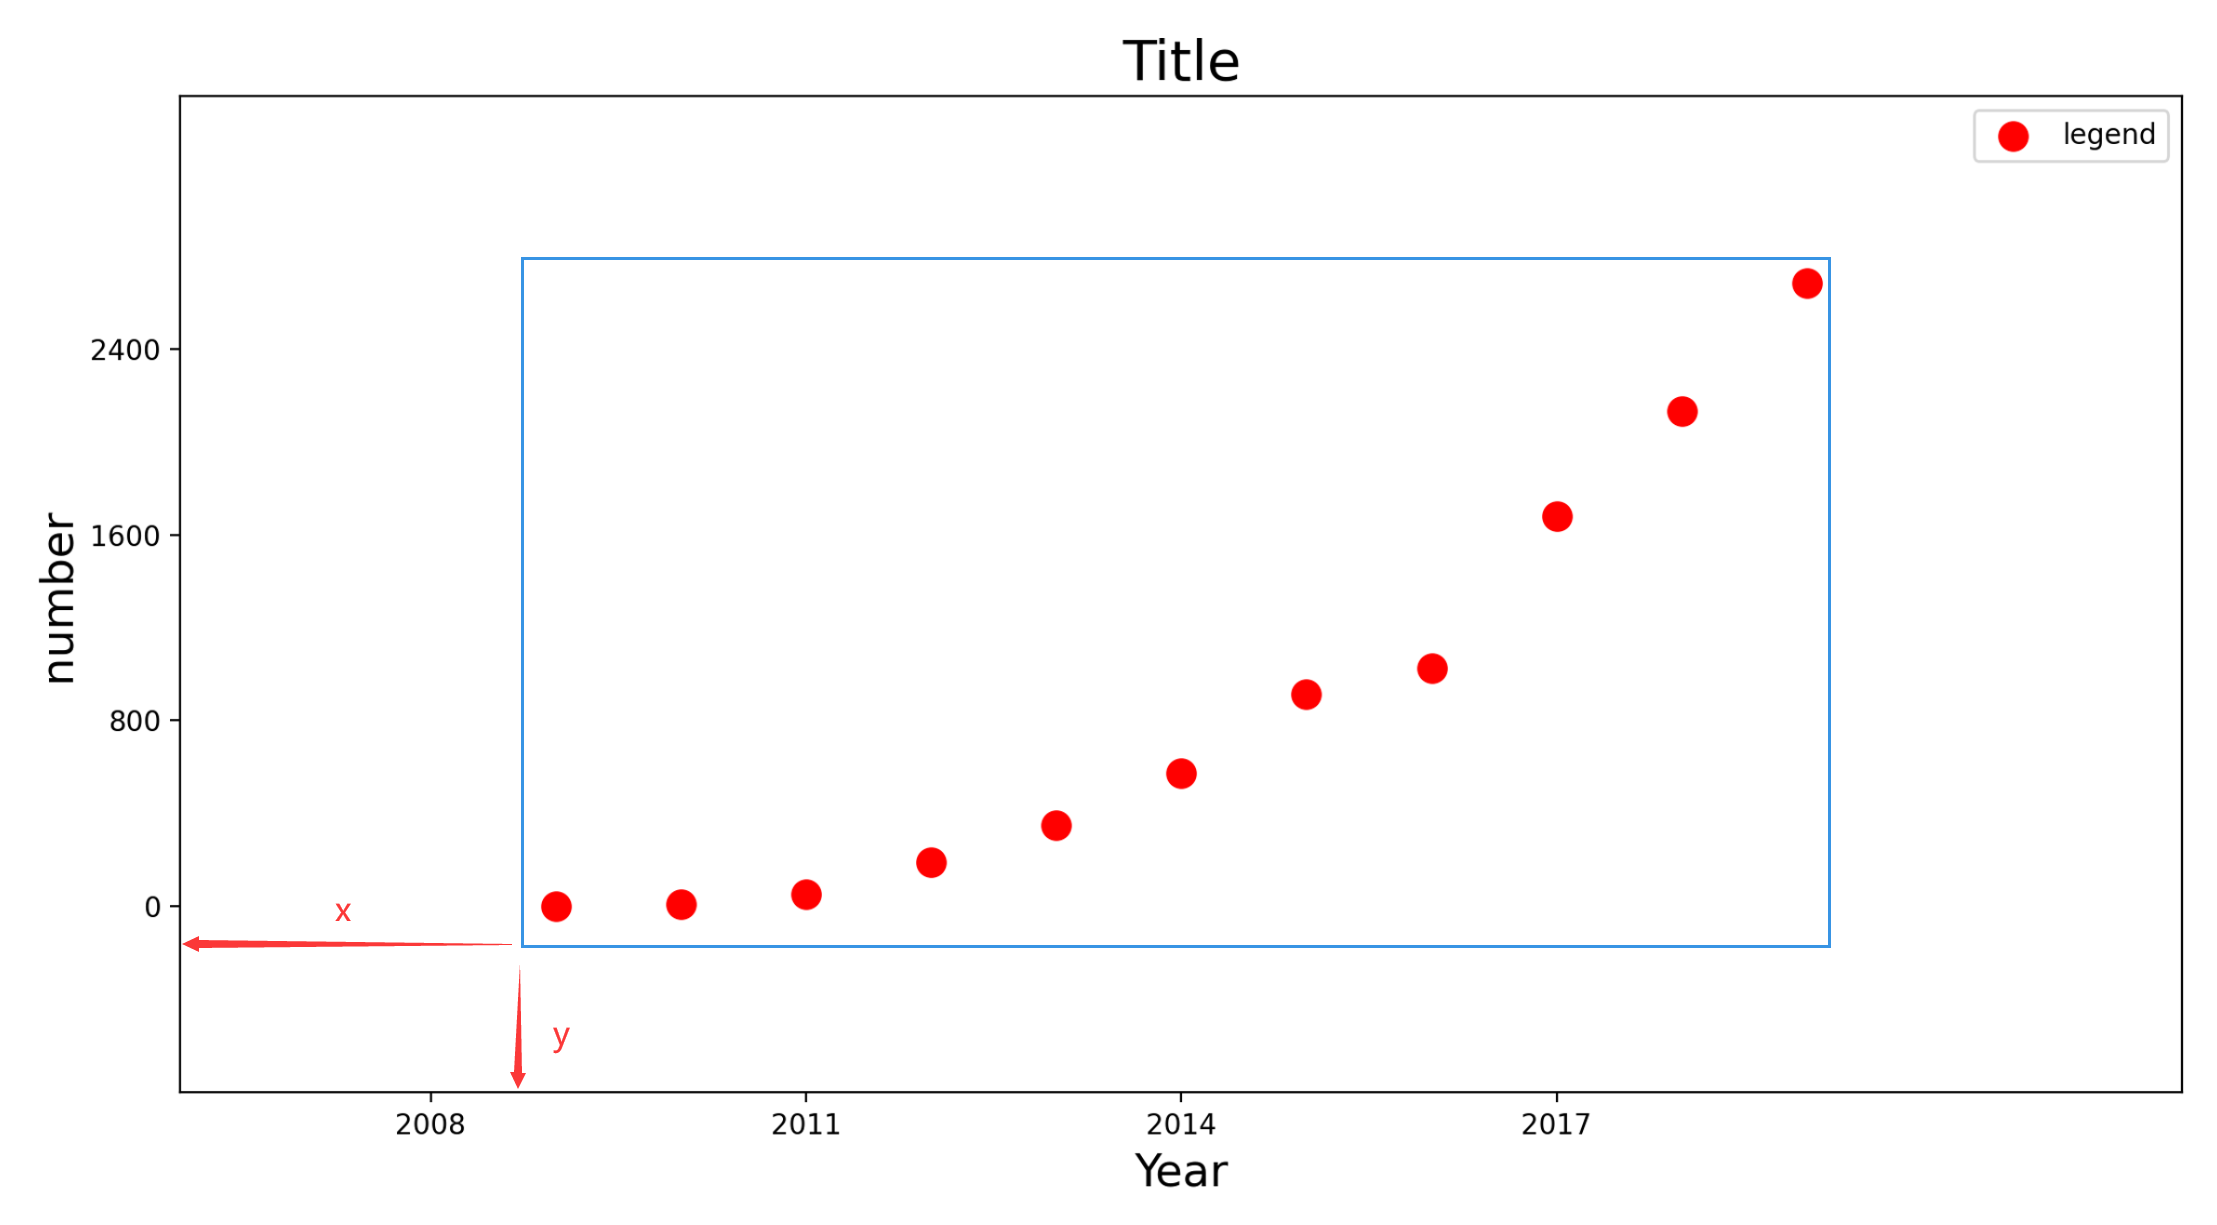
Chap.II 使用 bbox_inches 参数控制
在上面函数最后一行后面追加
plt.savefig(path, bbox_inches='tight', pad_inches=0, dpi=200)
在这种情况下最右边的框线都看不出来了,留白太小了(后来发现是因为 pad_inches=0 的设置)。
Chap.III 自定义留白
在上面函数最后一行后面追加
plt.subplots_adjust(top=0.93, bottom=0.1, right=0.98, left=0.07, hspace=0, wspace=0)
plt.margins(0.1, 0.1)
plt.savefig(path, dpi=200)
通过调整 plt.subplots_adjust 函数中的参数值 top/ bottom/ right/ left 等来控制周围留白的多少,十分方便。
Reference
- 【python】解决maplotlib边缘留白太多
- matplotlib 官网