在matplotlib中控制colorbar的长度
使用matplotlib绘制带颜色的箭头图,有时想直接把颜色条拿来当比例尺条,就需要控制颜色条的长度。
1. pyplot.colorbar()参数说明
pyplot.colorbar(mappable, ax, cax, **kwargs)
mappable是一个ScalarMappble类型的对象,它包括了一个标准化方法norm和一个颜色映射cmap
cax是绘制colorbar的axes。若设置了此项参数,ax参数无效。这个参数与ax的区别见下一节
ax是一个或多个parent axes,意思是会从这几个parent axes中留出空间绘制颜色条。
location,可以取’right’(默认值)、‘left’、‘bottom’、‘top’。指定colorbar在图中的位置。
orientation,颜色条的方向,None or {‘vertical’, ‘horizontal’}
fraction, 浮点类型,默认值0.15。原始的轴有多少用于绘制colorbar。
shrink,浮点类型,颜色条的缩放比例。默认为1,若取0.1则绘制原来尺寸的0.1倍大小
2. cax参数与ax参数的区别
使用ax参数的示例代码如下:这段代码设置了两个子图,并在两个子图中用箭头绘制函数
Z
=
(
Z
1
−
Z
2
)
∗
2
=
(
e
−
x
2
−
y
2
−
e
−
(
x
−
1
)
2
−
(
y
−
1
)
2
)
∗
2
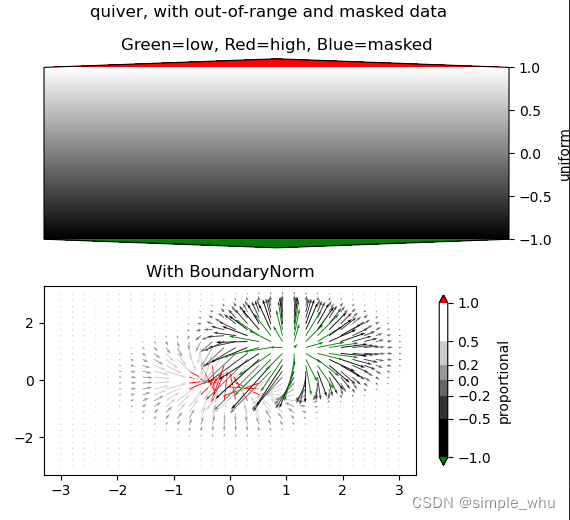
Z=(Z1-Z2)*2=(e^{-x^2-y^2}-e^{-(x-1)^2-(y-1)^2})*2
Z=(Z1−Z2)∗2=(e−x2−y2−e−(x−1)2−(y−1)2)∗2的梯度分布。梯度箭头共30*30个,用红色和绿色表示过高、过低的Z值,并且过滤掉大于1.2的Z值。在两个子图分别以Normalize线性标准化和BoundaryNorm边界标准化方式将Z映射到颜色值,并绘制对应的颜色条。
import matplotlib.pyplot as plt
import numpy as np

import matplotlib.colors as colors

# compute some interesting data
x0, x1 = -3, 3
y0, y1 = -3, 3
x = np.linspace(x0, x1, 30)
y = np.linspace(y0, y1, 30)
X, Y = np.meshgrid(x, y)
Z1 = np.exp(-X**2 - Y**2)
Z2 = np.exp(-(X - 1)**2 - (Y - 1)**2)
Z = (Z1 - Z2) * 2
U = 4*(-X*Z1+(X-1)*Z2)
V = 4*(-Y*Z1+(Y-1)*Z2)
# Set up a colormap:
palette = plt.cm.gray.with_extremes(over='r', under='g', bad='b')

Zm = np.ma.masked_where(Z > 1.2, Z)

# set up the Axes objects
fig, (ax1, ax2) = plt.subplots(nrows=2, figsize=(6, 5.4))

# plot using 'continuous' colormap
im = ax1.quiver(X,Y,U,V,Zm, #interpolation='bilinear',
                cmap=palette,
                norm=colors.Normalize(vmin=-1.0, vmax=1.0),
                scale=20)
ax1.set_title('Green=low, Red=high, Blue=masked')
cbar = fig.colorbar(im, extend='both', shrink=0.9, ax=ax1)
cbar.set_label('uniform')
ax1.tick_params(axis='x', labelbottom=False)

# Plot using a small number of colors, with unevenly spaced boundaries.
im = ax2.quiver(X,Y,U,V,Zm,# interpolation='nearest',
                cmap=palette,
                norm=colors.BoundaryNorm([-1, -0.5, -0.2, 0, 0.2, 0.5, 1],
                                         ncolors=palette.N),
                scale=20)
ax2.set_title('With BoundaryNorm')
cbar = fig.colorbar(im, extend='both', spacing='proportional',
                    shrink=0.9, ax=ax2)
cbar.set_label('proportional')

fig.suptitle('quiver, with out-of-range and masked data')
plt.show()
绘制结果如图所示:

上面的代码中,绘图区有两个子图,每个子图各有一个axes。任何一个axes传给cax参数,会导致这个axes负责的绘图区都用来画颜色条。下面,我们将第一个子图的axes传递给coloarbar的cax参数看看效果:
### 上略
cbar = fig.colorbar(im, extend='both', shrink=0.9, cax=ax1)# 修改这里
cbar.set_label('uniform')
### 下略
效果如图所示:
这就是设置cax的效果。它有什么好处呢?注意,ax参数的axes都会被适当调整以容纳颜色条。当我们想保持绘图的axes布局不变时,就不希望将
颜色条加到当前的axes中,也就是说,不希望设置ax参数。这时,往往会创建第三个子图,用来绘制颜色条。使用cax参数的示例代码:
import matplotlib.pyplot as plt

from matplotlib import cbook


def get_demo_image():
    z = cbook.get_sample_data("axes_grid/bivariate_normal.npy")  # 15x15 array
    return z, (-3, 4, -4, 3)


def demo_simple_image(ax):
    Z, extent = get_demo_image()

    im = ax.imshow(Z, extent=extent)
    cb = plt.colorbar(im)
    cb.ax.yaxis.set_tick_params(labelright=False)


def demo_locatable_axes_hard(fig):
    from mpl_toolkits.axes_grid1 import Size, SubplotDivider

    divider = SubplotDivider(fig, 2, 2, 2, aspect=True)

    # axes for image
    ax = fig.add_subplot(axes_locator=divider.new_locator(nx=0, ny=0))
    # axes for colorbar
    ax_cb = fig.add_subplot(axes_locator=divider.new_locator(nx=2, ny=0))

    divider.set_horizontal([
        Size.AxesX(ax),  # main axes
        Size.Fixed(0.05),  # padding, 0.1 inch
        Size.Fixed(0.2),  # colorbar, 0.3 inch
    ])
    divider.set_vertical([Size.AxesY(ax)])

    Z, extent = get_demo_image()

    im = ax.imshow(Z, extent=extent)
    plt.colorbar(im, cax=ax_cb)
    ax_cb.yaxis.set_tick_params(labelright=False)


def demo_locatable_axes_easy(ax):
    from mpl_toolkits.axes_grid1 import make_axes_locatable

    divider = make_axes_locatable(ax)

    ax_cb = divider.append_axes("right", size="5%", pad=0.05)
    fig = ax.get_figure()
    fig.add_axes(ax_cb)

    Z, extent = get_demo_image()
    im = ax.imshow(Z, extent=extent)

    plt.colorbar(im, cax=ax_cb)
    ax_cb.yaxis.tick_right()
    ax_cb.yaxis.set_tick_params(labelright=False)


def demo_images_side_by_side(ax):
    from mpl_toolkits.axes_grid1 import make_axes_locatable

    divider = make_axes_locatable(ax)

    Z, extent = get_demo_image()
    ax2 = divider.append_axes("right", size="100%", pad=0.05)
    fig1 = ax.get_figure()
    fig1.add_axes(ax2)

    ax.imshow(Z, extent=extent)
    ax2.imshow(Z, extent=extent)
    ax2.yaxis.set_tick_params(labelleft=False)


def demo():
    fig = plt.figure(figsize=(6, 6))

    # PLOT 1
    # simple image & colorbar
    ax = fig.add_subplot(2, 2, 1)
    demo_simple_image(ax)

    # PLOT 2
    # image and colorbar with draw-time positioning -- a hard way
    demo_locatable_axes_hard(fig)

    # PLOT 3
    # image and colorbar with draw-time positioning -- an easy way
    ax = fig.add_subplot(2, 2, 3)
    demo_locatable_axes_easy(ax)

    # PLOT 4
    # two images side by side with fixed padding.
    ax = fig.add_subplot(2, 2, 4)
    demo_images_side_by_side(ax)

    plt.show()
demo()
在上面的代码中,新建了subplot,并把它的axes传递给cax参数以便绘制颜色条。
绘制效果如图所示:

3. 控制colorbar的长度实例
通过调整shrink参数,控制了colorbar的长度为ax2的1/5。示例代码如下:
import numpy as np
import matplotlib.pyplot as plt
from matplotlib.cm import ScalarMappable
import matplotlib as mpl


USER_FONT_SZ=22
COORD_MIN=0
COORD_MAX=50

if __name__ == '__main__':
    # subplot SETUP
    gs_kw = dict(width_ratios=[1,1], height_ratios=[17, 1])
    fig, axd = plt.subplot_mosaic([['left image','right image'],
                               ['colorbar','colorbar']],
                               gridspec_kw=gs_kw,
                              figsize=(16, 9),layout='constrained')
    axes=[None, None, None]
    for k, ax in axd.items():
        if ax.get_label()=='left image':
            axes[0]=ax
        elif ax.get_label()=='right image':
            axes[1]=ax
        elif ax.get_label()=='colorbar':
            axes[2]=ax
    ax1, ax2, ax3 = axes
    # 设置三个坐标轴的尺寸
    ax1.set_position([0.01,0.15,0.48,0.8])
    ax2.set_position([0.51,0.15,0.48,0.8])
    ax3.set_position([0.01,0.00,0.98,0.1])
    #准备绘制颜色条的axes不显示轴、标签
    ax3.xaxis.set_visible(False)#不显示标签
    ax3.yaxis.set_visible(False)#不显示标签
    ax3.set_axis_off()#不显示轴

    ax1.set_xlim(COORD_MIN, COORD_MAX)
    ax1.set_ylim(COORD_MIN, COORD_MAX)
    ax1.set_aspect(1)
    ax2.set_xlim(COORD_MIN, COORD_MAX)
    ax2.set_ylim(COORD_MIN, COORD_MAX)
    ax2.set_aspect(1)
    ax1.set_title('left plot', fontsize=USER_FONT_SZ)
    ax2.set_title('right plot', fontsize=USER_FONT_SZ)

    jet_cm = mpl.colormaps['hot']
    # 随机生成50*50数据
    u1 = np.random.randn(50,50)
    v1 = np.random.randn(50,50)
    u2 = np.random.randn(50,50)
    v2 = np.random.randn(50,50)
    x,y=np.meshgrid(np.arange(50), np.arange(50))
    # plot in each axes
    ax1.quiver(x,y,u1,v1,np.sqrt(u1**2+v1**2),cmap = jet_cm, scale=20)
    ax2.quiver(x,y,u2,v2,np.sqrt(u2**2+v2**2),cmap = jet_cm, scale=20)

    # 设置colorbar的长度等同于1/5的ax2宽度
    # ax2.get_position().width获取ax2的宽度(宽度单位是fig宽度的比例,例如0.1表示fig宽度的0.1)
    len_in_fig = ax2.get_position().width/5
    # 宽度转换为缩放比例,传给shrink参数
    user_shrink=len_in_fig/ax3.get_position().width
    print(len_in_fig)
    print(user_shrink)
    cbar = plt.colorbar(ScalarMappable(norm=None, cmap=jet_cm), ax=ax3,#[ax1,ax2],#
                        orientation='horizontal', location='bottom',
                        fraction=1.0, shrink=user_shrink)
    cbar.set_ticks(ticks=[0,1],labels=['short','long'], fontsize=USER_FONT_SZ-6)
    cbar.ticklocation='top'
    plt.show()
绘制结果:

4.参考
一个使用cax参数的官方示例
控制颜色条位置和尺寸的官方示例