有很多小伙伴经常私信给小编,问自己绘制的图表为啥没小编绘制的精美? 听到这句话,小编老脸一红,还是比较惭愧的,因为并不是像小伙伴说的那样对每一个图表元素都进行定制化涉及操作,是借助优秀的“第三方工具”的。而这第三方工具就是本篇推文的重点-*绘图主题(Themes)*。今天小编就介绍一下自己在绘图过程中经常使用的优秀图表主题包-hrbrthemes。主要的内容如下:
-
ggplot2 主要绘图主题包简单汇总
-
R-hrbrthemes包介绍
-
更多详细的数据可视化教程,可订阅我们的店铺课程:
-

ggplot2 主要绘图主题包简单汇总
作为绘图功能强大的ggplot2,其优秀的第三方包可谓是覆盖很多领域,当然,我们不能一一进行介绍(太繁琐且专业不同),但其最终结果都是进行可视化绘制,基于此,我们就对其绘图主题包进行简单汇总。
-
ggplot2 本身主题
查阅ggplot2官网主题介绍(https://ggplot2.tidyverse.org/reference/ggtheme.html),其本身就有众多优秀的绘图主题如下:
theme_gray()
theme_bw()
theme_linedraw()
theme_light()
theme_dark()
theme_minimal()
theme_classic()
theme_void()
theme_test()
各自的绘图样式,大家也可自行访问上述网站进行查看。但是,gggplot2自带的主题在颜色配置和字体设置等方面难免会有点“差强人意”的感觉,对可视化定制需求较高的小伙伴来说,想要绘制出理想的可视化作品,则还需要结合theme() 函数对图例(legend)、刻度(ticks)、字体(fonts)等图表颜色进行设置。
-
ggthemr包 网址:https://github.com/Mikata-Project/ggthemr
ggthemr包可以让你对图表的颜色、背景、字体等绘图元素实现自动化设置,绘制出精美的可视化作品(颜色系也是符合大部分人审美需求的),这里给出部分样例:
flat:
flat
flat dark:

flat dark
solarized:
solarized
-
ggthemes 包
网址:https://jrnold.github.io/ggthemes/
这个ggplot2 绘图主题包功能十分强大,其提供的主题函数也比较丰富,列举如下:
*theme_wsj()*:
theme_wsj()
*theme_fivethirtyeight()*:

theme_fivethirtyeight()
*theme_map()*:
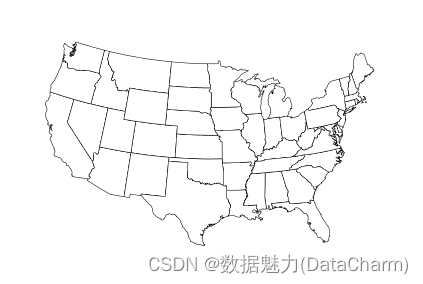
theme_map
除此之外,ggthemes还提供大量的颜色系供大家使用,列举如下:
tableau_color_pal('tableau20')(20):

tableau_color_pal('tableau20')(20)
stata_pal("s2color")(15):

stata_pal("s2color")(15)
gdocs_pal()(20):
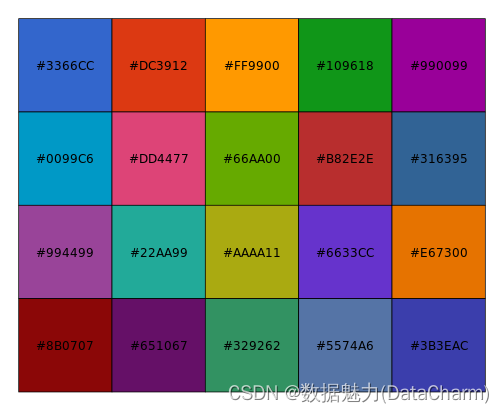
gdocs_pal()(20)
-
ggtech包
网址:https://github.com/ricardo-bion/ggtech
样例列举如下: theme_tech(theme="airbnb")

theme_tech(theme="airbnb")
*theme_tech(theme="google")*:
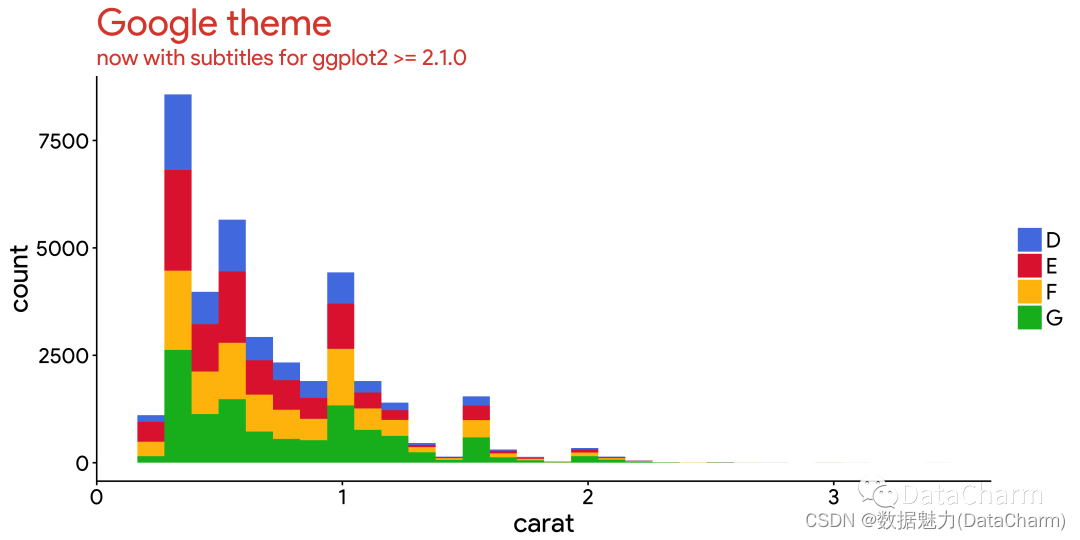
theme_tech(theme="google")
以上就大致列举出几个常用的ggplot2 绘图主题包,还有其他优秀的第三方包我没有列出,感兴趣的小伙伴可自行探索哈。
R-hrbrthemes包介绍
为什么将这个包进行单独的介绍了,因为小编的大部分可视化做作品大部分都是基于该主题包进行绘制的,该包无论从字体(当然,前提得安装)还是刻度、颜色配置,小编个人认为都是十分优秀和符合可视化审美的,接下来,我们简单进行介绍:
Themes(主题)
-
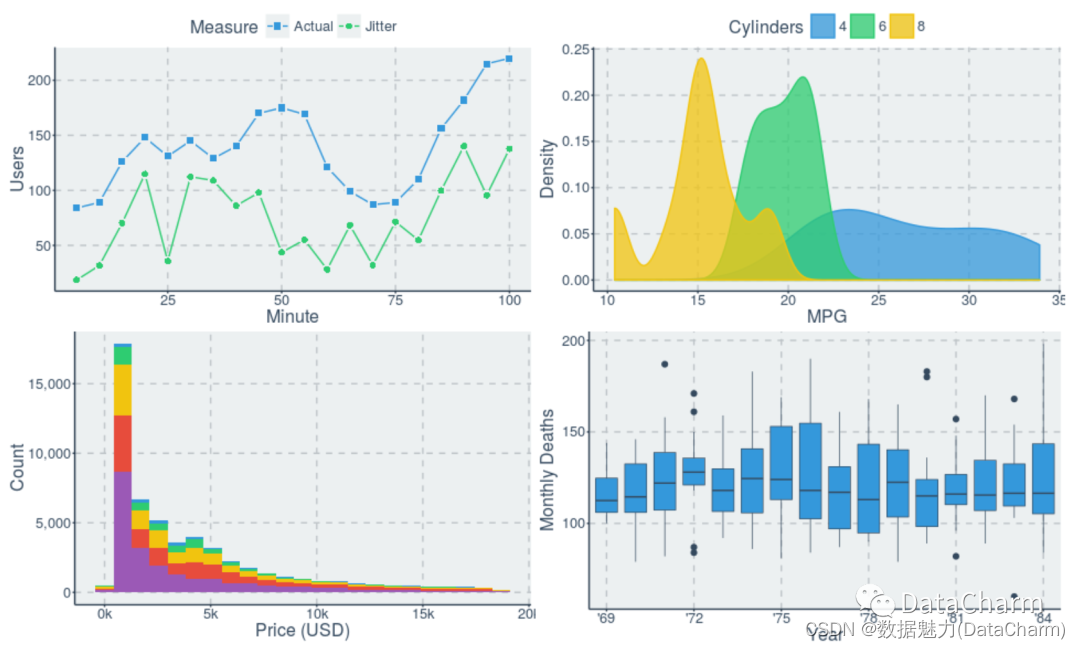
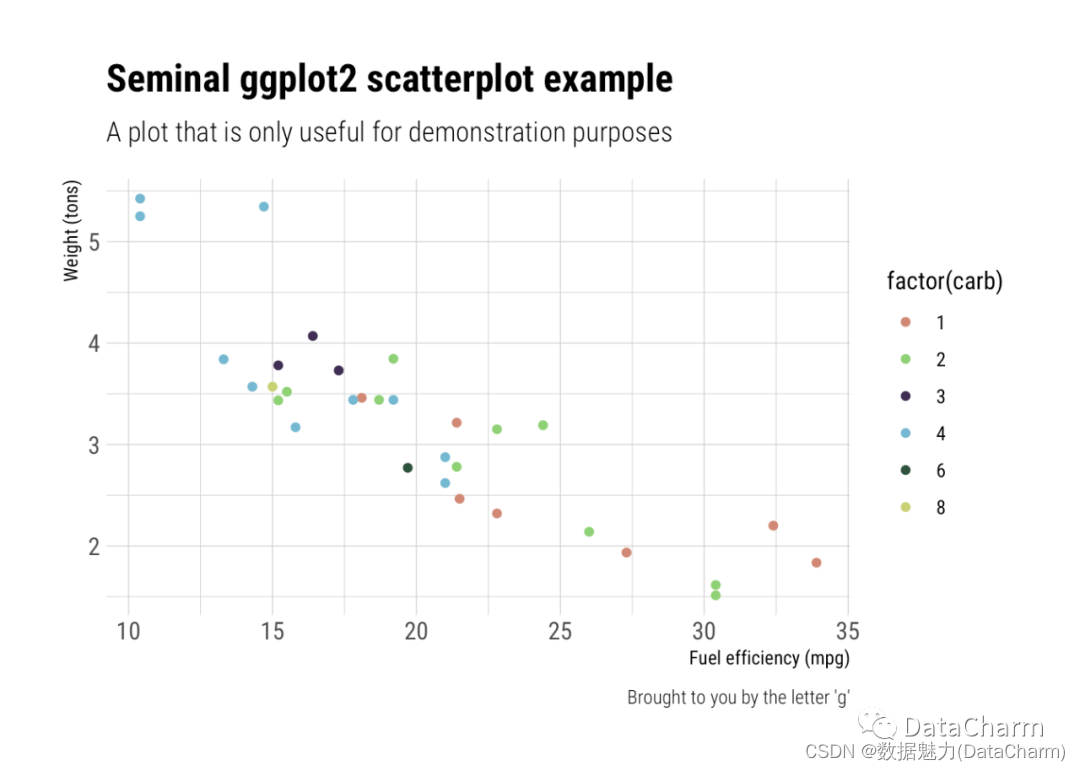
Base theme (Arial Narrow)
ggplot(mtcars, aes(mpg, wt)) +
  geom_point() +
  labs(x="Fuel efficiency (mpg)", y="Weight (tons)",
       title="Seminal ggplot2 scatterplot example",
       subtitle="A plot that is only useful for demonstration purposes",
       caption="Brought to you by the letter 'g'") +
  theme_ipsum()

Base theme (Arial Narrow)
-
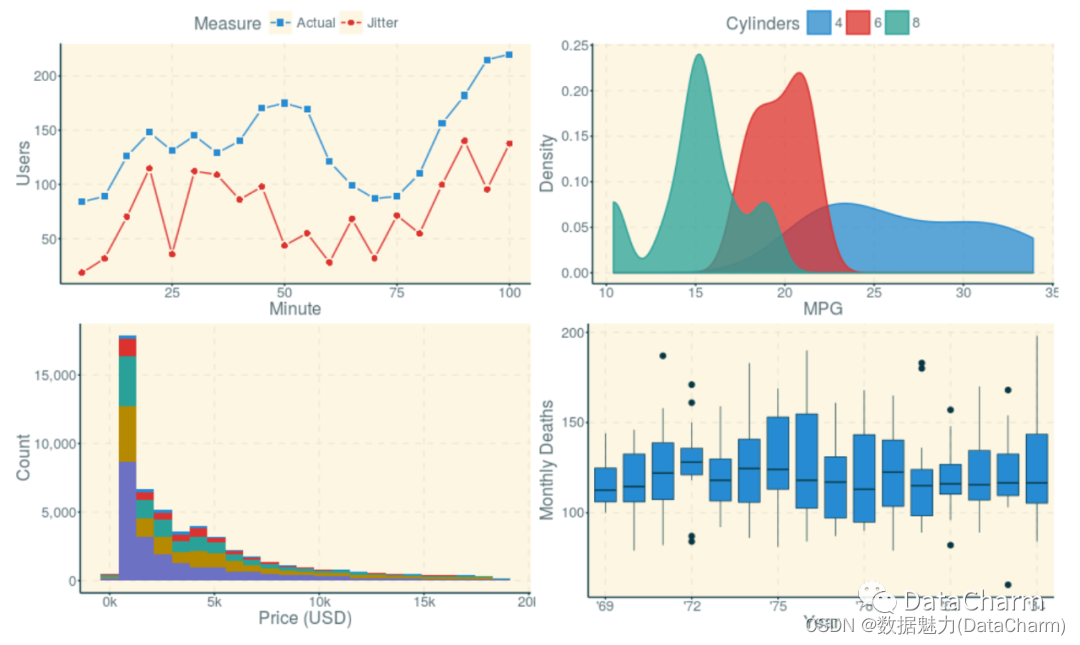
New FT Theme
ggplot(mtcars, aes(mpg, wt)) +
  geom_point(color = ft_cols$yellow) +
  labs(x="Fuel efficiency (mpg)", y="Weight (tons)",
       title="Seminal ggplot2 scatterplot example",
       subtitle="A plot that is only useful for demonstration purposes",
       caption="Brought to you by the letter 'g'") +
  theme_ft_rc()

New FT Theme
-
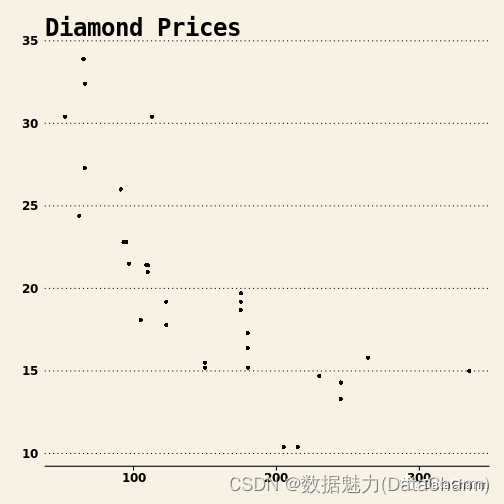
IBM Plex Sans
ggplot(mpg, aes(displ, hwy)) +
  geom_jitter(aes(color=class, fill=class), size=3, shape=21, alpha=1/2) +
  scale_x_continuous(expand=c(0,0), limits=c(1, 8), breaks=1:8) +
  scale_y_continuous(expand=c(0,0), limits=c(10, 50)) +
  scale_color_ipsum() +
  scale_fill_ipsum() +
  facet_wrap(~class, scales="free") +
  labs(
    title="IBM Plex Sans Test",
    subtitle="This is a subtitle to see the how it looks in IBM Plex Sans",
    caption="Source: hrbrthemes & IBM"
  ) +
  theme_ipsum_ps(grid="XY", axis="xy") +
  theme(legend.position="none") -> gg

flush_ticks(gg)
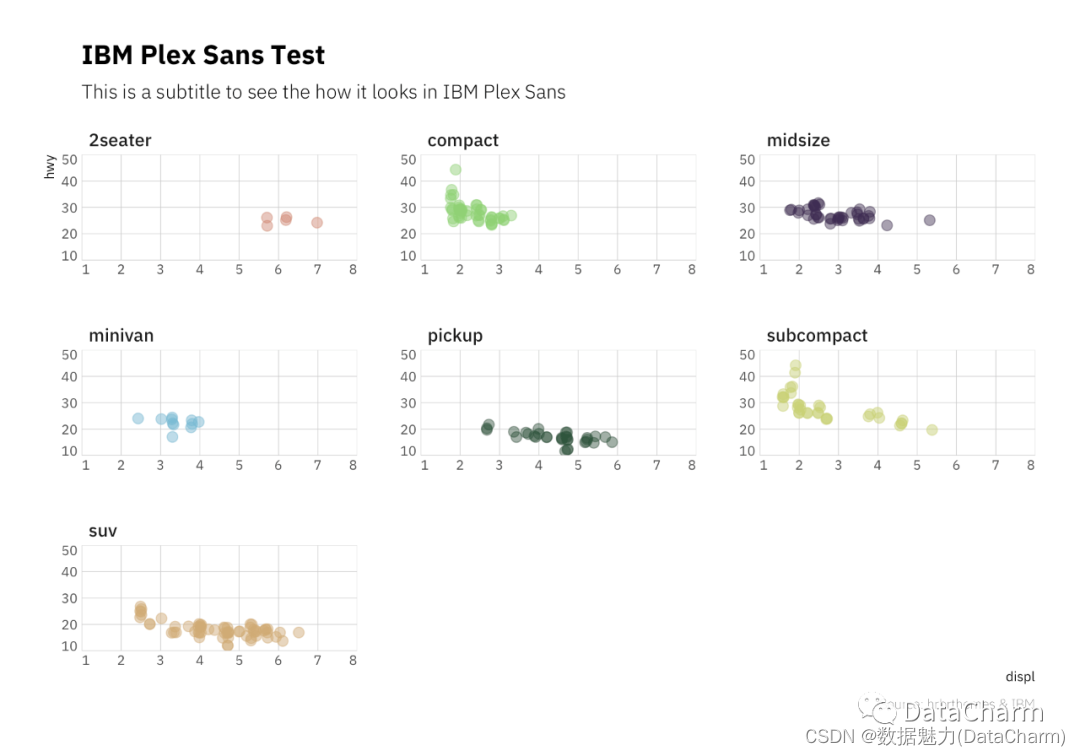
IBM Plex Sans
Scales
-
Scales (Color/Fill)
ggplot(mtcars, aes(mpg, wt)) +
  geom_point(aes(color=factor(carb))) +
  labs(x="Fuel efficiency (mpg)", y="Weight (tons)",
       title="Seminal ggplot2 scatterplot example",
       subtitle="A plot that is only useful for demonstration purposes",
       caption="Brought to you by the letter 'g'") +
  scale_color_ipsum() +
  theme_ipsum_rc()
Scales (Color/Fill)
-
Scales (Axis)
count(mpg, class) %>%
  mutate(pct=n/sum(n)) %>%
  ggplot(aes(class, pct)) +
  geom_col() +
  scale_y_percent() +
  labs(x="Fuel efficiency (mpg)", y="Weight (tons)",
       title="Seminal ggplot2 column chart example with percents",
       subtitle="A plot that is only useful for demonstration purposes",
       caption="Brought to you by the letter 'g'") +
  theme_ipsum(grid="Y")
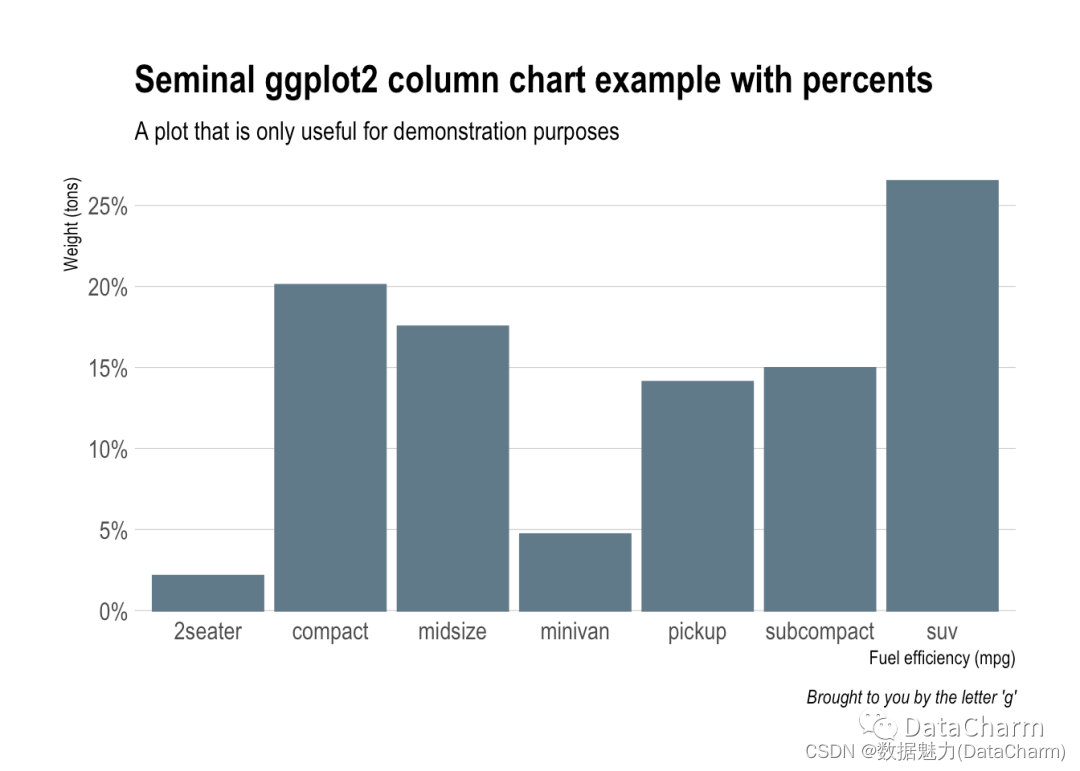
Scales (Axis)
注意事项
很多小伙伴在第一次使用该包进行绘制时,都会出现“没相关字体的”的警告提示,这里给大家介绍下我解决的方法:
-
导入字体
R导入字体,我使用的代码如下:
#添加字体
windowsFonts(
   kaiti = windowsFont("STKAITI"),
   Cinzel = windowsFont("Cinzel"),#这里使用的是字体的主题名称
   Poppins = windowsFont("Poppins"),
   IBMPSBold = windowsFont("IBMPlexSans-Bold"),
   Roboto_Mono = windowsFont("Roboto Mono"),
   Open_Sans = windowsFont("Open Sans"),
   Roboto_Condensed = windowsFont("Roboto Condensed"),
   Open_Sans_ExtraBold = windowsFont("Open Sans ExtraBold"),
   Times_New_Roman = windowsFont("Times New Roman")
  )
-
hrbrthemes包主题设置时引用
theme_ipsum(base_family = "Roboto_Condensed")
这里注意下,在theme_ipsum()中的base_family属性替换成第一步中的导入字体即可。当然,前提是安装了相关字体(中文字体也是可以的)
总结
本篇推文小编大致列举了ggplot2绘图主题,着重介绍了hrbrthemes的主题类型,希望大家可以多使用该包进行自己的可视化作品设计,当然了,主题函数还是和*themes()*函数结合使用,绘制出更加优秀的作品。灵活的使用绘图主题和颜色主题,可以帮助你省去大量定制化绘制的时间,提高绘图效率哦。


![[已解决]问题:root.users.hdfs is not a leaf queue](https://img-blog.csdnimg.cn/img_convert/55eeeb99a2641ae5fdd538ffc37ee1a2.png)