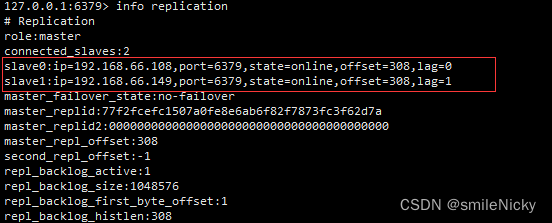
通过awr报告看:

分析:
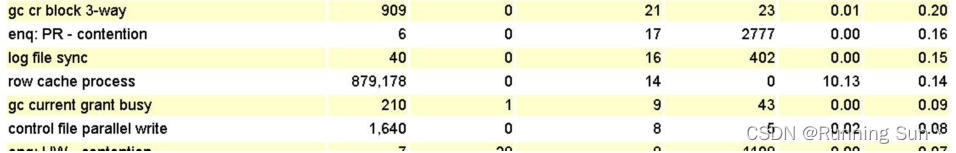
log file parallel write平均等待8毫秒
log file sync平均等待402毫秒
排查:
log file sync = parallel write + lgwr cpu
log file parallel write等待少说明存储不慢。
所以:log file sync等待长是因为cpu高。
扩展:
>>>>>等待事件各种类型和说明及相关查询:<<<<<
--1.重要的等待事件
1.1 db file scattered read (数据文件离散读取)
与全表扫描或快速全索引扫描有关
一般是没有创建索引或没有合适的索引
归类于 UserI/O 等待
1.2 db file sequential read (数据文件顺序读取)
与读取索引块或通过索引读取数据块有关
归类于 UserI/O 等待
1.3 direct path read/write (直接路径读写), direct path read/write temp (直接路径读写临时数据文件)
直接路径读,直接读数据到 PGA ,不经过 SGA
与磁盘排序 IO,并行查询从属进程,预读处理有关
与直接路径加载,并行 DML,未缓存 LOB 段写入有关
1.4 log file switch (archiving needed) (日志切换需要归档)
日志组循环写满以后,在需要覆盖先前日志时发现归档尚未完成
有可能因为 IO 问题,归档进程写出缓慢,也有可能是日志组设置不合理
可以增大日志文件,增加日志组,移动归档文件到快速磁盘,调整 log_archive_max_processes 参数
1.5 log file switch (checkpoint incomplete) (日志切换检查点未完成)
日志组循环写满以后,在需要覆盖先前日志时发现数据库没完成写出此日志所保护的脏数据
dbwr 写出缓慢或 IO 问题
增加额外的dbwr,增加日志文件组或日志文件大小
1.6 log file syns (日志文件同步)
lgwr 进程写出效率低下或提交回滚过于频繁
提高 lgwr 性能,使用快速磁盘,使用批量提交,使用 nologging 和 unrecoverable 等选项
1.7.log file single write
与写日志文件头块有关,很少出现
1.8 log file parallel write
lgwr 将日志从 log buffer 写出到日志文件时写出是并行的 (多个日志成员),全部完成后此操作才会完成
1.9 log buffer space
日志产生速度快于 lgwr 写出速度,或日志切换太慢,或 IO 瓶颈
增加日志文件大小或缓冲区大小,更换高速磁盘(裸设备)
不要将日志文件于数据文件方在一起,尽量用 raid10 而不是 raid5 来存储日志文件
1.10 enqueque (队列等待)
1.11 latch free (latch 释放)
--2.相关视图
2.1 v$session
数据库当前连接的会话信息,随会话消失而消失
2.2 v$session_wait
数据库当前连接的会话正在等待的资源或事件信息,随会话消失而消失
2.3 v$session_wait_history
记录数据库活动会话近 10 次的等待的资源或事件信息
2.4 v$system_event
数据库启动以来所以等待事件的汇总信息
2.5 v$session_longops
长时间运行 (超过 6 秒) 的事务
2.6 v$segstat_name
段级统计信息收集信息
--3.相关查询脚本
3.1 --事件主要分类和个数
column wait_class format a20
select wait_class#,wait_class_id, wait_class,count(*)
from v$event_name
group by wait_class#,wait_class_id, wait_class
order by wait_class#;
WAIT_CLASS# WAIT_CLASS_ID WAIT_CLASS COUNT(*)
----------- ------------- -------------------- ----------
0 1893977003 Other 1394
1 4217450380 Application 17
2 3290255840 Configuration 28
3 4166625743 Administrative 59
4 3875070507 Concurrency 56
5 3386400367 Commit 5
6 2723168908 Idle 140
7 2000153315 Network 30
8 1740759767 User I/O 59
9 4108307767 System I/O 40
10 2396326234 Scheduler 10
11 3871361733 Cluster 73
12 644977587 Queueing 9
13 rows selected.
SQL>
3.2 --等待事件的参数意义描述
//不同事件的参数意义不同
SQL> column parameter1 format a20
SQL> column parameter2 format a20
SQL> column parameter3 format a20
SQL> select
name,
parameter1,
parameter2,
parameter3
from v$event_name
where name = 'db file scattered read';
NAME PARAMETER1 PARAMETER2 PARAMETER3
-------------------------- -------------------- -------------------- --------------------
db file scattered read file# block# blocks
SQL>
3.3 --各类等待事件的等待时间和等待次数统计
select * from v$system_wait_class order by time_waited;
WAIT_CLASS_ID WAIT_CLASS# WAIT_CLASS TOTAL_WAITS TIME_WAITED TOTAL_WAITS_FG TIME_WAITED_FG CON_ID
------------- ----------- ---------------- ----------- ----------- -------------- -------------- ------
4166625743 3 Administrative 307 0 307 0 0
3386400367 5 Commit 48 5 6 1 0
3290255840 2 Configuration 23 156 3 143 0
4217450380 1 Application 8052 799 8017 786 0
3875070507 4 Concurrency 47407 1804 641 1262 0
2000153315 7 Network 996747 5148 967099 4676 0
4108307767 9 System I/O 271141 9865 736 333 0
1740759767 8 User I/O 107989 14886 26581 5345 0
2396326234 10 Scheduler 3169 84058 1700 49447 0
1893977003 0 Other 1217528 91865 59734 16197 0
2723168908 6 Idle 6578660 308797577 59870 20453518 0
11 rows selected.
SQL>
3.4 --TOP 10等待事件
select *
from (select event, total_waits, time_waited
from v$session_event
order by time_waited desc)
where rownum < 10;
EVENT TOTAL_WAITS TIME_WAITED
-------------------- ----------- -----------
pmon timer 13443 4022721
rdbms ipc message 13455 4022135
watchdog main loop 13407 4022121
rdbms ipc message 16595 4022081
pmon timer 13414 4021906
watchdog main loop 13403 4020953
OFS idle 13399 4020882
rdbms ipc message 13449 4020824
watchdog main loop 13403 4020790
9 rows selected.
SQL>
3.5 --查看当前发生等待的会话信息
set linesize 200
set pagesize 1000
column username format a10
column event format a20
column wait_class format a15
select nvl(s.username, '(oracle)') as username,
s.sid,
s.serial#,
sw.event,
sw.wait_class,
sw.wait_time,
sw.seconds_in_wait,
sw.state
from v$session_wait sw,
v$session s
where s.sid = sw.sid
order by sw.seconds_in_wait desc;
3.6 --根据SID查找造成等待的SQL
select a.sql_id,
a.sql_text
from v$sqltext a,v$session b
where a.hash_value = b.sql_hash_value
and b.sid = '&sid'
order by a.piece;
3.7 --活动session的近10次的等待信息
column event format a30
column p1text format a15
column p2text format a15
column p3text format a15
select event,
p1text,
p1,
p2text,
p2,
p3text,
p3,
wait_time,
wait_count --19C中没此列,有WAIT_TIME_MICRO
from v$session_wait_history
where sid = &sid;
3.8 --根据等待事件获得执行计划
set linesize 120
col operation format a55
col cost format 99999
col kbytes format 999999
col object format a25
select hash_value,
child_number,
lpad(' ', 2 * depth) || operation || ' ' || options ||
decode(id, 0, substr(optimizer, 1, 6) || ' cost=' || to_char(cost)) operation,
object_name object,
cost,
round(bytes / 1024) kbytes
from v$sql_plan
where hash_value in (select a.sql_hash_value
from v$session a, v$session_wait b
where a.sid = b.sid
and b.event = '&waitevent')
order by hash_value, child_number, id;
3.9 --获取全描扫描的对象
select distinct object_name, object_owner
from v$sql_plan
where operation = 'TABLE ACCESS'
and options = 'FULL'
and object_owner = 'SYS';
3.10 --查找全表扫描的SQL
select t.sql_id, t.sql_text
from v$sqltext t, v$sql_plan p
where t.hash_value = p.hash_value
and p.operation = 'TABLE ACCESS'
and p.options = 'FULL'
and p.object_owner = 'SYS'
order by p.hash_value, t.piece;
3.11 --获得全索引扫描的对象
select distinct
object_name,
object_owner
from v$sql_plan
where operation='INDEX'
and options='FULL SCAN';
3.12 --查找全索引扫描的 SQL
SELECT t.sql_id, t.sql_text
FROM v$sqltext t, v$sql_plan p
WHERE t.hash_value = p.hash_value
AND p.operation = 'INDEX'
AND p.options = 'FULL SCAN'
ORDER BY p.hash_value, t.piece;
3.13 --全表扫描的统计信息
column name format a30
column value format 999,999,999
select name, value
from v$sysstat
where name in ('table scans (short tables)', 'table scans (long tables)');
3.14 --查看高负载SQL
SELECT address,
substr(sql_text, 1, 20) text,
buffer_gets,
executions,
buffer_gets / executions avg
from v$sqlarea
where executions > 0
and buffer_gets > 100000
order by 5;