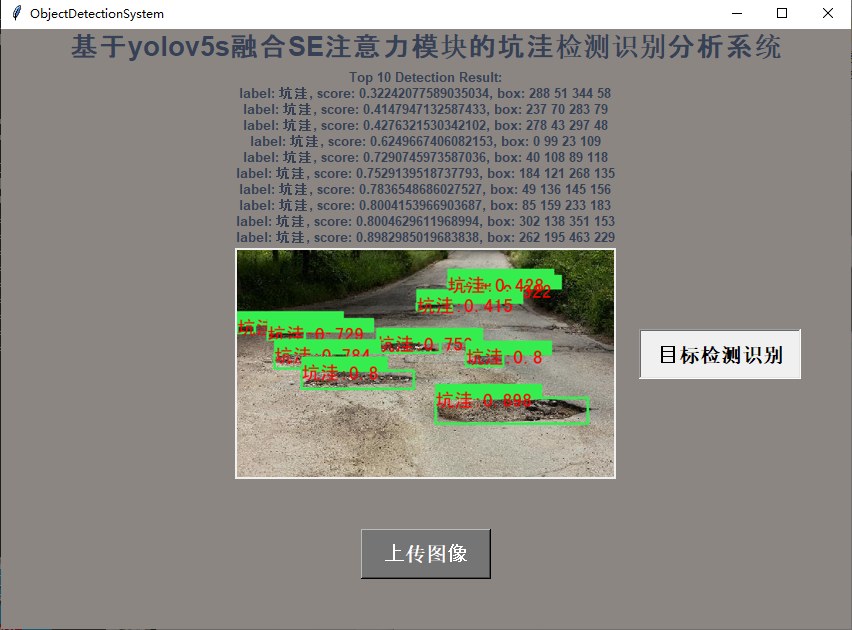
在很多的项目实战中验证分析注意力机制的加入对于模型最终性能的提升发挥着积极正向的作用,在我之前的一些文章里面也做过了一些尝试,这里主要是想基于轻量级的s系列模型来开发构建路面坑洼检测系统,在模型中加入SE注意力模块,以期在轻量化的基础上进一步提升模型的检测性能。首先来看下效果图:
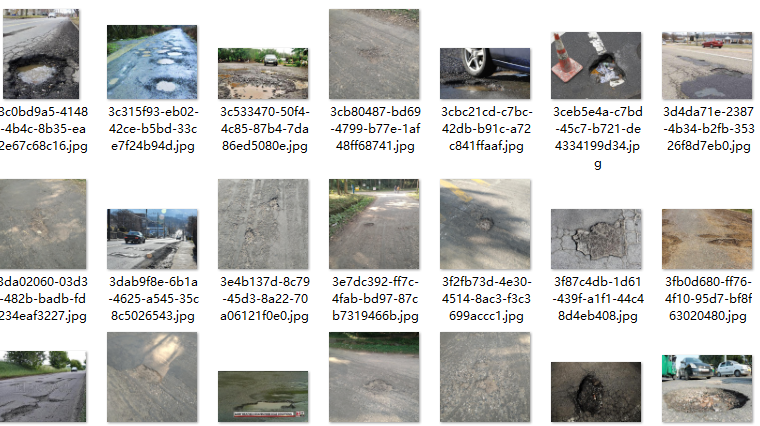
这里数据集的目标对象只有一个就是:pothole(路面坑洼)
使用的模型yaml文件如下:
#Parameters
nc: 1  # number of classes
depth_multiple: 0.33  # model depth multiple
width_multiple: 0.50  # layer channel multiple
anchors:
  - [10,13, 16,30, 33,23]  # P3/8
  - [30,61, 62,45, 59,119]  # P4/16
  - [116,90, 156,198, 373,326]  # P5/32


#Backbone
backbone:
  # [from, number, module, args]
  [[-1, 1, Conv, [64, 6, 2, 2]],  # 0-P1/2
   [-1, 1, Conv, [128, 3, 2]],  # 1-P2/4
   [-1, 3, C3, [128]],
   [-1, 1, Conv, [256, 3, 2]],  # 3-P3/8
   [-1, 6, C3, [256]],
   [-1, 1, Conv, [512, 3, 2]],  # 5-P4/16
   [-1, 9, C3, [512]],
   [-1, 1, Conv, [1024, 3, 2]],  # 7-P5/32
   [-1, 3, C3, [1024]],
   [-1, 1, SPPF, [1024, 5]],  # 9
  ]


#Head
head:
  [[-1, 1, Conv, [512, 1, 1]],
   [-1, 1, nn.Upsample, [None, 2, 'nearest']],
   [[-1, 6], 1, Concat, [1]],  # cat backbone P4
   [-1, 3, C3, [512, False]],  # 13

   [-1, 1, Conv, [256, 1, 1]],
   [-1, 1, nn.Upsample, [None, 2, 'nearest']],
   [[-1, 4], 1, Concat, [1]],  # cat backbone P3
   [-1, 3, C3, [256, False]],  # 17 (P3/8-small)

   [-1, 1, Conv, [256, 3, 2]],
   [[-1, 14], 1, Concat, [1]],  # cat head P4
   [-1, 3, C3, [512, False]],  # 20 (P4/16-medium)

   [-1, 1, Conv, [512, 3, 2]],
   [[-1, 10], 1, Concat, [1]],  # cat head P5
   [-1, 3, C3, [1024, False]],  # 23 (P5/32-large)
   [-1, 1, SE, [1024]],

   [[17, 20, 24], 1, Detect, [nc, anchors]],  # Detect(P3, P4, P5)
  ]
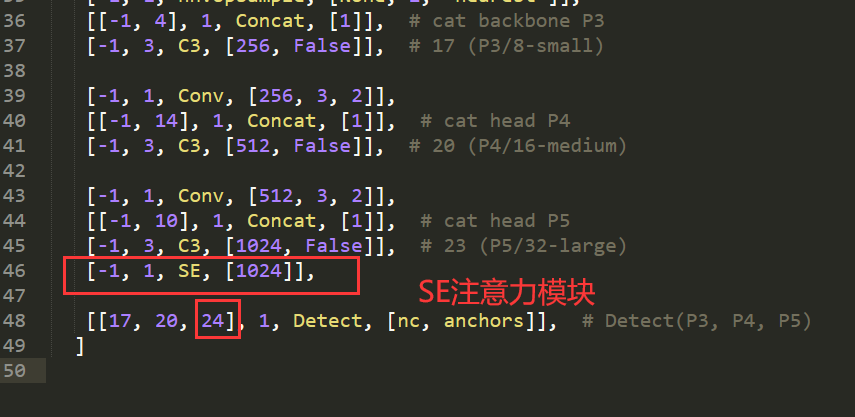
在最终的Detect层前面加入了SE模块,所以最终的索引号也要加1,23+1=24。
接下来看下数据情况:
VOC格式标注数据如下:
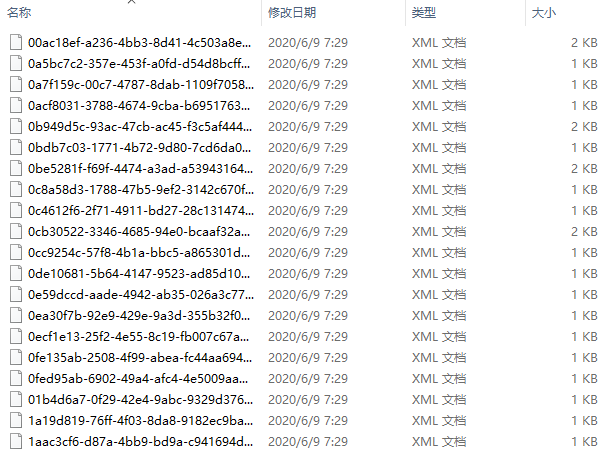
实例数据如下:
<annotation>
    <folder>images</folder>
    <filename>1b404500-c1a3-4454-ae9d-4ae6f93239b4.png</filename>
    <size>
        <width>450</width>
        <height>300</height>
        <depth>3</depth>
    </size>
    <segmented>0</segmented>
    <object>
        <name>pothole</name>
        <pose>Unspecified</pose>
        <truncated>0</truncated>
        <occluded>0</occluded>
        <difficult>0</difficult>
        <bndbox>
            <xmin>1</xmin>
            <ymin>57</ymin>
            <xmax>87</xmax>
            <ymax>126</ymax>
        </bndbox>
    </object>
    <object>
        <name>pothole</name>
        <pose>Unspecified</pose>
        <truncated>0</truncated>
        <occluded>0</occluded>
        <difficult>0</difficult>
        <bndbox>
            <xmin>60</xmin>
            <ymin>1</ymin>
            <xmax>124</xmax>
            <ymax>14</ymax>
        </bndbox>
    </object>
    <object>
        <name>pothole</name>
        <pose>Unspecified</pose>
        <truncated>0</truncated>
        <occluded>0</occluded>
        <difficult>0</difficult>
        <bndbox>
            <xmin>52</xmin>
            <ymin>80</ymin>
            <xmax>379</xmax>
            <ymax>259</ymax>
        </bndbox>
    </object>
</annotation>
YOLO格式标注数据如下:
实例标注数据如下所示:
0 0.5075 0.4625 0.335 0.375
0 0.6375 0.36 0.125 0.13
0 0.5625 0.06625 0.085 0.0525
0 0.12625 0.0575 0.0875 0.03
0 0.24 0.1175 0.095 0.1
0 0.4225 0.24 0.045 0.035
默认执行100次epoch迭代计算,在GPU模式下完成训练,日志输出如下所示:
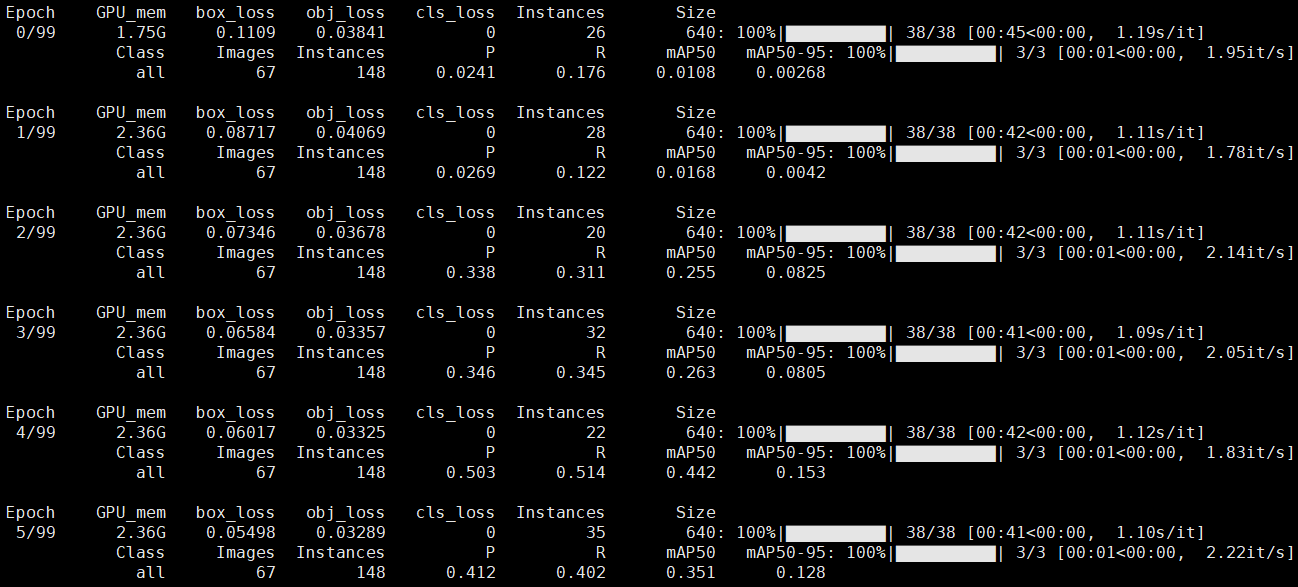
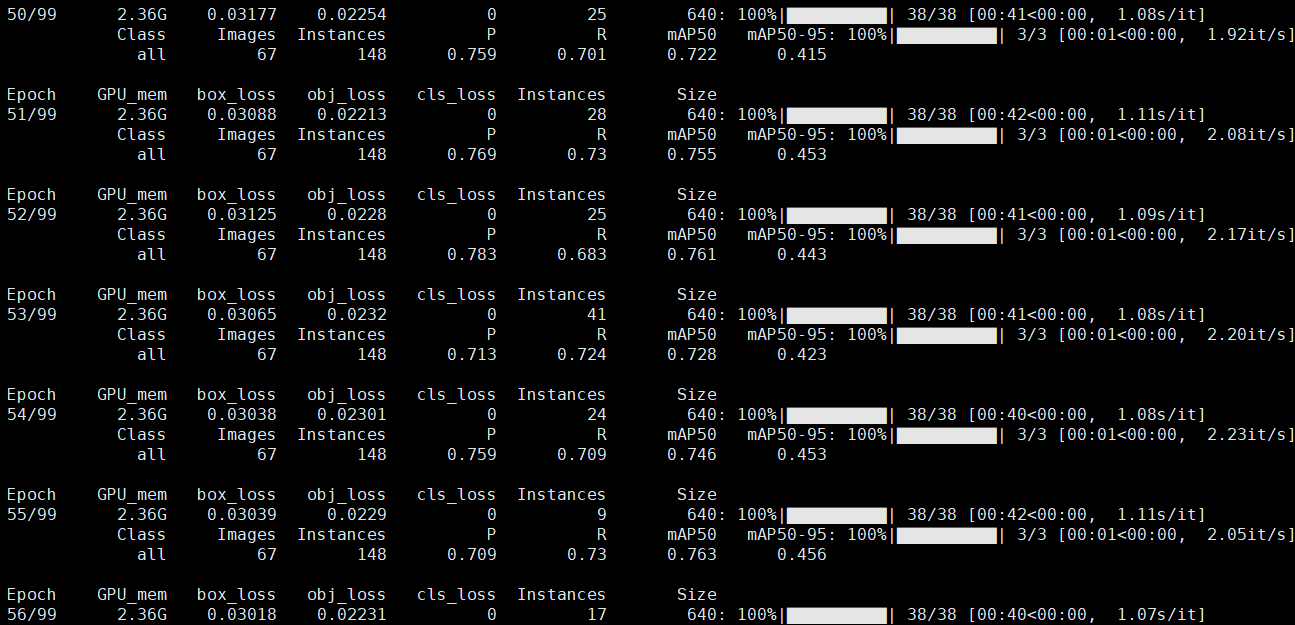
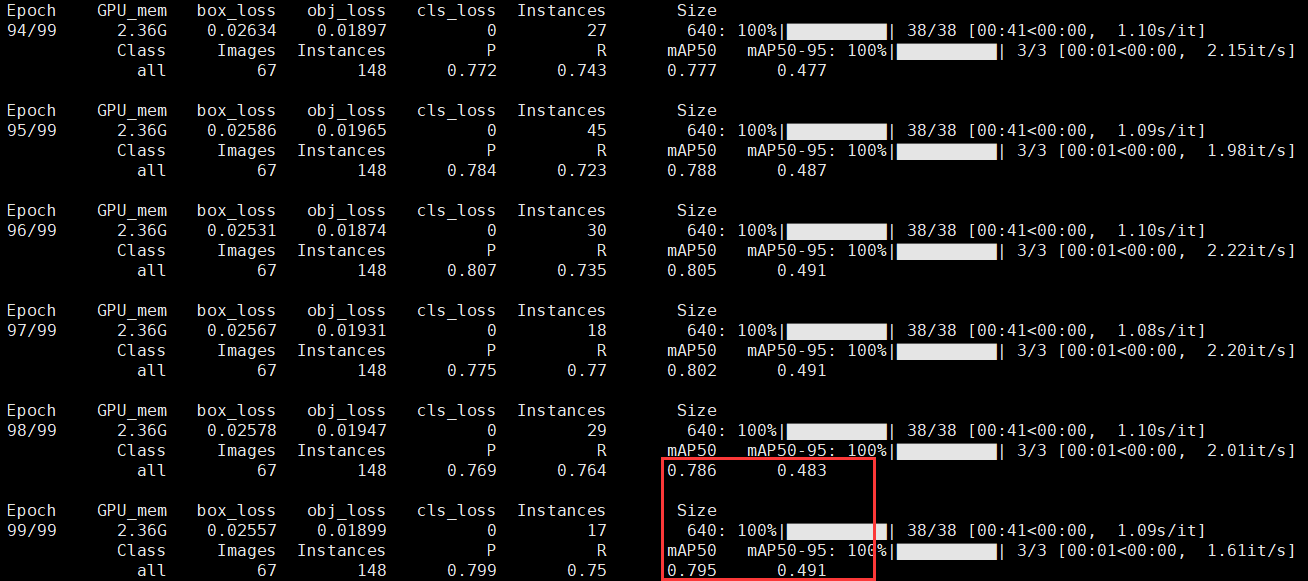
可以看到最终效果还是不错的。
结果数据目录如下所示:

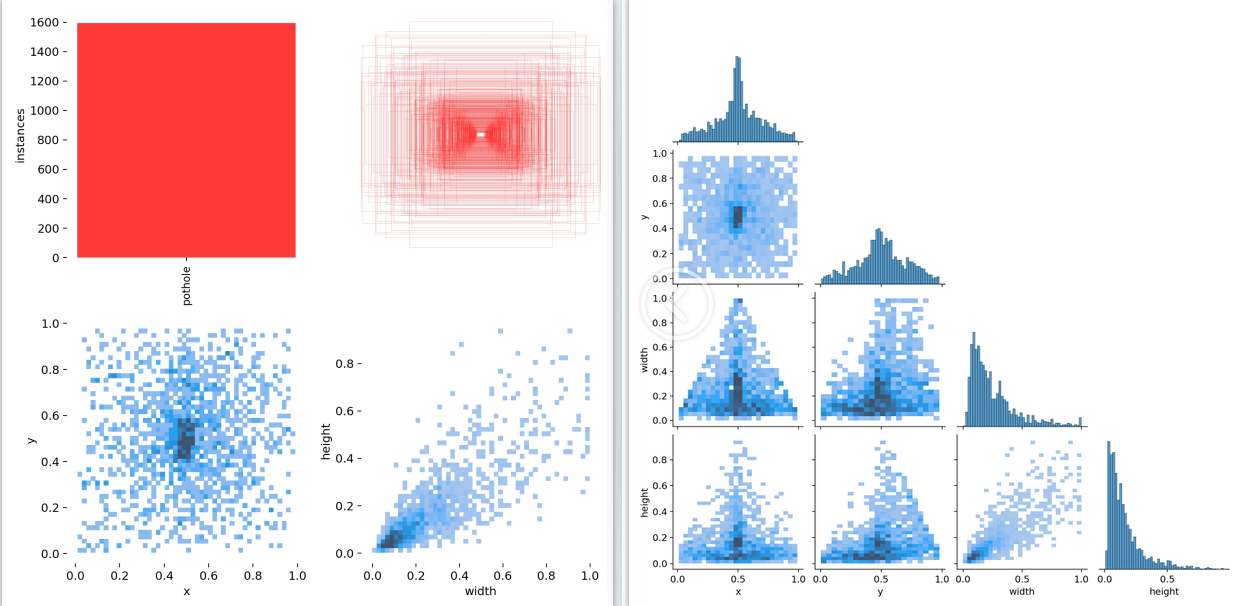
标签数据可视化如下:
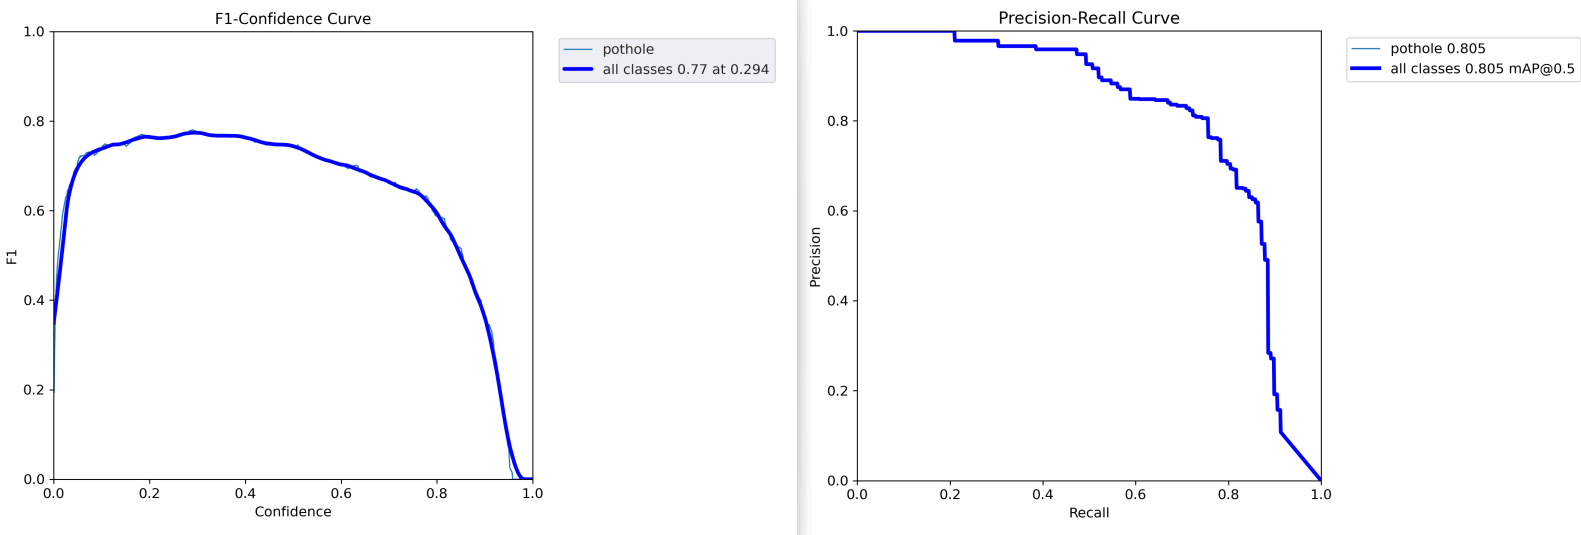
F1值曲线和PR曲线如下所示:
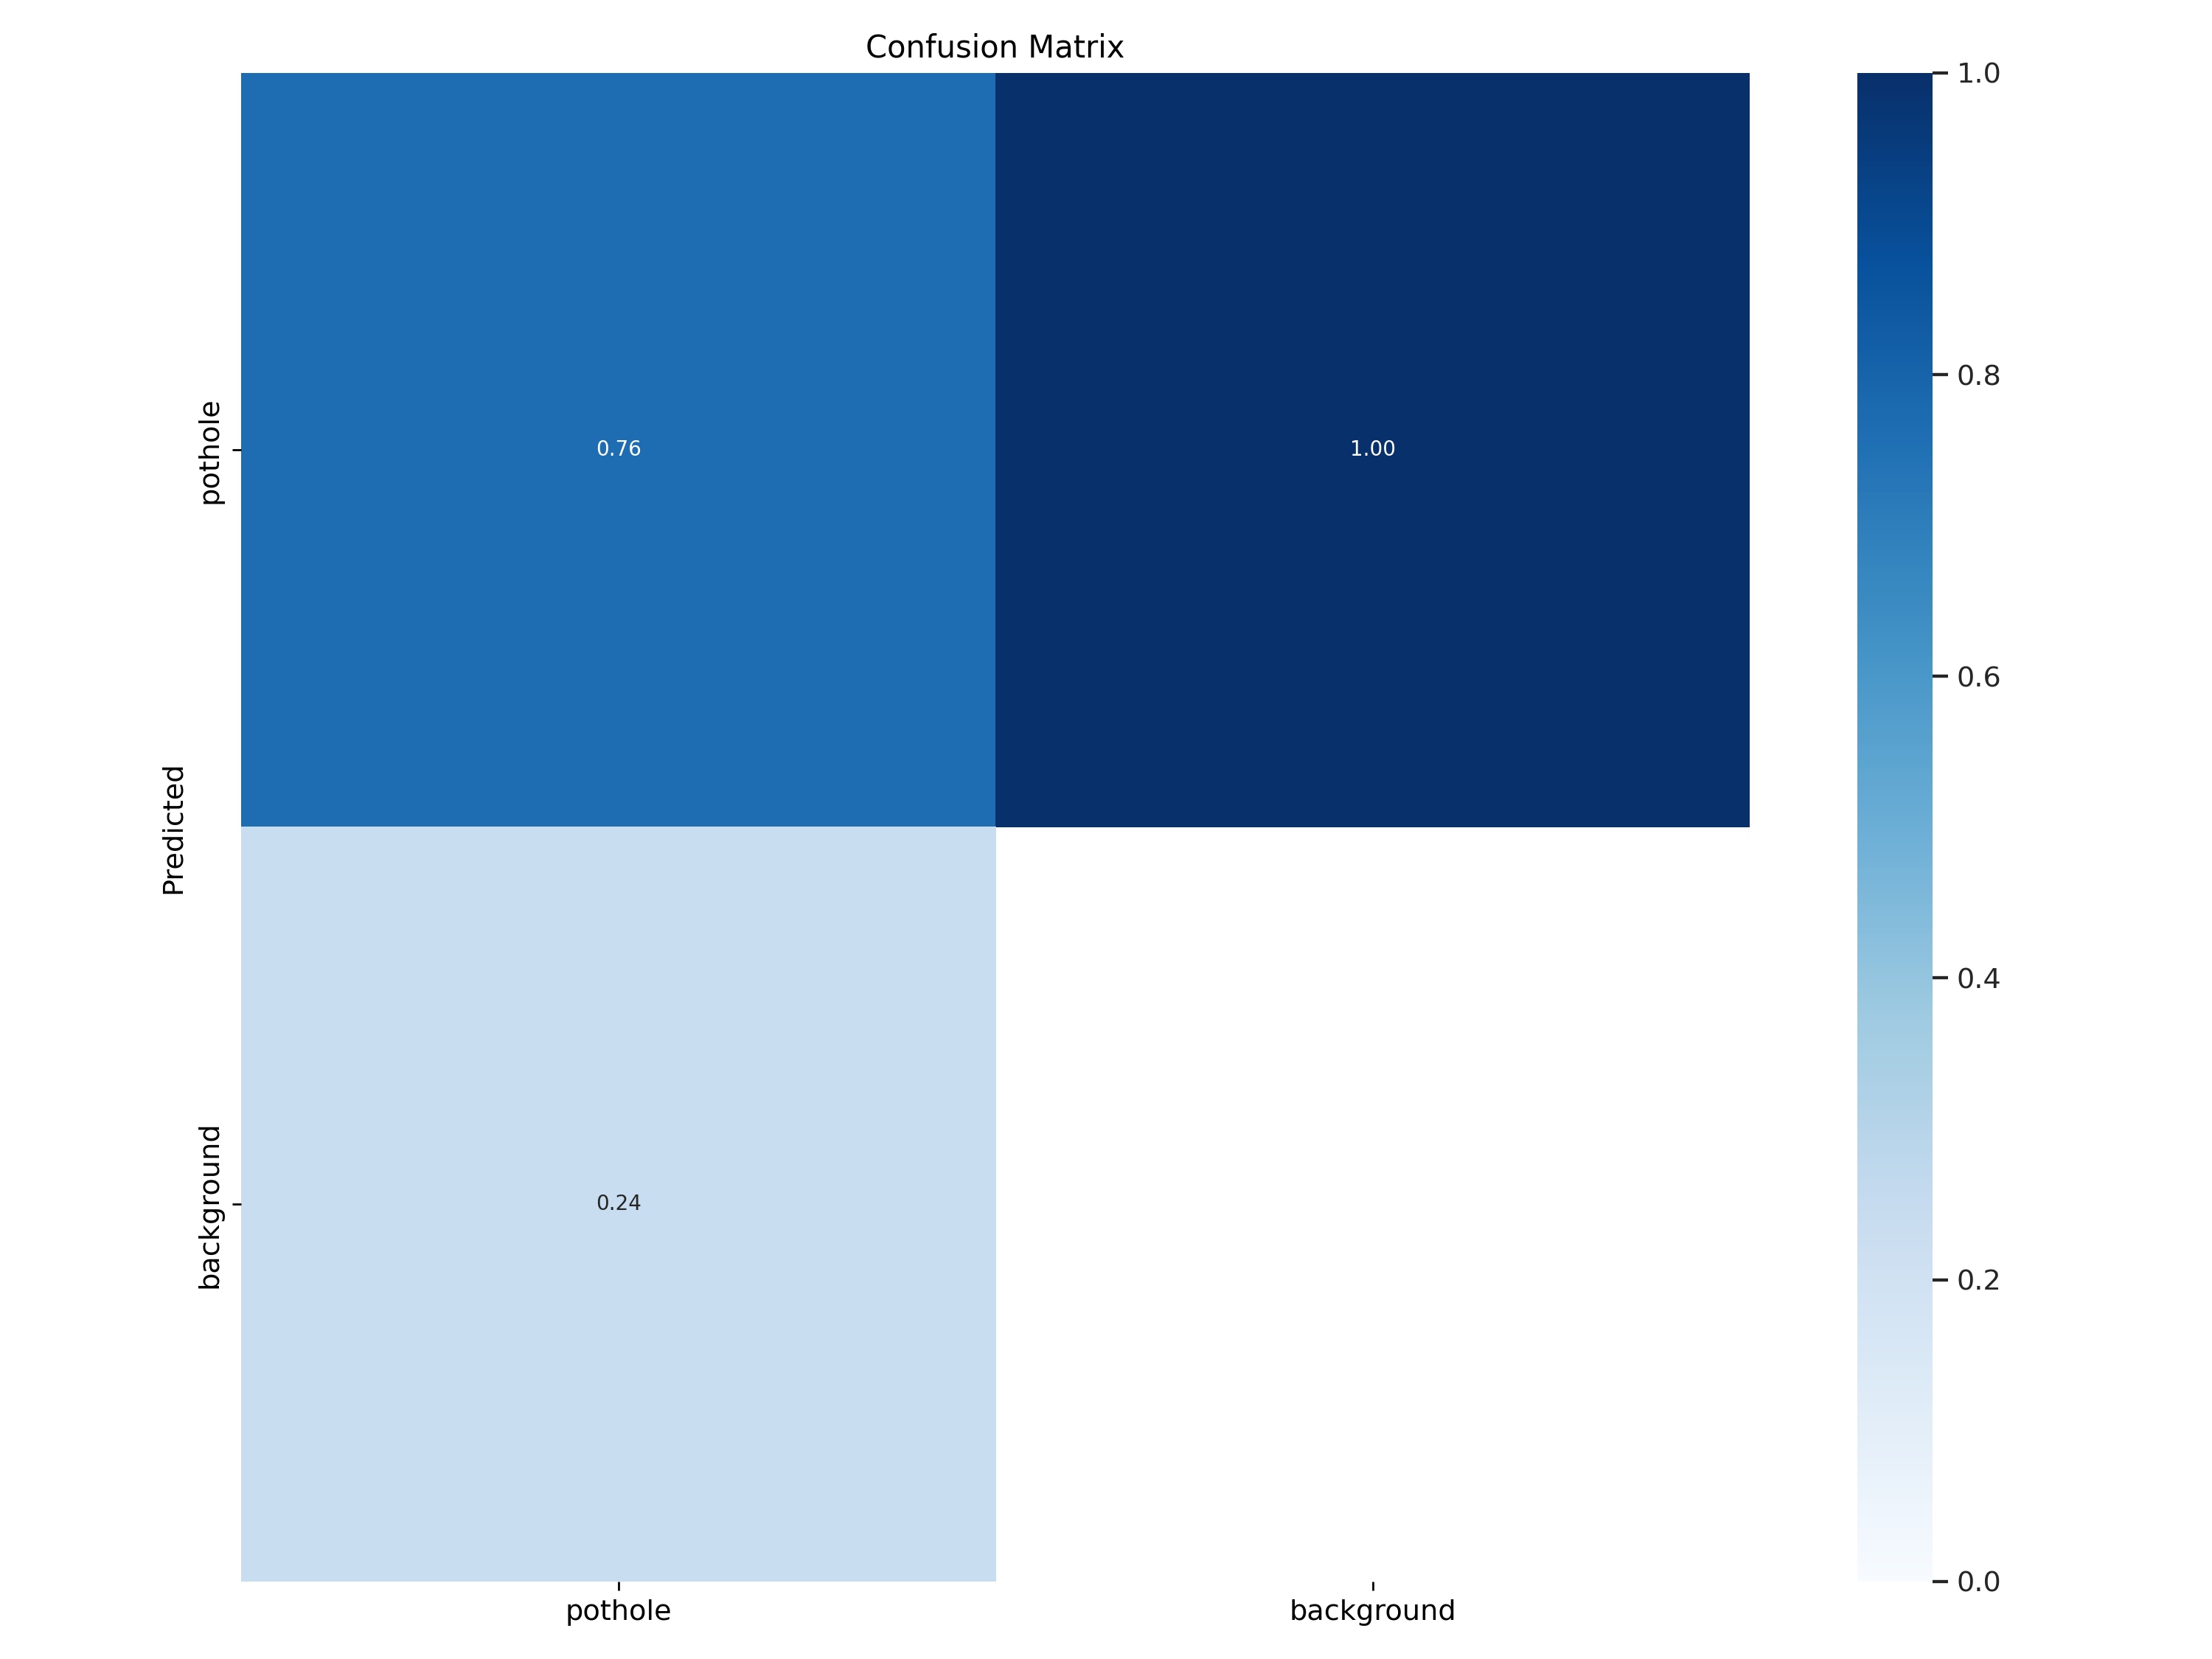
混淆矩阵:
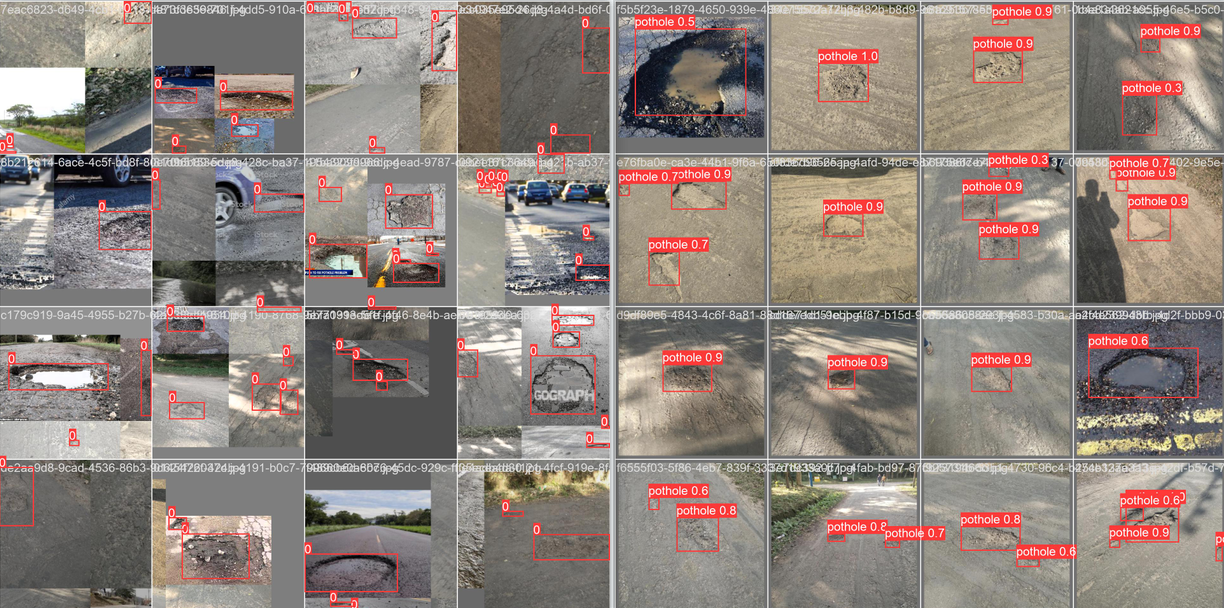
batch检测实例如下所示:
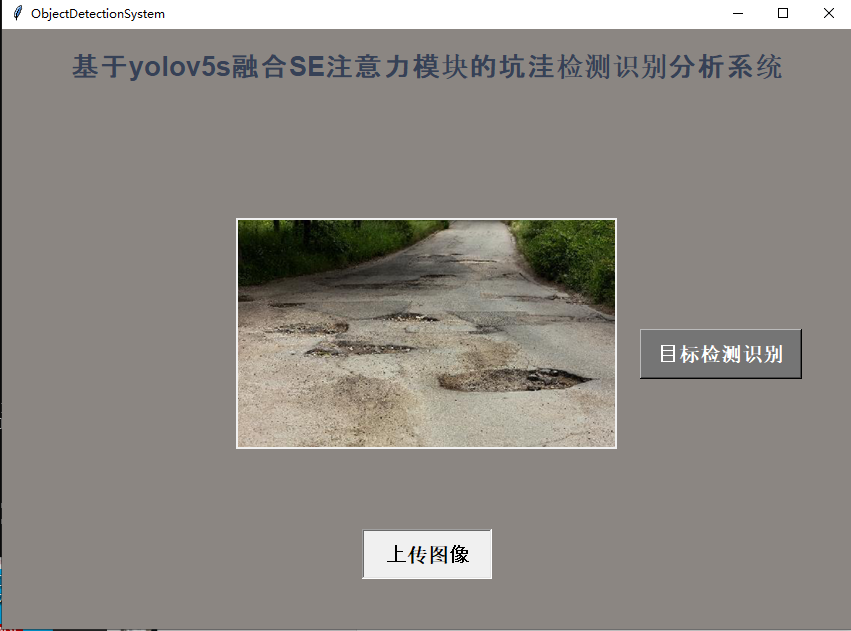
开发专用的界面模块实现推理可视化如下所示:

上传图像:
推理检测: