统计图柱形图绘制方法
常用的统计图有条形图、柱形图、折线图、曲线图、饼图、环形图、扇形图。
前几类图比较容易绘制,饼图环形图绘制较难。
今提供条形图和柱形图的绘制方法,附加环形图和艺术环图的绘制方法供参考。
本方法采用C语言的最基本功能:
( 1) 绘图功能画线,画圆,画长方形。
(2) 界面美工设计,界面文字打印输出。
代码中有详细的注释,通俗易懂,一看就会。
下面是绘制柱形图、条形图的代码:
//变量: 可设置成全局变量或私有变量
Canvas cs ; //画布,绘制图表载体
float pi=3.1415926535 ;
float a ; //三角函数 sin (a), cos (a),
float r ; //圆半径 radius
int i, j, n ;
float x0,y0,x1,y1 ; //作图坐标
float dx,dy ; //中心坐标
string ss, ss1, ss2 ; //打印文字
int p[6] ; //set data or input data
double pn ; //显示数据

//*************************
BarChart4 (){ //条形图
cs.ClearDraw (0,src); //清屏
clearOutput();
cs.SetFillMode (1);//0不填色,1填色
cs.SetColor (255,250,250,250);
cs.DrawRect (0,4,720,600); //back board
cs.SetColor (255,140,140,140);
cs.DrawRect (24,24,706,586); //back
cs.SetColor (255,250,250,250);
cs.DrawRect (20,20,700,580); //back
cs.SetFillMode (0);//0不填色,1填色
cs.SetColor (255,0,0,240);
cs.DrawRect (20,20,700,580); //框线
cs.DrawRect (24,24,696,576); //框线
cs.SetFillMode (1);//0不填色,1填色
cs.SetStrokeWidth(1);
for (j=0; j<=9 ; j++){ //draw grid
for (i=0; i<=5 ; i++){
dx=j*50+150 ;
dy=i*50+100 ;
cs.SetColor(255,220,220,220);
cs.DrawRect (dx,dy,dx+49,dy+49); } } //grid
for (i=0; i<=10 ; i++){
dx=i*50+150 ;
cs.SetColor(255,250,0,0);
cs.DrawRect (dx-3,403,dx,409); } //标线
cs.SetColor(255,250,0,0);
cs.DrawRect (50,400,670,403); //X线
cs.DrawRect (147,90,150,400); //Y线
cs.SetTextStyle (0); //画标尺
cs.SetTextSize (18);
ss=" 0 25 50 75 100 125" ;
ss1=" 150 175 200 225 250" ;
cs.DrawText (ss,140,425) ;
cs.DrawText (ss1,430,425) ; //standard
cs.SetTextSize (20);
cs.DrawText ("年份 量比",55,390) ;
cs.SetTextSize (24);
cs.DrawText ("Bar Chart 📊",545,60) ;
cs.DrawText ("计划 完成 ", 120,70) ;
cs.SetColor(255,250,200,100);
cs.DrawRect (178,48,222,72) ;
cs.SetColor(255,0,190,190);
cs.DrawRect (180,50,220,70) ;
cs.SetColor(255,250,0,0) ;
cs.DrawCircle (100,60,9) ;
cs.DrawRect (80,58,100,62) ;
//依数据绘出条形图
int yy ; //打印年份
p[1]=150; p[2]=170; p[3]=165; p[4]=125; p[5]=210;
cs.SetTextSize (22);
for (n=1; n<=5 ; n++){ //draw Bar Chart
cs.SetFillMode (1);//0不填色,1填色
cs.SetColor(255,0,190,190);
dx=150 ; dy=n*50+100 ;
m=p[n]*2;
cs.DrawRect (dx,dy-12,dx+m,dy+12) ;
ss=intToString (p[n]) ;
cs.DrawText (ss,dx+m-35,dy-14) ; //p(n)
yy=2018+n ;
ss1=intToString (yy) ;
cs.SetColor(255,0,100,0);
cs.DrawText (ss1, 85,dy+7) ; //SD year
cs.SetColor(255,250,20,100);
cs.SetFillMode (0);//0不填色,1填色
cs.DrawRect (dx,dy-12,dx+m,dy+12) ; }
//绘出标线: 计划
p[1]=140; p[2]=150; p[3]=160; p[4]=170; p[5]=180;
for (n=1; n<=5 ; n++){ //draw Line Chart
cs.SetColor(255,250,0,0); //折线
cs.SetFillMode (1);//0不填色,1填色
cs.SetStrokeWidth(2);
dx=150 ; dy=n*50+100 ;
m=p[n]*2 ;
cs.DrawCircle (dx+m,dy,9) ;
cs.DrawRect (dx+m,dy-2,150,dy+2) ;
ss1=intToString (p[n]) ;
cs.DrawText (ss1,dx+m+10, dy+7) ; }//data
//draw title 统计图题标
cs.SetFillMode (1);//0不填色,1填色
cs.SetTextSize (50);
cs.SetTextStyle (1);
cs.SetStrokeWidth(1);
ss="统计图 - 条形图" ;
cs.SetColor(255,50,120,20); //立体字
cs.DrawText (ss,154,524); //阴影
cs.SetColor(255,0,250,0);
cs.DrawText (ss,150,520); //本字
cs.SetFillMode (0);//0不填色,1填色
cs.SetColor(255,250,150,0);
cs.DrawText (ss,150,520); //框线
cs.Update ();
}//barChart4 ()

//**************************
BarChart5 ( ){ // 柱状图绘制方法
int yy ; //打印年份
cs.ClearDraw (0,src); //清屏
clearOutput();
cs.SetFillMode (1);//0不填色,1填色
cs.SetColor (255,250,250,250);
cs.DrawRect (0,4,720,600); //back board
cs.SetColor (255,140,140,140);
cs.DrawRect (24,24,706,586); //back
cs.SetColor (255,250,250,250);
cs.DrawRect (20,20,700,580); //back
cs.SetFillMode (0);//0不填色,1填色
cs.SetColor (255,0,0,240);
cs.DrawRect (20,20,700,580); //框线
cs.DrawRect (24,24,696,576); //框线
cs.SetFillMode (1);//0不填色,1填色
cs.SetStrokeWidth(1);
// cs.SetColor(255,220,220,220);
for (j=0; j<=9 ; j++){
for (i=0; i<=5 ; i++){
dx=j*50+150 ;
dy=i*50+100 ;
cs.SetColor(255,220,0,220);
cs.DrawRect(138,dy-1,147,dy+1);
cs.SetColor(255,220,220,220);
cs.DrawRect(dx,dy,dx+49,dy+49); } }//grid
cs.SetColor(255,250,0,0);
cs.DrawRect (60,400,670,403); //X线
cs.DrawRect (147,90,150,400); //Y线
cs.SetTextStyle (0); //画标尺
cs.SetTextSize (20);
cs.DrawText (" 50",93,358) ;
cs.DrawText ("100",90,308) ;
cs.DrawText ("150",90,258) ;
cs.DrawText ("200",90,208) ;
cs.DrawText ("250",90,158) ;
cs.DrawText ("300",90,108) ;
cs.SetTextSize (24);
cs.DrawText ("量比",85,396) ;
cs.SetTextSize (24);
cs.SetColor(255,0,60,0);
cs.DrawText ("年份 >",85,428) ;
cs.DrawText ("Bar Chart 📊",510,70) ;
cs.DrawText ("计划 完成 ", 120,70) ;
cs.SetColor(255,250,200,100);
cs.DrawRect (178,48,222,72) ;
cs.SetColor(255,0,120,0);
cs.DrawRect (180,50,220,70) ;
cs.SetColor(255,250,0,0) ;
cs.DrawCircle (100,60,9) ;
cs.DrawRect (80,58,100,62) ;
//依数据绘出条形图
p[0]=0 ; x2=150 ; y2=300 ;
p[1]=150; p[2]=250; p[3]=290; p[4]=265; p[5]=185;
for (n=1; n<=5 ; n++){ //draw Bar Chart
cs.SetFillMode (1);//0不填色,1填色
cs.SetStrokeWidth(2);
dx=n*100+100 ; dy=400 ;
m=p[n] ;
cs.SetColor(255,0,120,0);
cs.DrawRect (dx-20,400-m,dx+20,dy) ; //bar
cs.SetTextSize (20);
yy=2018+n ;
ss1=intToString (yy) ;
cs.DrawText (ss1,dx-22,dy+25) ; //year
x3=n*100+100 ; //完成折线
y3=400-p[n] ;
cs.DrawCircle (x3,y3, 7) ; //完成折线
cs.DrawLine (x3,y3, x2,y2) ; //完成折线
x2=x3 ; y2=y3 ;
cs.SetTextSize (18);
cs.SetColor(255,250,230,0);
ss=intToString (p[n]) ;
cs.DrawText (ss,dx-15,dy-m+20) ; //data
cs.SetColor(255,250,200,100); //框线
cs.SetFillMode (0);//0不填色,1填色
cs.DrawRect (dx-20,400-m,dx+20,dy) ;
}
//绘出折线图 计划
p[1]=160; p[2]=180; p[3]=200; p[4]=220; p[5]=240;
x0=150 ; y0=250 ; //起点坐标值
for (n=1; n<=5 ; n++){ //draw Line Chart
cs.SetColor(255,250,0,0); //折线
cs.SetFillMode (1);//0不填色,1填色
cs.SetStrokeWidth(2);
dx=n*100+100 ; dy=400 ;
m=p[n] ;
cs.DrawCircle (dx,dy-m,9) ;
cs.DrawLine (dx,dy-m,dx,400) ;
ss=intToString (p[n]) ;
cs.DrawText (ss,dx+10,dy-m+6) ; //data
x1=n*100+100 ; //计划折线
y1=400-p[n] ;
cs.DrawLine (x0,y0, x1,y1) ; //计划折线
x0=x1 ; y0=y1 ; //值转换
}
//draw title 统计图题标
cs.SetFillMode (1);//0不填色,1填色
cs.SetTextSize (50);
cs.SetTextStyle (1);
cs.SetStrokeWidth(1);
ss="统计图 - 柱形图" ;
cs.SetColor(255,50,120,20); //立体字
cs.DrawText (ss,164,524); //阴影
cs.SetColor(255,0,250,0);
cs.DrawText (ss,160,520); //本字
cs.SetFillMode (0);//0不填色,1填色
cs.SetColor(255,250,150,0);
cs.DrawText (ss,160,520); //框线
cs.Update ();
}//BarChart5 ()

//****附加:环形图 (带色块分隔线 )****
PieGraph2 (){ //环形图(带色块分隔线)
cs.ClearDraw (0,src); //清屏
clearOutput();
cs.SetFillMode (1);//0不填色,1填色
cs.SetColor (255,250,250,250);
cs.DrawRect (0,4,720,600); //back board
cs.SetColor (255,140,140,140);
cs.DrawRect (24,24,706,586); //back
cs.SetColor (255,230,240,250);
cs.DrawRect (20,20,700,580); //back
cs.SetFillMode (0);//0不填色,1填色
cs.SetColor (255,0,0,240);
cs.DrawRect (20,20,700,580); //框线
cs.DrawRect (24,24,696,576); //框线
cs.SetFillMode (1);//0不填色,1填色
cs.SetStrokeWidth(2);
cs.SetTextSize (30); //题标
cs.SetColor (255,0,0,250);
cs.DrawText ("PieGraph Ⓜ",510,70) ;
dx=360 ; dy=300 ;
cs.SetColor(255,250,240,240);
cs.DrawCircle(dx,dy,135); //center
//绘制图表
cs.SetTextStyle (0);
cs.SetTextSize (18);
r=120;
p[0]=-180;
p[1]=150; p[2]=170; p[3]=156; p[4]=152; p[5]=92;
k[0]=-180;
k[1]=k[0]+p[1];
k[2]=k[1]+p[2];
k[3]=k[2]+p[3];
k[4]=k[3]+p[4];
k[5]=k[4]+p[5];
for (n=1; n<=5 ; n++){ //data=5
for (i= k[n-1]; i<=k[n]; i++){ //draw Piegraph
if (n==1) cs.SetColor(255,0,250,0);
if (n==2) cs.SetColor(255,255,205,0);
if (n==3) cs.SetColor(255,250,0,0);
if (n==4) cs.SetColor(255,250,50,220);
if (n==5) cs.SetColor(255,0,150,220);
a=pi/360*((k[n-1]+k[n])/2) ; //这是第二种画法
x1=(float)(5*cos (a))+dx ;
y1=(float)(5*sin (a))+dy ;
a=pi/360*i ;
x0=(float)(r*cos (a))+x1 ; //r=radius
y0=(float)(r*sin (a))+y1 ;
cs.DrawLine (x1,y1,x0,y0); //draw out
cs.DrawRect (100,n*40+20,195,n*40+50); //色标
//** print data as "28.25%"
s=intToString (p[n]);
cs.DrawText (s, 60,40+n*40);
pn=p[n]*10000/720 ; //扩大100
pn=pn/100 ; //保留2位小数
ss1=doubleToString (pn)+"%" ;
cs.SetColor(255,250,250,250);
cs.DrawText (ss1,120,40+n*40);
cs.SetColor(255,0,0,150); //图上标( n% )
ma=pi/360*((k[n-1]+k[n])/2) ;
x1=(float)((r-45)*cos (ma))+dx-33;
y1=(float)((r-35)*sin (ma))+dy ;
cs.DrawText (ss1,x1,y1);
//** 中心加圆是环图,不加圆是饼图
cs.SetColor(255,250,240,240);
cs.DrawCircle(dx,dy,45); //中心加圆是环图
cs.Update (); }
cs.DrawLine (dx,dy,x0,y0); } //色块有分隔线
//打印统计图题标
cs.SetFillMode (1);//0不填色,1填色
cs.SetTextSize (60);
cs.SetTextStyle (1);
cs.SetStrokeWidth(1);
ss="统计图 - 环图" ;
cs.SetColor(255,50,120,20); //立体字
cs.DrawText (ss,154,524); //阴影
cs.SetColor(255,0,250,0);
cs.DrawText (ss,150,520); //本字
cs.SetFillMode (0);//0不填色,1填色
cs.SetColor(255,250,150,0);
cs.DrawText (ss,150,520); //框线
cs.Update ();
}//PieGraph2 ()
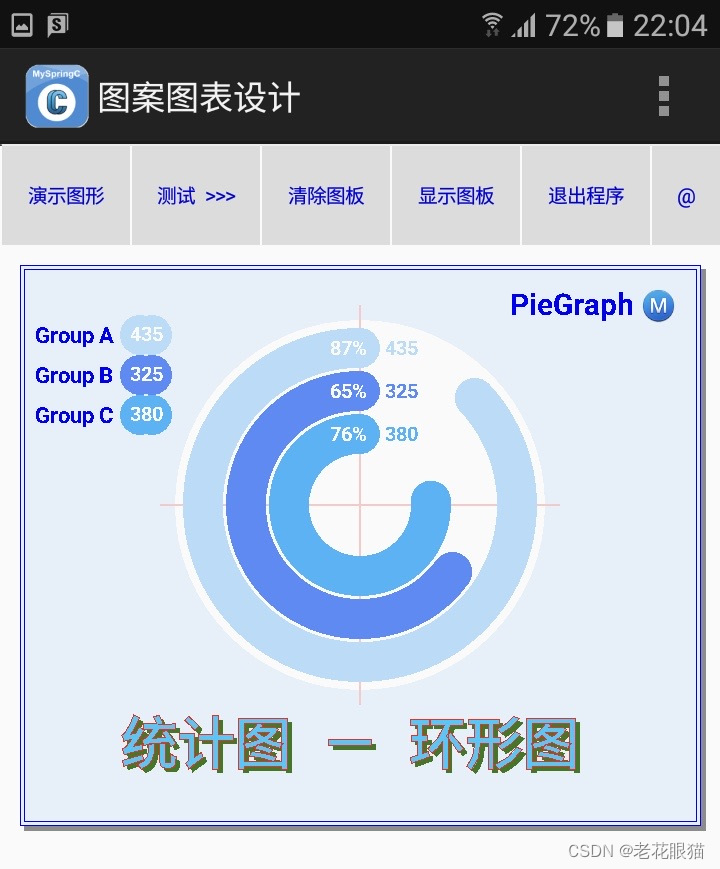
//****附加:艺术环图绘制方法 **********
PieGraph1 (){
//环形图:很有艺术感的图表,也可称C形图
cs.ClearDraw (0,src); //清屏(cls), clear screen
clearOutput(); //清除 print 字串
cs.SetFillMode (1);//0不填色,1填色
cs.SetColor (255,250,250,250);
cs.DrawRect (0,4,720,600); //画图表底板
cs.SetColor (255,140,140,140);
cs.DrawRect (24,24,706,586); //back
cs.SetColor (255,230,240,250);
cs.DrawRect (20,20,700,580); //back
cs.SetFillMode (0); //0不填色,1填色
cs.SetColor (255,0,0,240);
cs.DrawRect (20,20,700,580); //框线
cs.DrawRect (24,24,696,576); //框线
cs.SetFillMode (1); //0不填色,1填色
cs.SetTextStyle (1);
cs.SetStrokeWidth(2);
cs.SetTextSize (30); //题标
cs.SetColor (255,0,0,250);
cs.DrawText ("PieGraph Ⓜ",510,70) ;
dx=360 ; dy=260 ; //图形中心点
cs.SetColor(255,250,250,250);
cs.DrawCircle(dx,dy,185); //center 图案底色
cs.SetColor(255,250,200,200);
cs.DrawLine (dx-200,dy,dx+200,dy); //十字线
cs.DrawLine (dx,dy-200,dx,dy+200); //色标
cs.SetTextStyle (1); //粗体字
cs.SetTextSize (22);
cs.SetColor(255,0,0,250);
cs.DrawText ("Group A",35,98);
cs.DrawText ("Group B",35,138);
cs.DrawText ("Group C",35,178);
setn=1 ;
p[1]=87; p[2]=65; p[3]=76; //intput data
for (n=1; n<=3 ; n++){ //data=3
r=200-n*43 ; //r=radius
pn=p[n]*72/10+180;
print "pn= ",pn;
for (i=180 ; i<=pn; i++){ //画图案 颜色可自定
a=pi/360*i ;
if (n==1) cs.SetColor(255,180,220,250); //设色
if (n==2) cs.SetColor(255,80,140,250);
if (n==3) cs.SetColor(255,50,180,250);
x0=(float)(r*cos (a))+dx; //r=radius
y0=(float)(- r*sin (a))+dy;
cs.DrawCircle (152,n*40+50,20); //色标
cs.DrawCircle (140,n*40+50,20); //色标
cs.DrawCircle (x0,y0,20) ; //绘出图案
//** print data as "87%", 加"%"
//input data 转换,量和百分比转换,定标500=100%
ss1=intToString (p[n])+"%" ;
ss2=intToString (p[n]*5) ;
cs.SetTextSize (20);
cs.DrawText (ss2,dx+25,dy-193+n*43);
cs.SetColor(255,250,250,250);
cs.DrawText (ss2,130,n*40+56);
cs.DrawText (ss1,dx-30,dy-193+n*43);
//动画式显示效果:逐点更新绘出
cs.Update (); } }
//打印统计图题标
cs.SetFillMode (1); //0不填色,1填色
cs.SetTextSize (60);
cs.SetTextStyle (1);
cs.SetStrokeWidth(1);
ss="统计图 - 环形图" ;
cs.SetColor(255,50,120,20); //立体字
cs.DrawText (ss,124,524); //阴影
cs.SetColor(255,0,200,250);
cs.DrawText (ss,120,520); //本字
cs.SetFillMode (0); //0不填色,1填色
cs.SetColor(255,250,0,0);
cs.DrawText (ss,120,520); //框线
cs.Update ();
}//PieGraph1 ()
//**** END *****************