import matplotlib.pyplot as plt
import scipy
import seaborn as sns
# 加载内置的数据集
df = sns.load_dataset('tips')
#create regplot
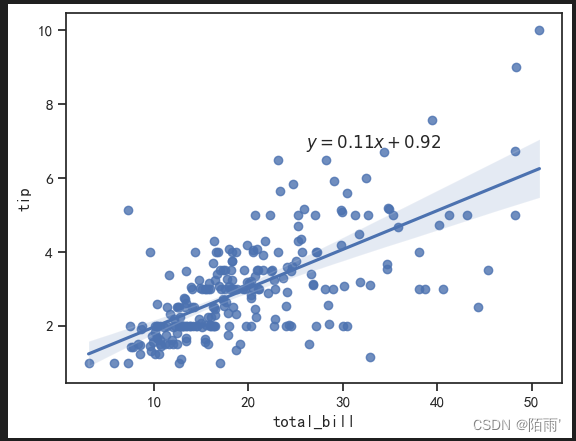
p = sns.regplot(x='total_bill', y='tip', data=df)
#calculate slope and intercept of regression equation
slope, intercept, r, p, sterr = scipy.stats.linregress(x=p.get_lines()[0].get_xdata(),
y=p.get_lines()[0].get_ydata())
#add regression equation to plot
result_string = f"$y = {slope:.2f}x + {intercept:.2f}$"
plt.figtext(0.5, 0.6, result_string)
plt.show()
运行结果如下:
2024年2月7日22:33:05
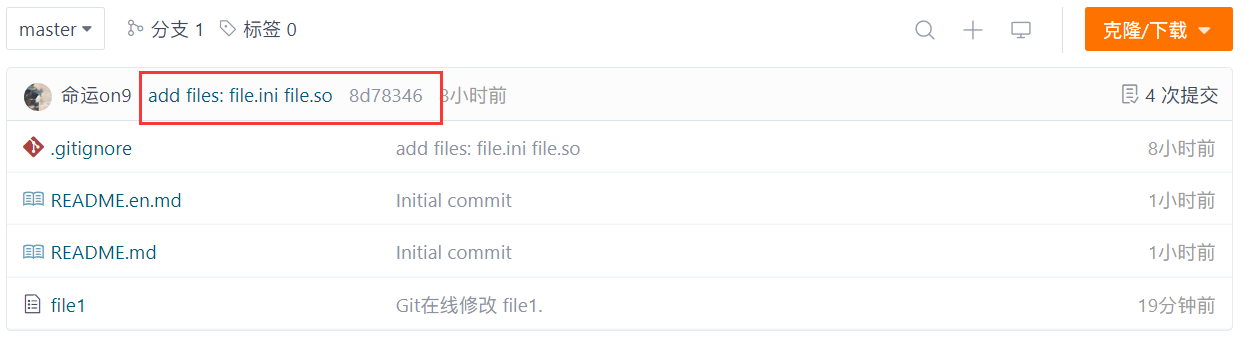
![[项目管理] 如何使用git客户端管理gitee的私有仓库](https://img-blog.csdnimg.cn/direct/9969af1ae6d240b688516649a688b024.png)
![K8S系列文章之 [使用 Alpine 搭建 k3s]](https://img-blog.csdnimg.cn/img_convert/3f682727b33bd7efffe905250ee3a569.png)