FailureDetectionPeriodBlockMinutes
看看官方文档中对该参数如何描述
orchestrator will detect failures to your topology, always. As a matter of configuration you may set the polling frequency and specific ways for orchestrator to notify you on such detection.
Recovery is discussed in configuration: recovery
{
  "FailureDetectionPeriodBlockMinutes": 60,
}
orchestrator runs detection every second.
FailureDetectionPeriodBlockMinutes is an anti-spam mechanism that blocks orchestrator from notifying the same detection again and again and again.
翻译
orchestrator会对你的集群进行失败(故障)发现。
每秒进行一次故障发现,FailureDetectionPeriodBlockMinutes 参数是一种 “反垃圾邮件”机制,能够确保orchestrator不会重复发现相同故障
翻译完之后大家是不是还是有些懵,我是在实际测试的时候,发现该参数虽然设置了60分钟,但是在60分钟对相同实例还是能够发现其他故障,下面通过源码解读下原因。
源码解读
全局搜索该参数FailureDetectionPeriodBlockMinutes ,发现只出现在如下代码中。
// ClearActiveFailureDetections clears the "in_active_period" flag for old-enough detections, thereby allowing for
// further detections on cleared instances. 清除in_active_period 标志
func ClearActiveFailureDetections() error {
	_, err := db.ExecOrchestrator(`
			update topology_failure_detection set
				in_active_period = 0,
				end_active_period_unixtime = UNIX_TIMESTAMP()
			where
				in_active_period = 1
				AND start_active_period < NOW() - INTERVAL ? MINUTE
			`,
		config.Config.FailureDetectionPeriodBlockMinutes,
	)
	return log.Errore(err)
}
topology_failure_detection 表为记录故障发现的表,
表结构如下
mysql> show  create table topology_failure_detection\G
*************************** 1. row ***************************
       Table: topology_failure_detection
Create Table: CREATE TABLE `topology_failure_detection` (
  `detection_id` bigint(20) unsigned NOT NULL AUTO_INCREMENT,
  `hostname` varchar(128) NOT NULL,
  `port` smallint(5) unsigned NOT NULL,
  `in_active_period` tinyint(3) unsigned NOT NULL DEFAULT '0',
  `start_active_period` timestamp NOT NULL DEFAULT CURRENT_TIMESTAMP,
  `end_active_period_unixtime` int(10) unsigned NOT NULL,
  `processing_node_hostname` varchar(128) NOT NULL,
  `processcing_node_token` varchar(128) NOT NULL,
  `analysis` varchar(128) NOT NULL,
  `cluster_name` varchar(128) NOT NULL,
  `cluster_alias` varchar(128) NOT NULL,
  `count_affected_slaves` int(10) unsigned NOT NULL,
  `slave_hosts` text NOT NULL,
  `is_actionable` tinyint(4) NOT NULL DEFAULT '0',
  PRIMARY KEY (`detection_id`),
  UNIQUE KEY `host_port_active_recoverable_uidx_topology_failure_detection` (`hostname`,`port`,`in_active_period`,`end_active_period_unixtime`,`is_actionable`),
  KEY `in_active_start_period_idx_topology_failure_detection` (`in_active_period`,`start_active_period`)
) ENGINE=InnoDB AUTO_INCREMENT=2450 DEFAULT CHARSET=ascii
注意表中有 由5个字段组成的唯一索引 ,下面的逻辑要用到
UNIQUE KEY `host_port_active_recoverable_uidx_topology_failure_detection` (`hostname`,`port`,`in_active_period`,`end_active_period_unixtime`,`is_actionable`),
字段含义分别为
`hostname`, 主机名
`port`, 端口
`in_active_period`, 该故障是否处于活跃期间标识
`end_active_period_unixtime`, "故障活跃时期结束" 的时间戳
`is_actionable` 该故障是否要进行recovery
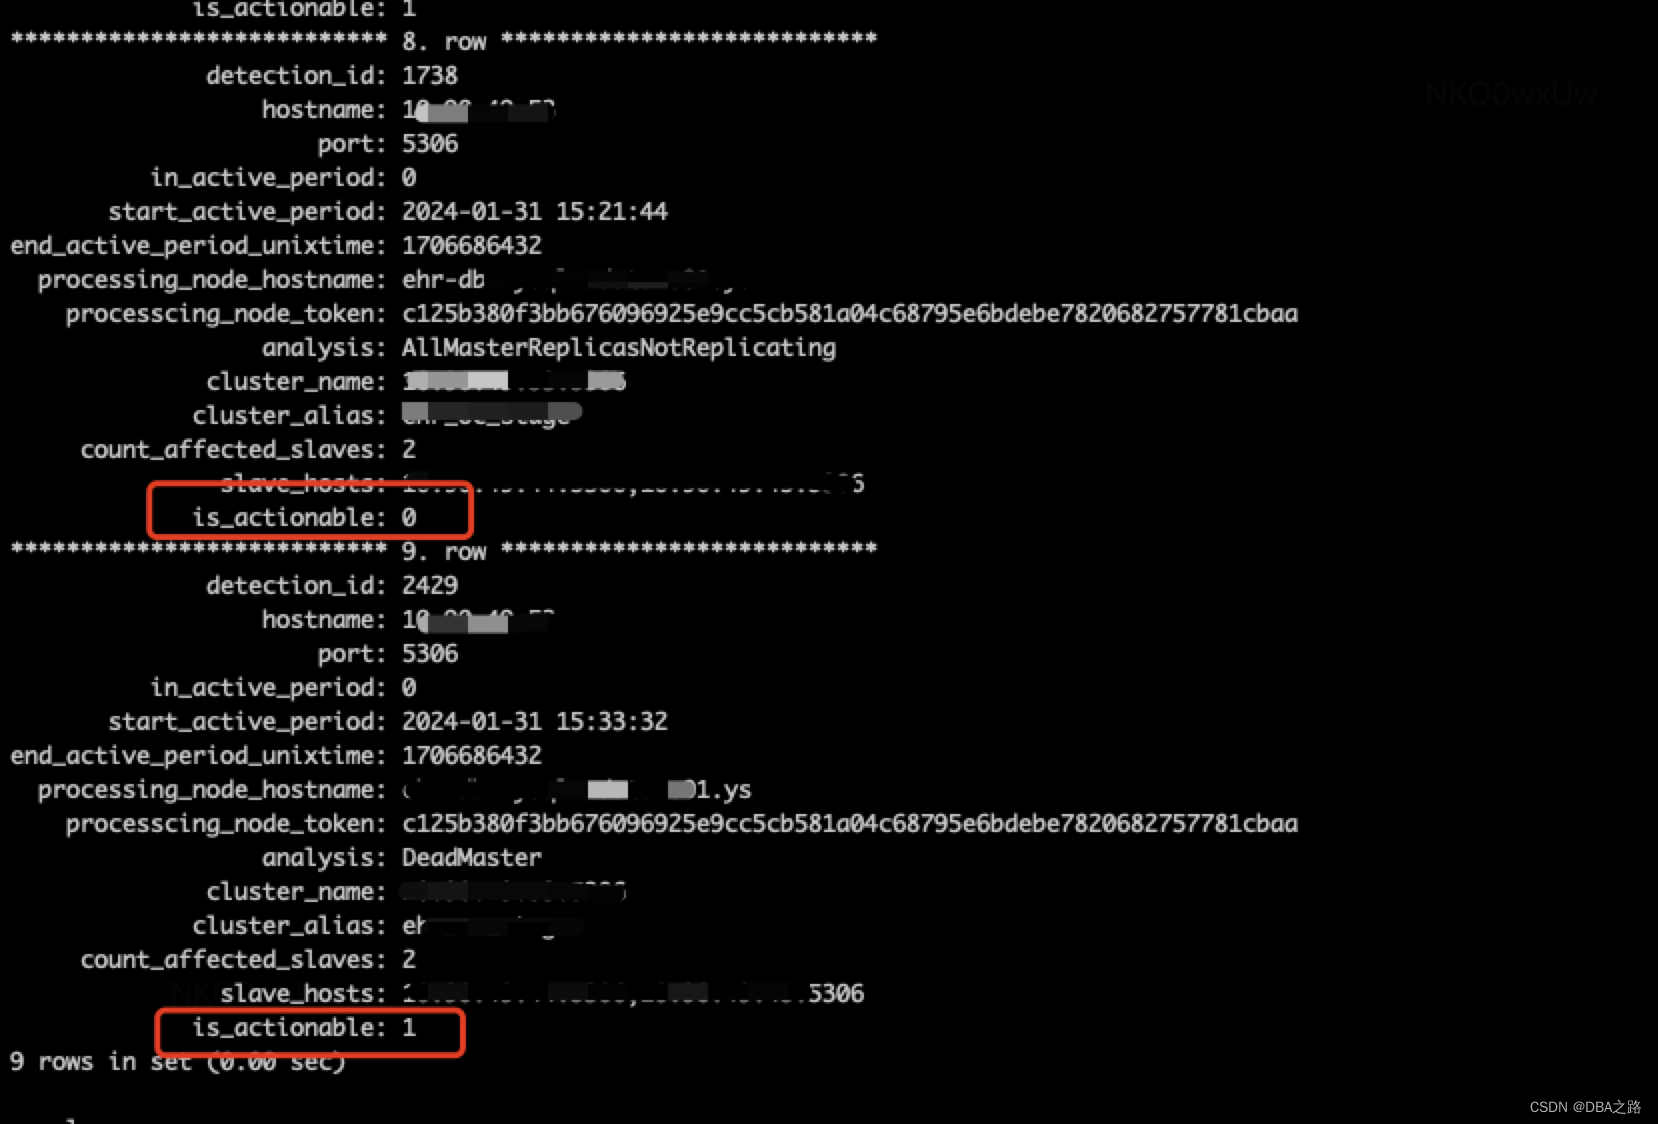
表中信息如下
*************************** 9. row ***************************
              detection_id: 2429
                  hostname: 10.10.10.53
                      port: 5306
          in_active_period: 0
       start_active_period: 2024-01-31 15:33:32
end_active_period_unixtime: 1706686432
  processing_node_hostname: ehr-db-mysql-mdata-s01.ys
    processcing_node_token: c125b380f3bb676096925e9cc5cb581a04c68795e6bdebe7820682757781cbaa
                  analysis: DeadMaster
              cluster_name: 10.90.49.53:5306
             cluster_alias: ehr_oc_stage
     count_affected_slaves: 2
               slave_hosts:  10.10.10.44:5306, 10.10.10.45:5306
             is_actionable: 1
该段代码的逻辑是更新 topology_failure_detection 表中
满足条件 start_active_period < NOW() - INTERVAL 60 MINUTE的in_active_period 标识字段
全局搜索表 topology_failure_detection,找到数据插入的逻辑
// AttemptFailureDetectionRegistration tries to add a failure-detection entry; if this fails that means the problem has already been detected
// AttemptFailureDetectionRegistration 尝试往数据库中插入这个故障 记录 ,如果失败 意味着这个问题可能已经被发现了
func AttemptFailureDetectionRegistration(analysisEntry *inst.ReplicationAnalysis) (registrationSuccessful bool, err error) {
	args := sqlutils.Args(
		analysisEntry.AnalyzedInstanceKey.Hostname,
		analysisEntry.AnalyzedInstanceKey.Port,
		process.ThisHostname,
		util.ProcessToken.Hash,
		string(analysisEntry.Analysis),
		analysisEntry.ClusterDetails.ClusterName,
		analysisEntry.ClusterDetails.ClusterAlias,
		analysisEntry.CountReplicas,
		analysisEntry.Replicas.ToCommaDelimitedList(),
		analysisEntry.IsActionableRecovery,
	)
	startActivePeriodHint := "now()"
	if analysisEntry.StartActivePeriod != "" {
		startActivePeriodHint = "?"
		args = append(args, analysisEntry.StartActivePeriod)
	}

	query := fmt.Sprintf(`
			insert ignore
				into topology_failure_detection (
					hostname,
					port,
					in_active_period,
					end_active_period_unixtime,
					processing_node_hostname,
					processcing_node_token,
					analysis,
					cluster_name,
					cluster_alias,
					count_affected_slaves,
					slave_hosts,
					is_actionable,
					start_active_period
				) values (
					?,
					?,
					1,
					0,
					?,
					?,
					?,
					?,
					?,
					?,
					?,
					?,
					%s
				)
			`, startActivePeriodHint)

	sqlResult, err := db.ExecOrchestrator(query, args...)
	if err != nil {
		return false, log.Errore(err)
	}
	rows, err := sqlResult.RowsAffected()
	if err != nil {
		return false, log.Errore(err)
	}
	return (rows > 0), nil
}
插入该表是使用的 insert ignore into ,如果有唯一索引冲突,则不会插入数据,则影响行数为0,
也不会执行 OnFailureDetectionProcesses 钩子脚本。
总结
小于FailureDetectionPeriodBlockMinutes时间内的同一个实例不会发现 `hostname`,`port`,`in_active_period`,`end_active_period_unixtime`,`is_actionable`都相同的故障。
我第一次是发现 AllMasterReplicasNotReplicating 类型故障,第一次是发现 DeadMaster 类型的故障,两种类型的 is_actionable 不同,所以能在60分钟发现两次故障
官方文档
https://github.com/openark/orchestrator/blob/f0d685e0325322ba28f0eb79e3e64eceff241a30/docs/configuration-failure-detection.md


![[Mac软件]Amadeus Pro 2.8.13 (2662) Beta多轨音频编辑器激活版](https://img-blog.csdnimg.cn/img_convert/099f5a4bbcf428030966f1f6751f1400.png)