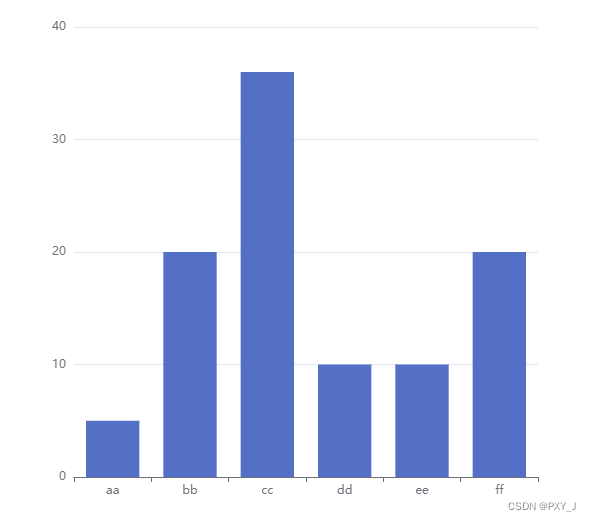
效果如图:
1、首先安装echarts
npm install echarts --save
安装后的版本为: “echarts”: “5.4.2”,
2、页面使用
<template>
  <div class="contact_us_page main">
    <div class="contact_us " id="main" ref="echartsBox">
    </div>
  </div>
</template>

<script setup>
import { ref, reactive, nextTick, onMounted } from "vue"
import * as echarts from 'echarts';
let myChart = ref()
let option = reactive({
    title: {
      text: 'vue3使用echarts'
    },
    tooltip: {},
    xAxis: {
      data: ['aa', 'bb', 'cc', 'dd', 'ee', 'ff']
    },
    yAxis: {},
    series: [
      {
        name: '销量',
        type: 'bar',
        data: [5, 20, 36, 10, 10, 20]
      }
    ]
  })
const  showtable = ()=>{
  myChart.value = echarts.init(document.querySelector('#main'));
  // 绘制图表
  myChart.value.setOption(option)
  console.log(myChart.value);
  //echarts点击事件监听画布
  myChart.value.getZr().on('click', function(params) {
      console.log(params); // 获取点击事件的参数
      // 根据参数完成点击操作
  });
}

onMounted(()=>{
  showtable()
})
</script>

<style lang="scss" scoped>
.contact_us_page{
  background: #ffffff;
  box-shadow: 0px 2px 20px 0px rgba(0, 0, 0, 0.10);
  margin-bottom: 30px;
  .contact_us{
    padding:50px;
    height: 580px;
    width: 580px;
  }
}
</style>