文章目录
- docker安装prometheus
- docker安装grafana
- windows安装windows_exporter
- prometheus配置新增windows_exporter的job,
- 配置grafana
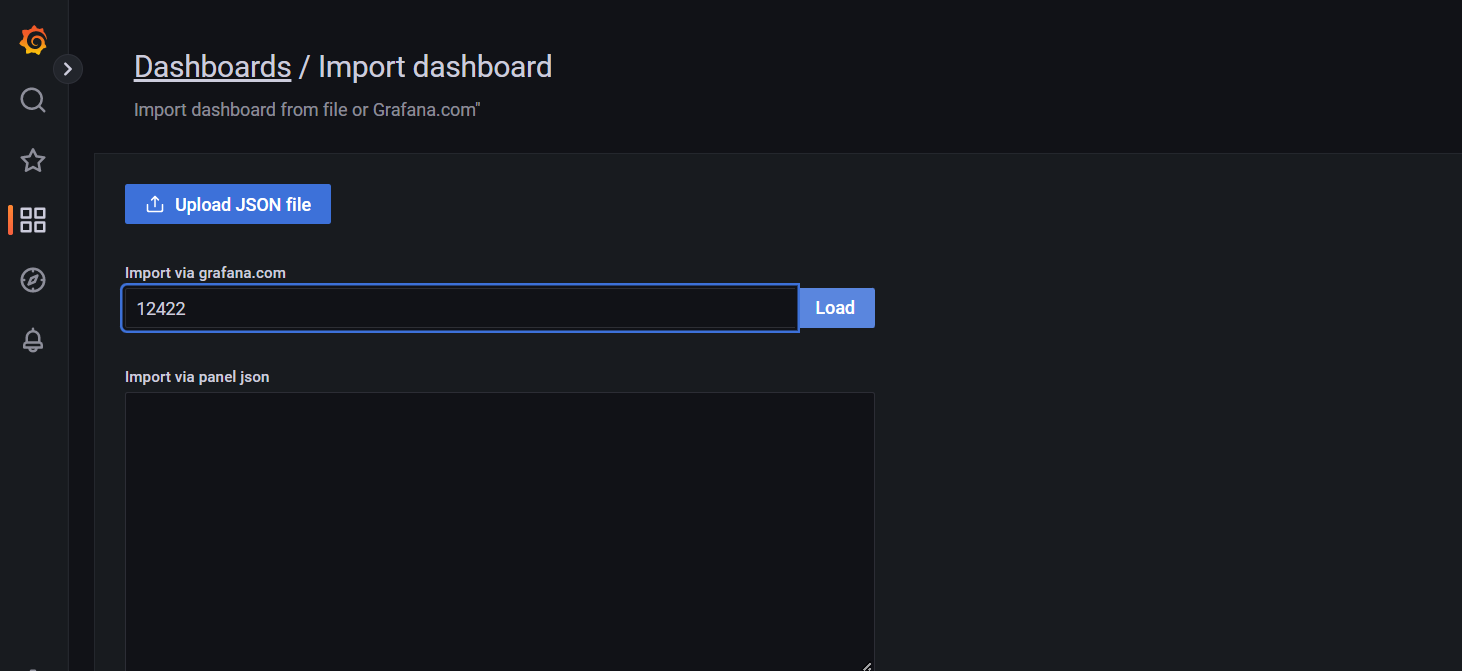
- 导入windows模板即可出现酷炫大屏
- 出现酷炫画面完成
docker安装prometheus
拉取镜像,在D盘下创建prometheus.yml配置文件,映射到docker里面d:/server/prometheus_grafana/prometheus.yml;
# my global config
global:
  scrape_interval: 15s # Set the scrape interval to every 15 seconds. Default is every 1 minute.
  evaluation_interval: 15s # Evaluate rules every 15 seconds. The default is every 1 minute.
  # scrape_timeout is set to the global default (10s).

# Alertmanager configuration
alerting:
  alertmanagers:
    - static_configs:
        - targets:
          # - alertmanager:9093

# Load rules once and periodically evaluate them according to the global 'evaluation_interval'.
rule_files:
# - "first_rules.yml"
# - "second_rules.yml"

# A scrape configuration containing exactly one endpoint to scrape:
# Here it's Prometheus itself.
scrape_configs:
  # The job name is added as a label `job=<job_name>` to any timeseries scraped from this config.
  - job_name: "prometheus"

    # metrics_path defaults to '/metrics'
    # scheme defaults to 'http'.

    static_configs:
      - targets: ["localhost:9090"]
  - job_name: 'http_status'
    metrics_path: /probe
    params:
      module: [http_2xx]
    static_configs:
      - targets: ['https://baidu.com']
        labels:
          instance: baidu.com
          group: web
    relabel_configs:
      - source_labels: [__address__]
        target_label: __param_target
      - target_label: __address__
        replacement: 192.168.0.100:9115
执行docker命令
docker pull prom/prometheus


docker run  -d ^
  -p 9090:9090 ^
  -v d:/server/prometheus_grafana/prometheus.yml:/etc/prometheus/prometheus.yml  ^
  prom/prometheus
访问http://localhost:9090/出现界面即可;
docker安装grafana
在路径D:\server\prometheus_grafana\grafana创建文件夹;
  docker pull grafana/grafana

  docker run -d ^
  -p 3000:3000 ^
  --name=grafana ^
  -v d:/server/prometheus_grafana/grafana:/var/lib/grafana ^
  grafana/grafana
访问http://localhost:3000/默认用户名密码admin,admin登录即可;
windows安装windows_exporter
下载地址: https://github.com/prometheus-community/windows_exporter/releases
进入对应的文件位置进入终端:
.\windows_exporter-0.20.0-386.exe --telemetry.addr ":9100"
访问http://localhost:9100/metrics出现数据即可;
prometheus配置新增windows_exporter的job,
# my global config
global:
  scrape_interval: 15s # Set the scrape interval to every 15 seconds. Default is every 1 minute.
  evaluation_interval: 15s # Evaluate rules every 15 seconds. The default is every 1 minute.
  # scrape_timeout is set to the global default (10s).

# Alertmanager configuration
alerting:
  alertmanagers:
    - static_configs:
        - targets:
          # - alertmanager:9093

# Load rules once and periodically evaluate them according to the global 'evaluation_interval'.
rule_files:
# - "first_rules.yml"
# - "second_rules.yml"

# A scrape configuration containing exactly one endpoint to scrape:
# Here it's Prometheus itself.
scrape_configs:
  # The job name is added as a label `job=<job_name>` to any timeseries scraped from this config.
  - job_name: "prometheus"

    # metrics_path defaults to '/metrics'
    # scheme defaults to 'http'.

    static_configs:
      - targets: ["localhost:9090"]
  - job_name: 'http_status'
    scheme: http
    params:
      module: [http_2xx]
    static_configs:
      - targets: ['https://baidu.com']
        labels:
          instance: baidu.com
          group: web
    relabel_configs:
      - source_labels: [__address__]
        target_label: __param_target
      - target_label: __address__
        replacement: 192.168.0.100:9115
  - job_name: "windows"
    scheme: http
    static_configs:
      - targets:
        - 192.168.68.124:9100
注意将192.168.68.124:9100换成你自己的ip,不能写localhost,或者127.0.0.1,只能写自己的局域网ip
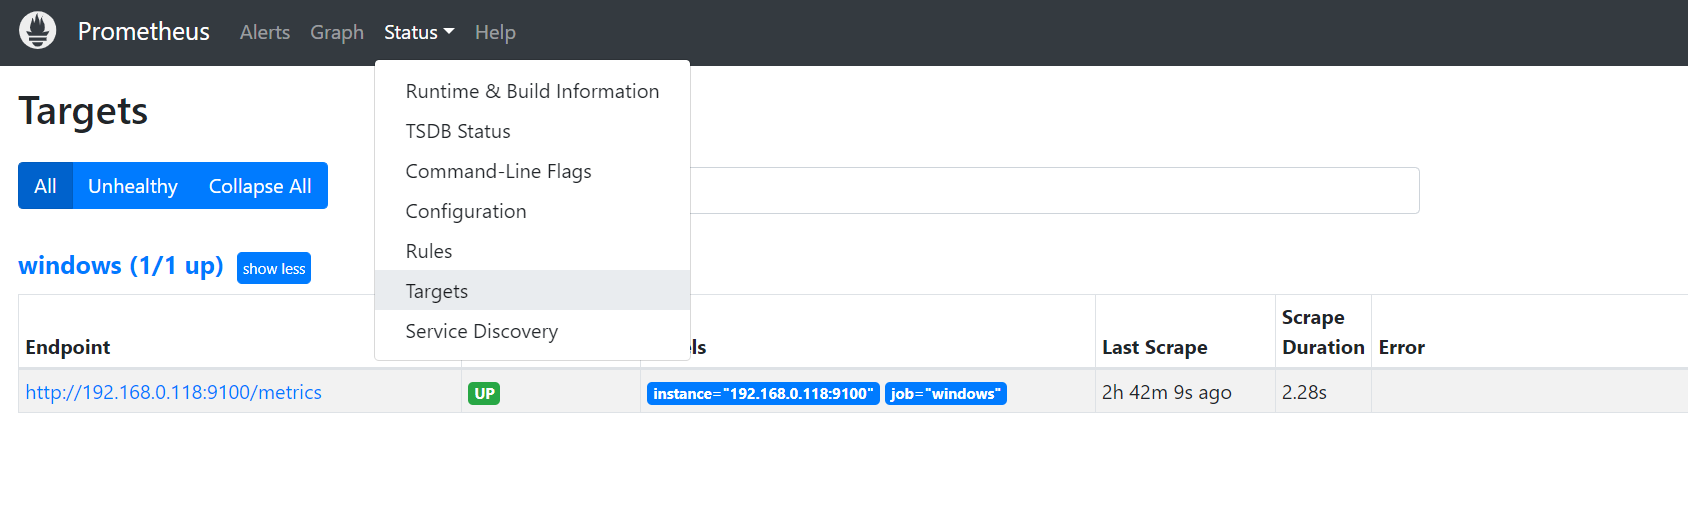
重启prometheus,访问targets看到windows UP
表示成功;
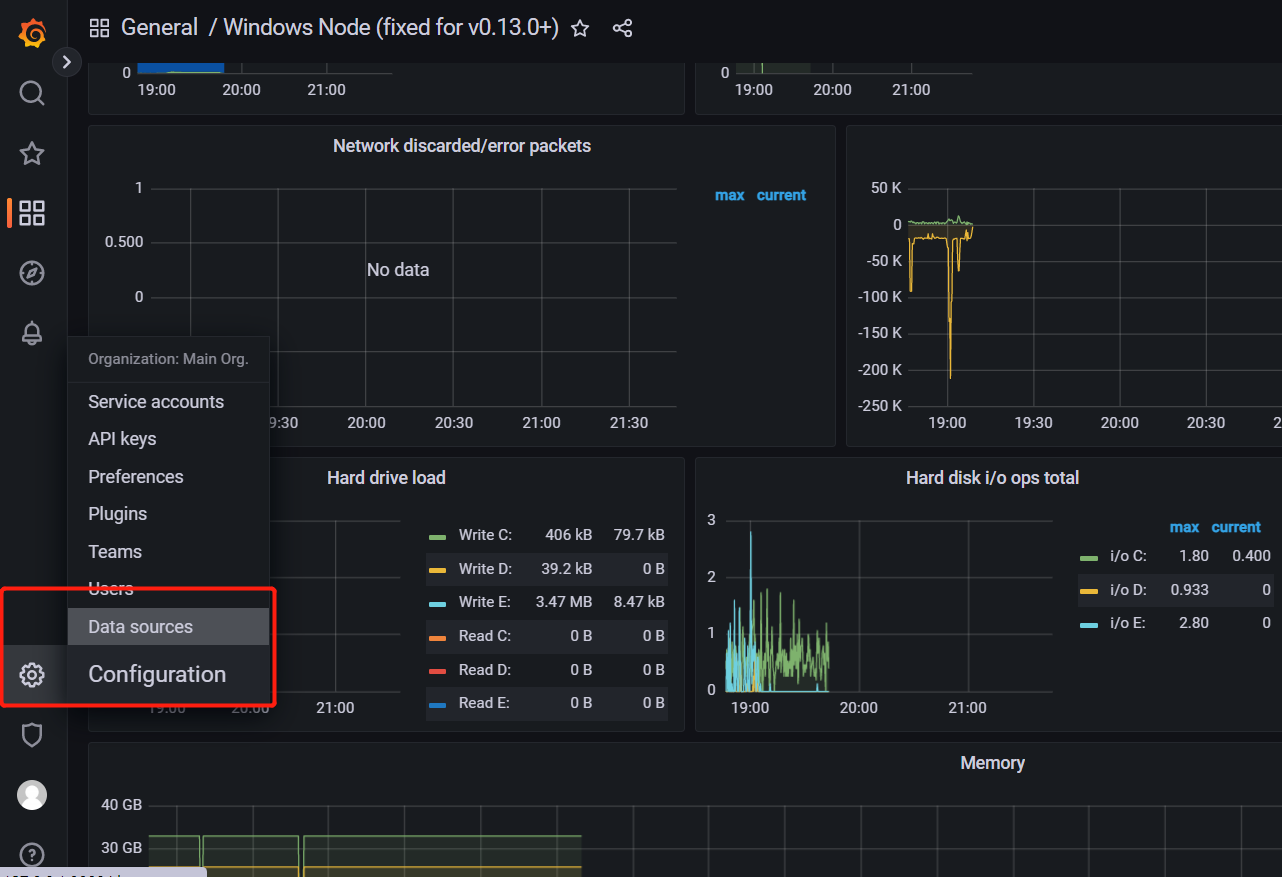
配置grafana
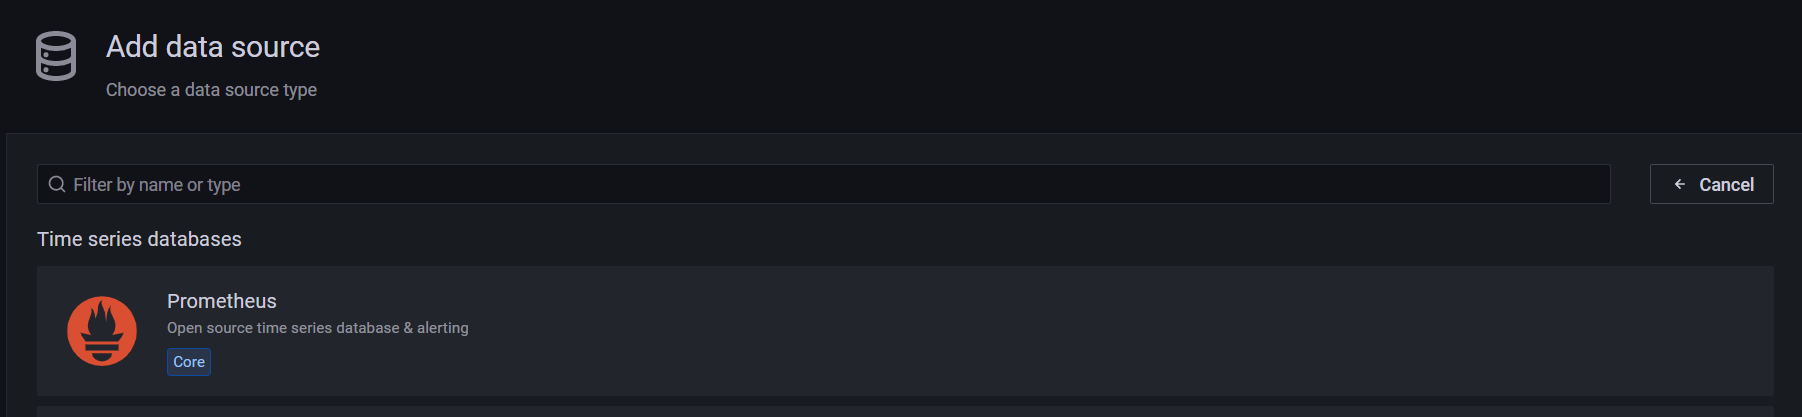
新增datasource,prometheus:
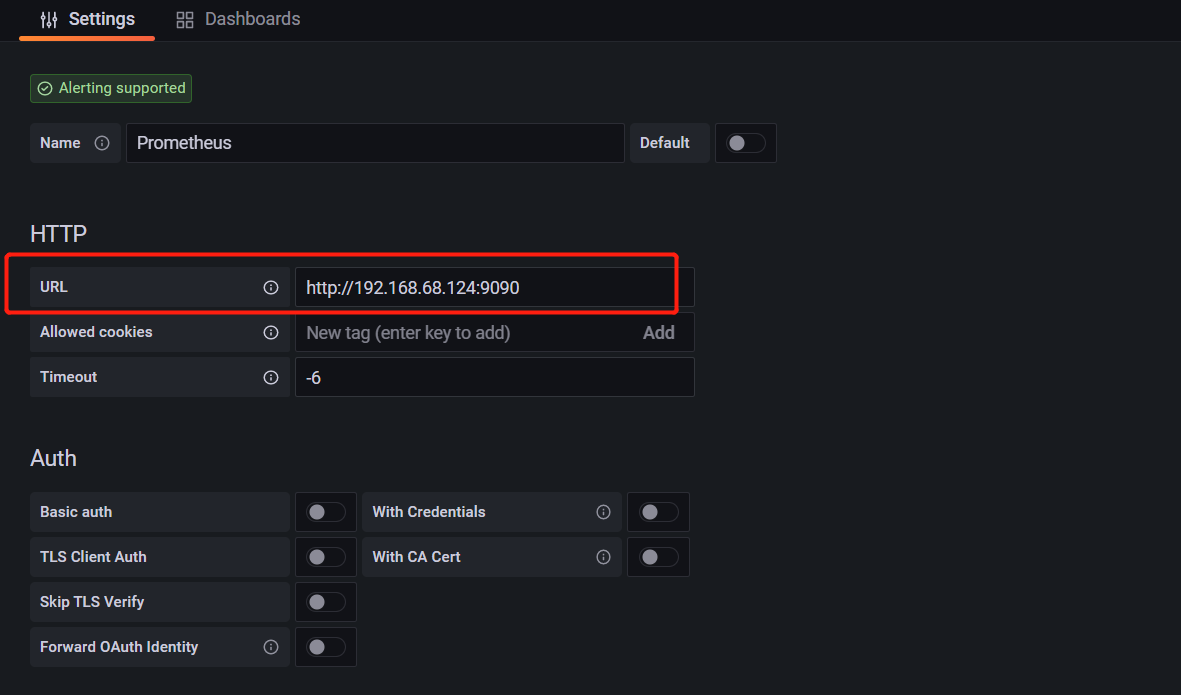
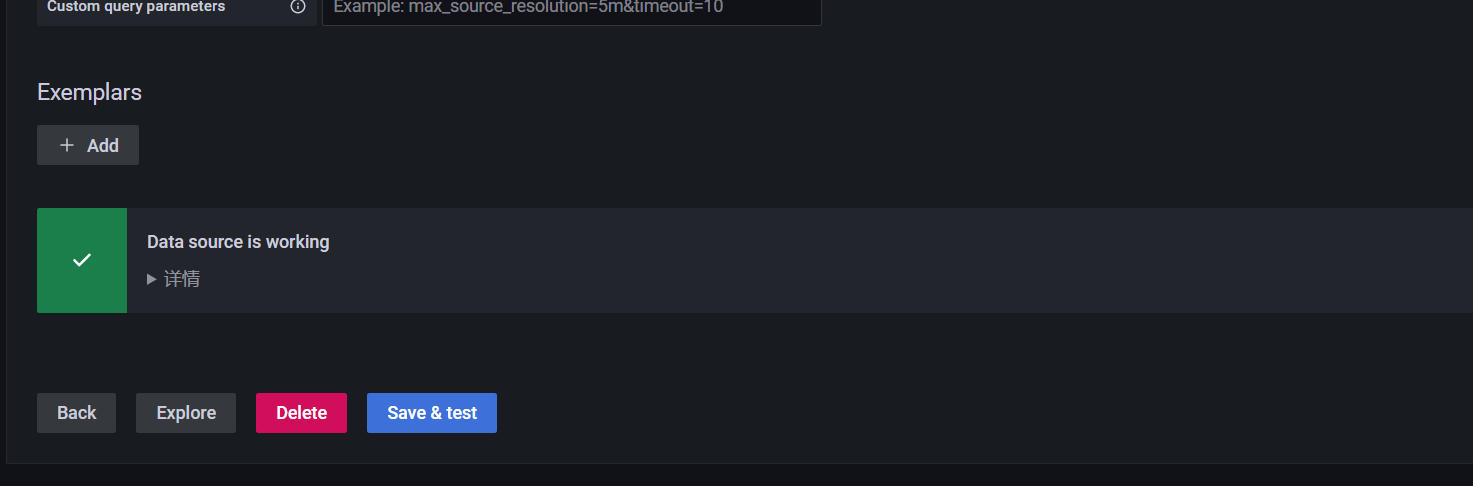
配置个url即可记得配置本机ip,不能配置127.0.0.1,或者localhost,我是docker安装的默认桥接模式网络,然后save&test即可
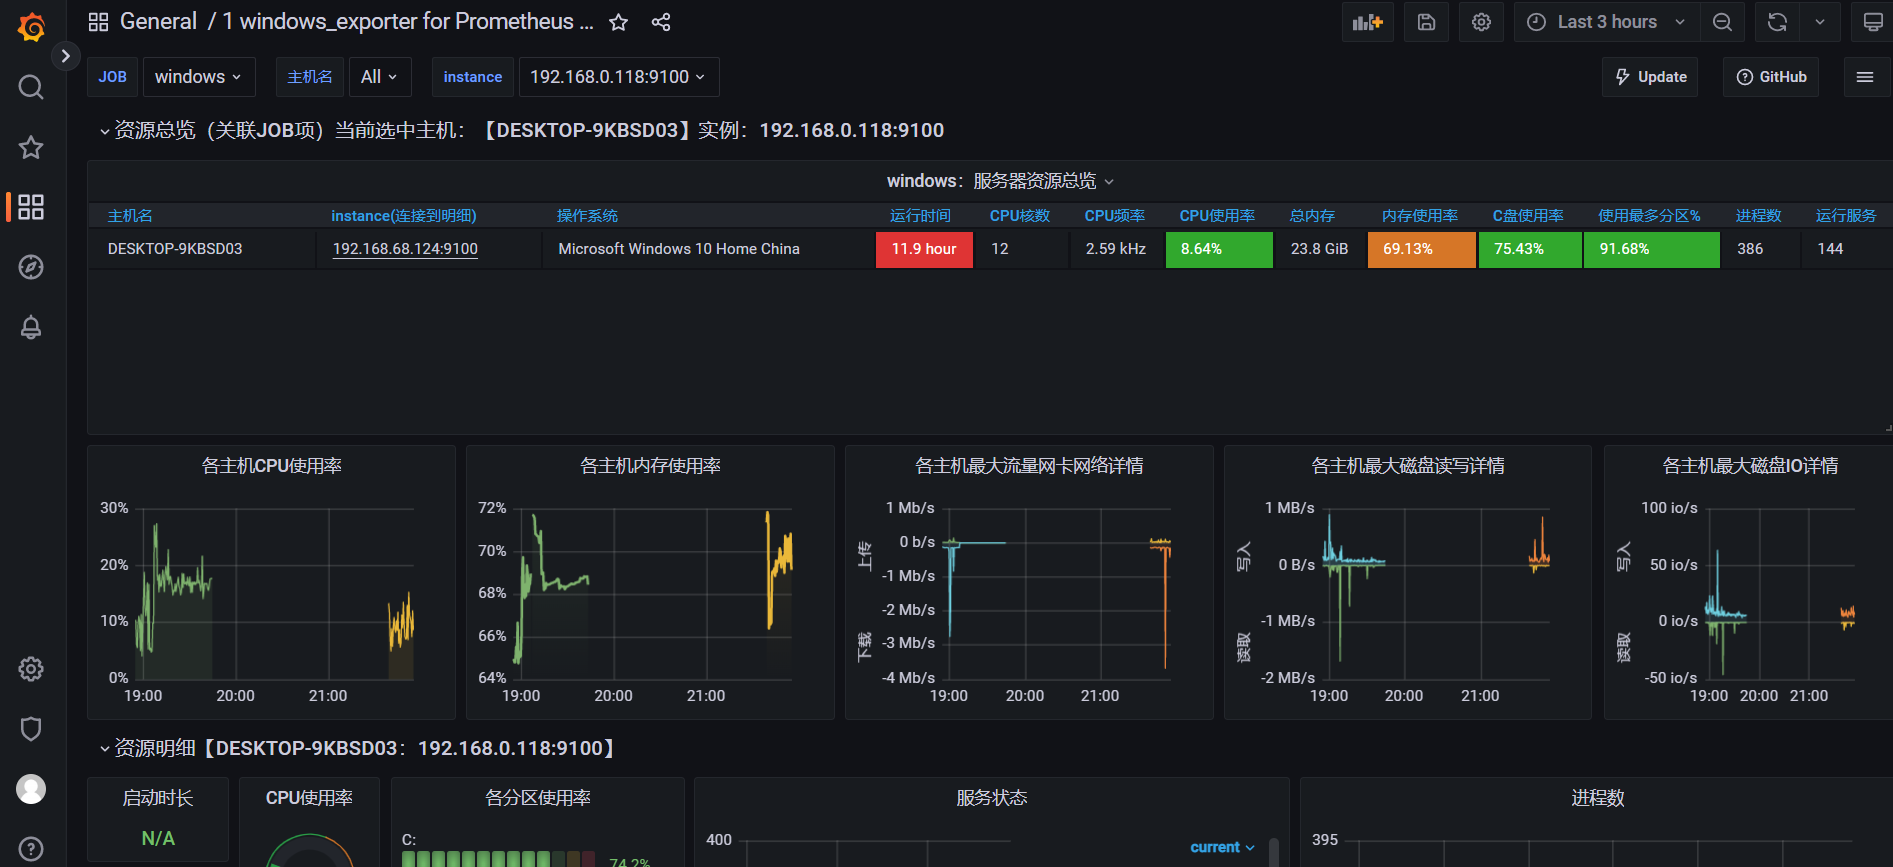
导入windows模板即可出现酷炫大屏
https://grafana.com/grafana/dashboards/?search=windows
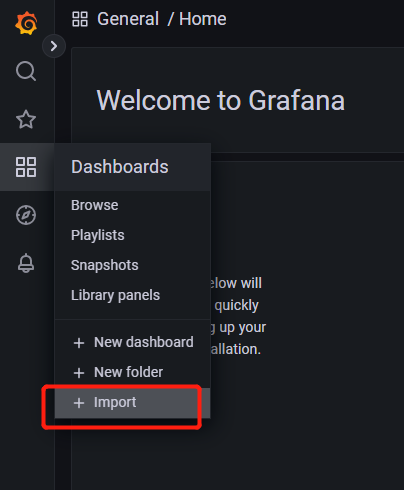
复制模板id即可,推荐id:12422;10467
出现酷炫画面完成