交易中的异常检测意味着识别交易或相关活动中的异常或意外模式。这些模式被称为异常或异常值,明显偏离预期规范,可能表明存在不规则或欺诈行为。
异常检测在各种业务中发挥着至关重要的作用,尤其是那些涉及金融交易、在线活动和安全敏感操作的业务。
我们可以遵循系统化的流程来应对异常检测的挑战。我们可以从收集和准备交易数据开始,确保其准确性和一致性。然后,我们可以在数据中寻找特定的模式来发现异常,并使用专门的异常检测算法(例如孤立森林)来检测异常。
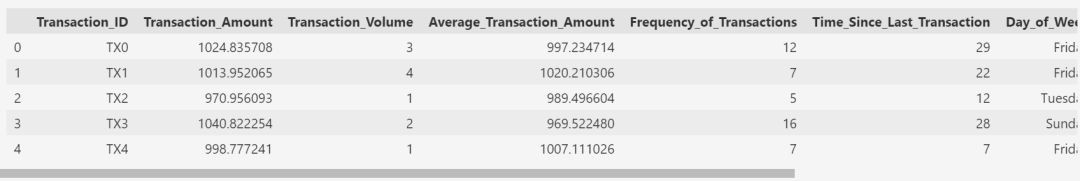
首先,还是引入相关包和加载数据集。
import pandas as pdimport plotly.express as pxfrom sklearn.model_selection import train_test_splitfrom sklearn.ensemble import IsolationForestfrom sklearn.metrics import classification_reportdata = pd.read_csv("../data/transaction_anomalies_dataset.csv")data.head()
现在,看一下数据中是否有空值,null:
data.isnull().sum()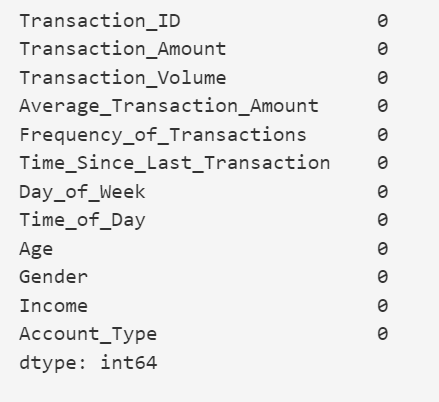
继续下一步之前,还需要看一下每个列的基本信息:
data.info()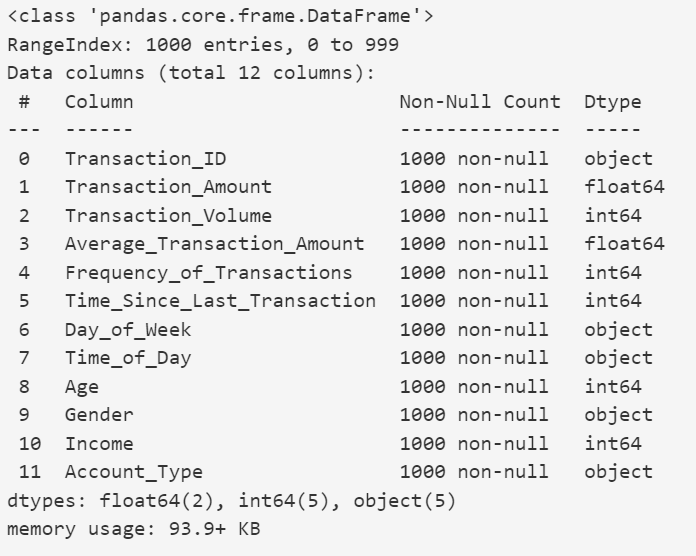
以及每个列的基本统计数据:
data.describe()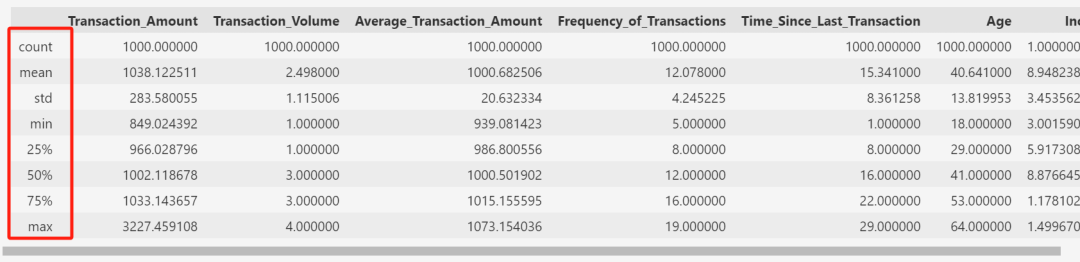
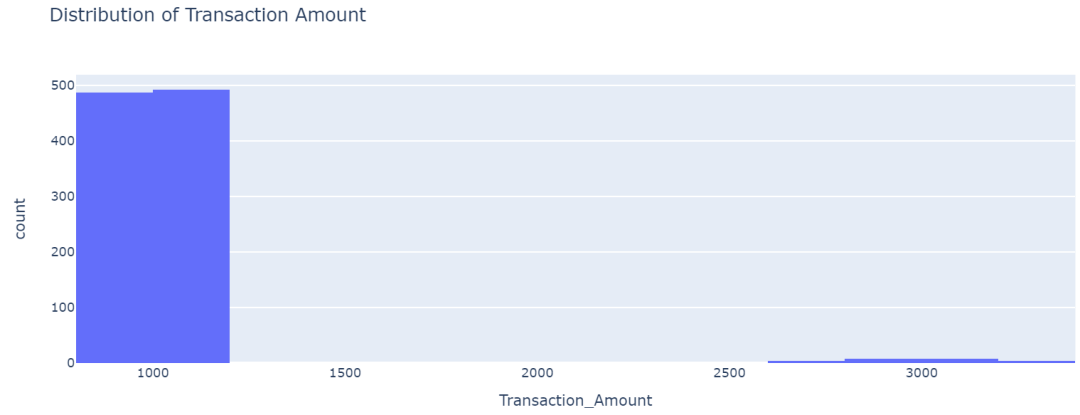
现在我们看一下数据中交易金额的分布:
fig_amount = px.histogram(data, x='Transaction_Amount',nbins=20,title='Distribution of Transaction Amount')fig_amount.show()
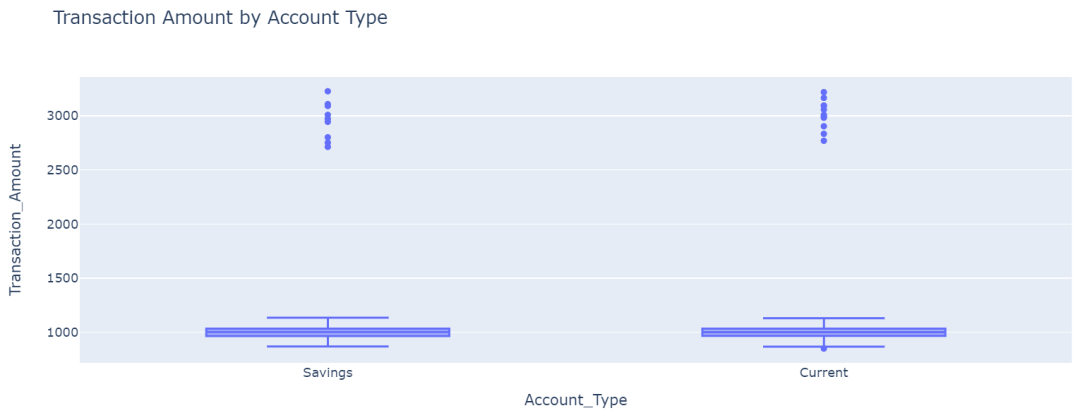
现在我们看一下不同账户类型的交易金额分布:
fig_box_amount = px.box(data,x='Account_Type',y='Transaction_Amount',title='Transaction Amount by Account Type')fig_box_amount.show()
现在让我们看看按年龄划分的平均交易金额:
fig_scatter_avg_amount_age = px.scatter(data, x='Age',y='Average_Transaction_Amount',color='Account_Type',title='Average Transaction Amount vs. Age',trendline='ols')fig_scatter_avg_amount_age.show()
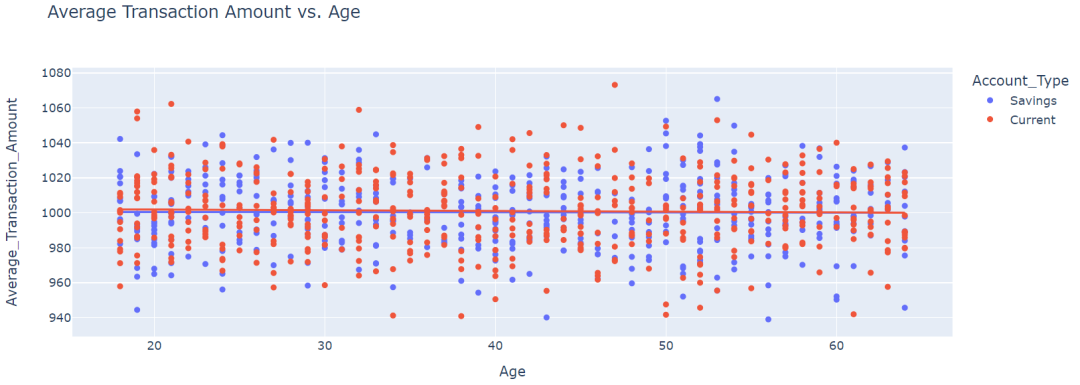
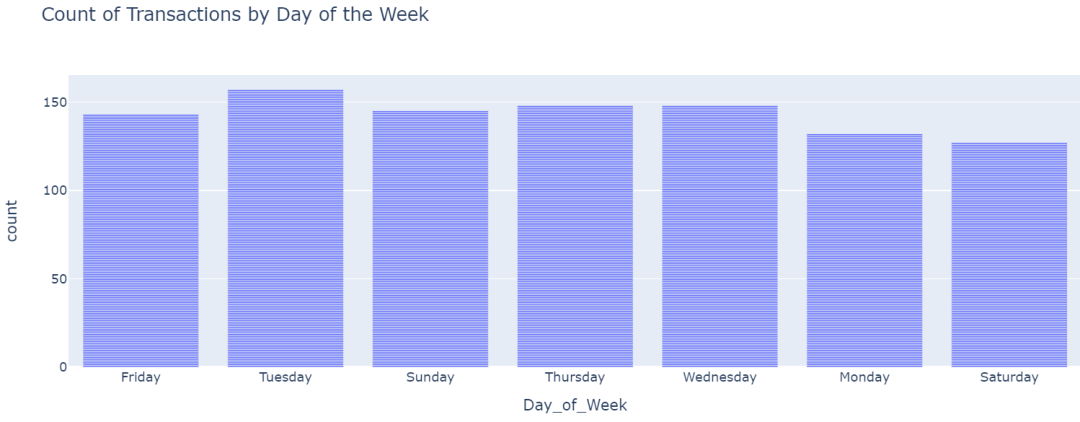
按年龄划分的平均交易金额没有差异。现在让我们看一下一周中各天的交易数量:
fig_day_of_week = px.bar(data, x='Day_of_Week',title='Count of Transactions by Day of the Week')fig_day_of_week.show()
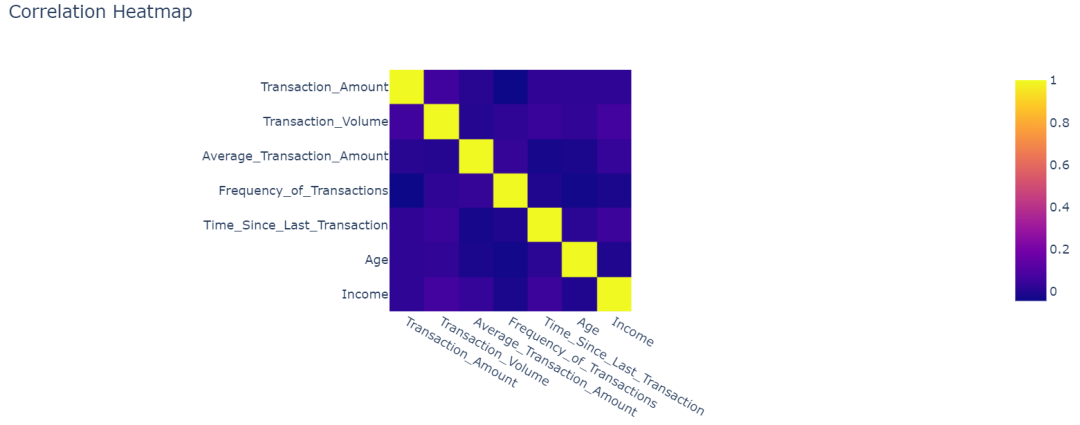
现在让我们看一下数据中一些交易相关的列之间的相关性:
correlation_matrix = data[['Transaction_Amount','Transaction_Volume','Average_Transaction_Amount','Frequency_of_Transactions','Time_Since_Last_Transaction','Age','Income']].corr()fig_corr_heatmap = px.imshow(correlation_matrix,title='Correlation Heatmap')fig_corr_heatmap.show()
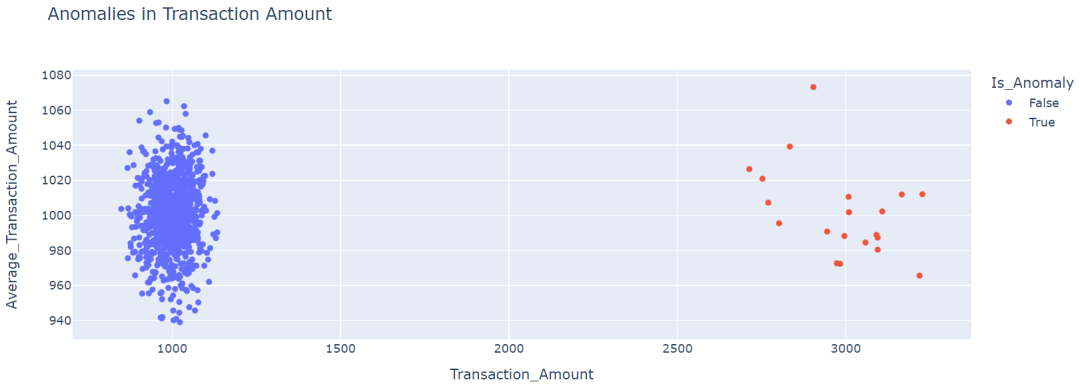
现在我们可以通过以下方式可视化数据中的异常情况:
# Calculate mean and standard deviation of Transaction Amountmean_amount = data['Transaction_Amount'].mean()std_amount = data['Transaction_Amount'].std()# Define the anomaly threshold (2 standard deviations from the mean)anomaly_threshold = mean_amount + 2 * std_amount# Flag anomaliesdata['Is_Anomaly'] = data['Transaction_Amount'] > anomaly_threshold# Scatter plot of Transaction Amount with anomalies highlightedfig_anomalies = px.scatter(data, x='Transaction_Amount', y='Average_Transaction_Amount',color='Is_Anomaly', title='Anomalies in Transaction Amount')fig_anomalies.update_traces(marker=dict(size=12),selector=dict(mode='markers', marker_size=1))fig_anomalies.show()
现在,我们可以计算数据中的异常数量,从而找出数据中异常的比例,这在使用孤立森林等异常检测算法时非常有用:
num_anomalies = data['Is_Anomaly'].sum()# Calculate the total number of instances in the datasettotal_instances = data.shape[0]# Calculate the ratio of anomaliesanomaly_ratio = num_anomalies / total_instancesprint(anomaly_ratio) # should be 0.2
现在我们可以训练机器学习模型来检测异常:
relevant_features = ['Transaction_Amount','Average_Transaction_Amount','Frequency_of_Transactions']# Split data into features (X) and target variable (y)X = data[relevant_features]y = data['Is_Anomaly']# Split data into train and test setsX_train, X_test, y_train, y_test = train_test_split(X, y, test_size=0.2, random_state=42)# Train the Isolation Forest modelmodel = IsolationForest(contamination=0.02, random_state=42)model.fit(X_train)
在这里,我们使用孤立森林算法训练异常检测模型。
首先,我们选择相关特征进行检测,即Transaction_Amount、Average_Transaction_Amount和Frequency_of_Transactions。
我们将数据集分为特征 (X) 和目标变量 (y),其中 X 包含选定的特征,y 包含指示实例是否异常的二进制标签。然后,我们使用 80-20 的分割比率将数据进一步分割为训练集和测试集。接下来,我们创建了一个孤立森林模型,其指定的污染参数为 0.02(表示预期的异常比率)和用于再现性的随机种子。然后在训练集 (X_train) 上训练模型。
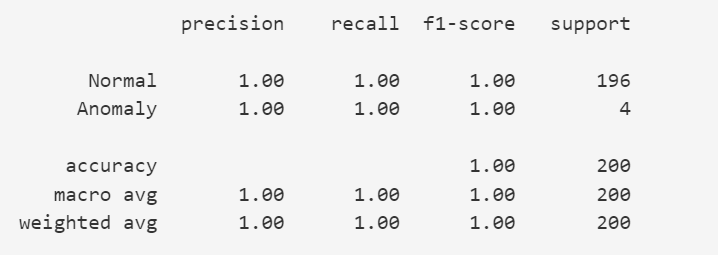
现在我们来看看这个异常检测模型的性能:
# Predict anomalies on the test sety_pred = model.predict(X_test)# Convert predictions to binary values (0: normal, 1: anomaly)y_pred_binary = [1 if pred == -1 else 0 for pred in y_pred]# Evaluate the model's performancereport = classification_report(y_test, y_pred_binary, target_names=['Normal', 'Anomaly'])print(report)
最后,我们使用经过训练的模型来检测异常:
# Relevant features used during trainingrelevant_features = ['Transaction_Amount', 'Average_Transaction_Amount', 'Frequency_of_Transactions']# Get user inputs for featuresuser_inputs = []for feature in relevant_features:user_input = float(input(f"Enter the value for '{feature}': "))user_inputs.append(user_input)# Create a DataFrame from user inputsuser_df = pd.DataFrame([user_inputs], columns=relevant_features)# Predict anomalies using the modeluser_anomaly_pred = model.predict(user_df)# Convert the prediction to binary value (0: normal, 1: anomaly)user_anomaly_pred_binary = 1 if user_anomaly_pred == -1 else 0if user_anomaly_pred_binary == 1:print("Anomaly detected: This transaction is flagged as an anomaly.")else:print("No anomaly detected: This transaction is normal.")
数据集和代码位于:
https://github.com/realyinchen/MachineLearning