Java技术体系方向-JVM虚拟机参数调优原理
- 内容简介
- 栈上分配与逃逸分析
- 逃逸分析(Escape Analysis)
- 栈上分配
- 基本思想
- 使用场景
- 线程私有对象
- 虚拟机内存逻辑图
- JVM内存分配源码:
- 代码总体逻辑
- 在某些场景使用栈上分配
- 设置JVM运行参数:
- 开启逃逸模式,关闭TLAB
- 运行结果
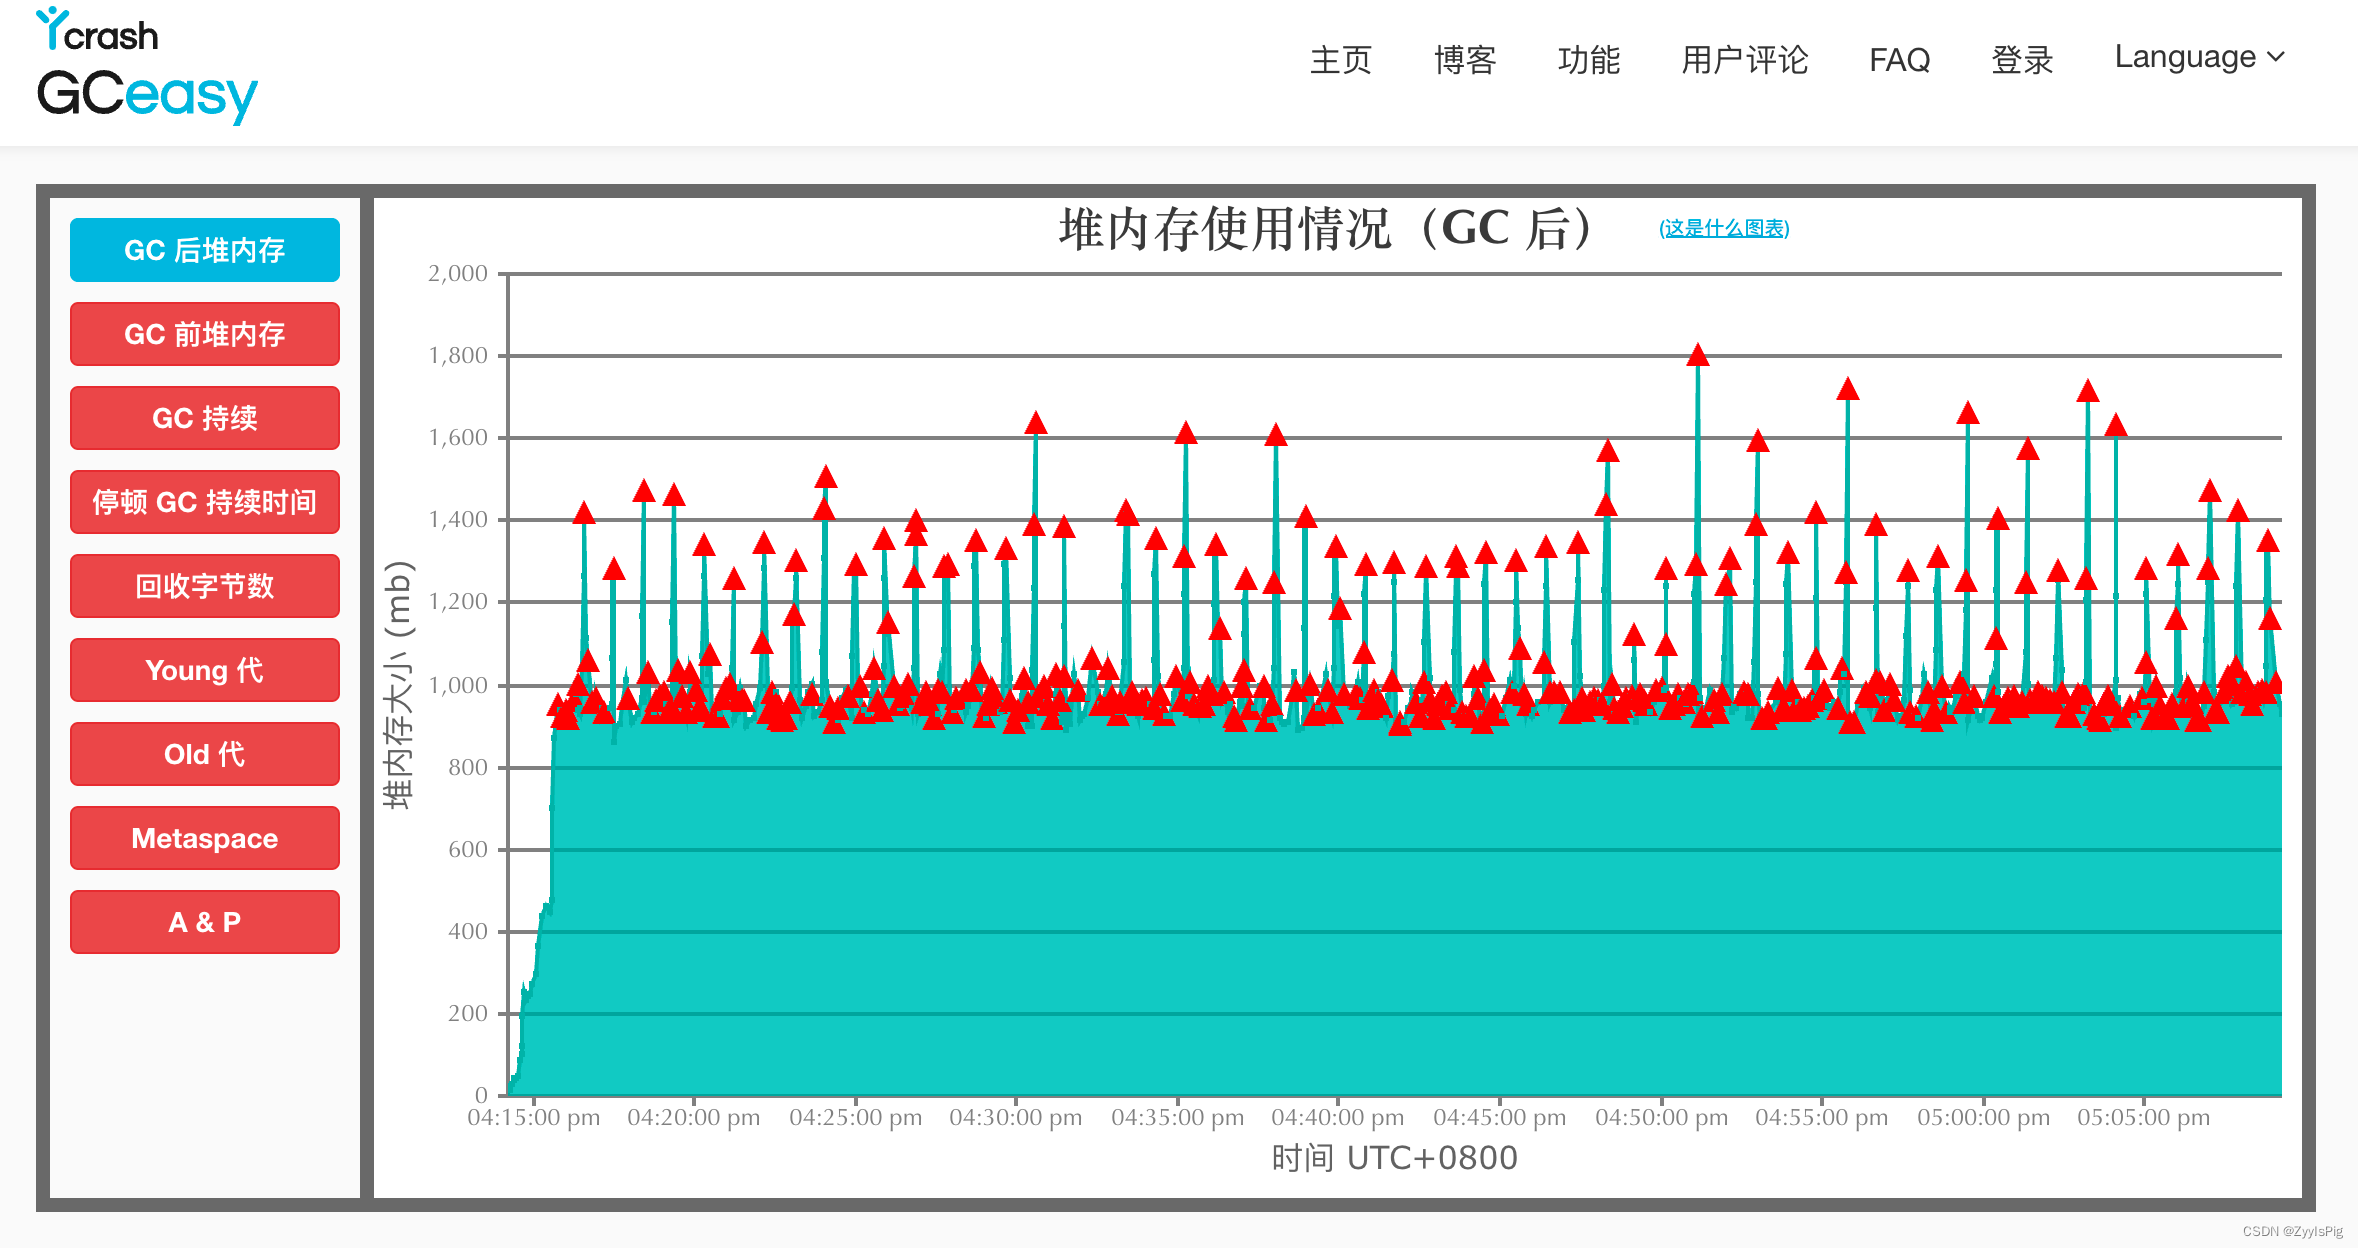
- 查看内存使用情况:
- 结论
- 调整JVM运行参数
- 关闭逃逸模式,开启TLAB
- 查看内存使用情况:
- 运行结果
- 结论
- 调整JVM运行参数
- 关闭逃逸,关闭TLAB
- 运行结果
- 查看内存使用情况:
- 运行结果对比
- 调整分配空间大小
- 运行结果
- 经过对比得出结论:
- TLAB的基本介绍
- TLAB(Thread Local Allocation Buffer)
- 特点
- 开启TLAB的参数
- TLAB的源码
- TLAB的数据结构
- 分配规则
- 指针碰撞&Eden区分配
- 运行结果
- G1垃圾回收过程
- 触发混合回收条件:
- 混合回收范围:
- 混合回收过程:
- 初始标记:
- 并发标记
- 最终标记:
- 混合回收:
- 混合回收失败时:
内容简介
本文主要针对于综合层面上进行分析JVM优化方案总结和列举调优参数计划。主要包含:
- 调优之逃逸分析(栈上分配)
- 调优之线程局部缓存(TLAB)
- 调优之G1回收器
栈上分配与逃逸分析
-XX:+DoEscapeAnalysis
逃逸分析(Escape Analysis)
逃逸分析的基本行为就是分析对象动态作用域:当一个对象在方法中被定义后,它可能被外部方法所引用,称为方法逃逸。
方法逃逸的几种方式如下:
public class EscapeTest {

	public static Object obj;

    // 给全局变量赋值,发生逃逸
    public void globalVariableEscape() {
        obj = new Object();
    }

    // 方法返回值,发生逃逸
    public Object methodEscape() {
        return new Object();
    }

    // 实例引用发生逃逸
    public void instanceEscape() {
        test(this);
    }
}
栈上分配
栈上分配是Java虚拟机提供的一种优化技术
基本思想
“对于那些线程私有的对象(指的是不可能被其他线程访问的对象),可以将它们直接分配在栈上,而不是分配在堆上”。
分配在栈上的好处:可以在函数调用结束后自行销毁,而不需要垃圾回收器的介入,减轻GC压力,从而提升系统的性能。
使用场景
线程私有对象
-
受虚拟机栈空间的约束,适用小对象,大对象无法触发虚拟机栈上分配。
-
线程私有变量,大对象虚拟机会分配到TLAB中,TLAB(Thread Local Allocation Buffer)
-
在栈上分配该对象的内存,当栈帧从Java虚拟机栈中弹出,就自动销毁这个对象。减小垃圾回收器压力。
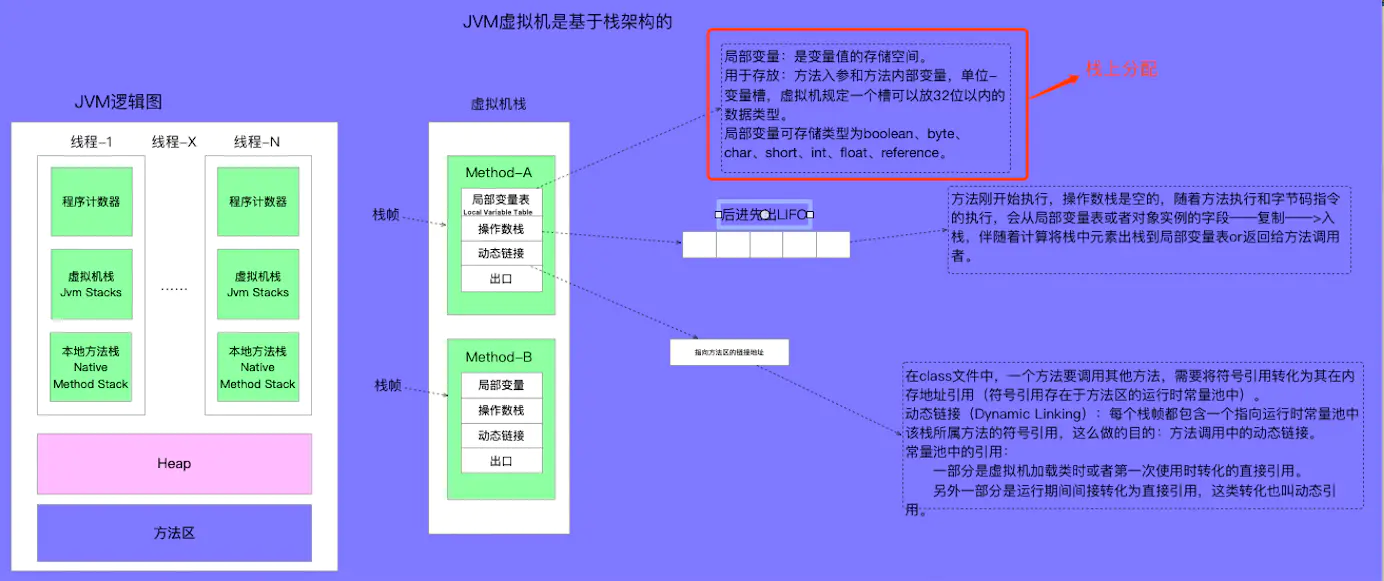
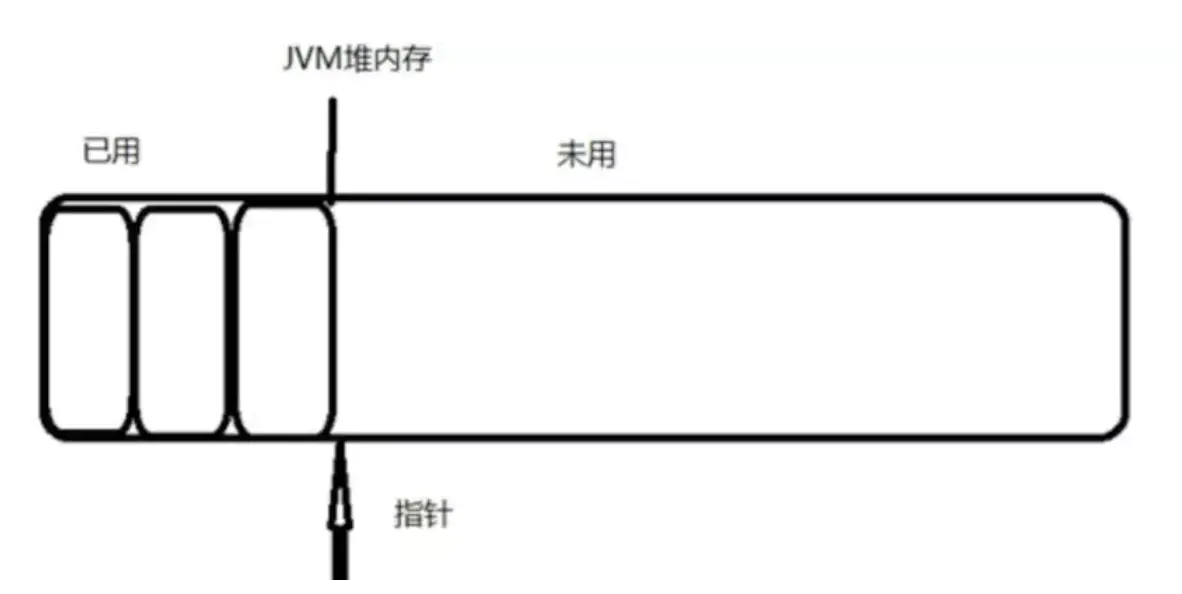
虚拟机内存逻辑图
JVM内存分配源码:
new关键字直接进行分配内存机制,源码如下:
CASE(_new): {
        u2 index = Bytes::get_Java_u2(pc+1);
        ConstantPool* constants = istate->method()->constants();
        // 如果目标Java类已经解析
        if (!constants->tag_at(index).is_unresolved_klass()) {
          // Make sure klass is initialized and doesn't have a finalizer
          Klass* entry = constants->slot_at(index).get_klass();
          assert(entry->is_klass(), "Should be resolved klass");
          Klass* k_entry = (Klass*) entry;
          assert(k_entry->oop_is_instance(), "Should be InstanceKlass");
          InstanceKlass* ik = (InstanceKlass*) k_entry;
          // 如果符合快速分配场景
          if ( ik->is_initialized() && ik->can_be_fastpath_allocated() ) {
            size_t obj_size = ik->size_helper();
            oop result = NULL;
            // If the TLAB isn't pre-zeroed then we'll have to do it
            bool need_zero = !ZeroTLAB;
            if (UseTLAB) {
              result = (oop) THREAD->tlab().allocate(obj_size);
            }
            // 如果TLAB分配失败,就在Eden区分配
            if (result == NULL) {
              need_zero = true;
              // Try allocate in shared eden
        retry:
              // 指针碰撞分配
              HeapWord* compare_to = *Universe::heap()->top_addr();
              HeapWord* new_top = compare_to + obj_size;
              if (new_top <= *Universe::heap()->end_addr()) {
                if (Atomic::cmpxchg_ptr(new_top, Universe::heap()->top_addr(), compare_to) != compare_to) {
                  goto retry;
                }
                result = (oop) compare_to;
              }
            }
            if (result != NULL) {
              // Initialize object (if nonzero size and need) and then the header
              // TLAB区清零
              if (need_zero ) {
                HeapWord* to_zero = (HeapWord*) result + sizeof(oopDesc) / oopSize;
                obj_size -= sizeof(oopDesc) / oopSize;
                if (obj_size > 0 ) {
                  memset(to_zero, 0, obj_size * HeapWordSize);
                }
              }
              if (UseBiasedLocking) {
                result->set_mark(ik->prototype_header());
              } else {
                result->set_mark(markOopDesc::prototype());
              }
              result->set_klass_gap(0);
              result->set_klass(k_entry);
              // 将对象地址压入操作数栈栈顶
              SET_STACK_OBJECT(result, 0);
              // 更新程序计数器PC,取下一条字节码指令,继续处理
              UPDATE_PC_AND_TOS_AND_CONTINUE(3, 1);
            }
          }
        }
        // Slow case allocation
        // 慢分配
        CALL_VM(InterpreterRuntime::_new(THREAD, METHOD->constants(), index),
                handle_exception);
        SET_STACK_OBJECT(THREAD->vm_result(), 0);
        THREAD->set_vm_result(NULL);
        UPDATE_PC_AND_TOS_AND_CONTINUE(3, 1);
      }
代码总体逻辑
JVM再分配内存时,总是优先使用快分配策略,当快分配失败时,才会启用慢分配策略。
- 如果Java类没有被解析过,直接进入慢分配逻辑。
- 快速分配策略,如果没有开启栈上分配或者不符合条件则会进行TLAB分配。
- 快速分配策略,如果TLAB分配失败,则尝试Eden区分配。
- 如果Eden区分配失败,则进入慢分配策略。
- 如果对象满足直接进入老年代的条件,那就直接进入老年代分配。
- 快速分配,对于热点代码,如果开启逃逸分析,JVM自会执行栈上分配或者标量替换等优化方案。
在某些场景使用栈上分配
设置JVM运行参数:
-Xmx10m -Xms10m -XX:+DoEscapeAnalysis -XX:-UseTLAB -XX:+PrintGC
开启逃逸模式,关闭TLAB
/**
 * @description 开启逃逸模式,关闭线程本地缓存模式(TLAB)(jdk1.8默认开启)
 * -Xmx10m -Xms10m    -XX:+DoEscapeAnalysis  -XX:-UseTLAB  -XX:+PrintGC
 */
public class AllocationOnStack {

    public static void main(String[] args) throws InterruptedException {
        long start = System.currentTimeMillis();
        for (int index = 0; index < 100000000; index++) {
            allocate();
        }
        long end = System.currentTimeMillis();
        System.out.println((end - start)+" ms");
        Thread.sleep(1000*1000);
        // 看后台堆情况,来佐证关闭逃逸优化后,是走的堆分配。
    }
    public static void allocate() {
        byte[] bytes = new byte[2];
        bytes[0] = 1;
        bytes[1] = 1;
    }
}
运行结果
[GC (Allocation Failure)  2048K->520K(9728K), 0.0008938 secs]
[GC (Allocation Failure)  2568K->520K(9728K), 0.0006386 secs]
6 ms
jstat -gc pid
查看内存使用情况:

结论
看出栈上分配机制的速度非常快,只需要6ms就完成了实现GC
调整JVM运行参数
关闭逃逸模式,开启TLAB
-Xmx10m -Xms10m -XX:-DoEscapeAnalysis -XX:+UseTLAB -XX:+PrintGC
查看内存使用情况:

运行结果
[GC (Allocation Failure)  2048K->504K(9728K), 0.0013831 secs]
[GC (Allocation Failure)  2552K->512K(9728K), 0.0010576 secs]
[GC (Allocation Failure)  2560K->400K(9728K), 0.0022408 secs]
[GC (Allocation Failure)  2448K->448K(9728K), 0.0006095 secs]
[GC (Allocation Failure)  2496K->416K(9728K), 0.0010540 secs]
[GC (Allocation Failure)  2464K->464K(8704K), 0.0007620 secs]
[GC (Allocation Failure)  1488K->381K(9216K), 0.0007714 secs]
[GC (Allocation Failure)  1405K->381K(9216K), 0.0004409 secs]
[GC (Allocation Failure)  1405K->381K(9216K), 0.0004725 secs]
.......
[GC (Allocation Failure)  2429K->381K(9728K), 0.0008293 secs]
[GC (Allocation Failure)  2429K->381K(9728K), 0.0009006 secs]
[GC (Allocation Failure)  2429K->381K(9728K), 0.0005553 secs]
[GC (Allocation Failure)  2429K->381K(9728K), 0.0005077 secs]
894 ms
结论
可以看出来,关闭了栈上分配后,不但YGC次数增加了,并且总体事件也变长了,总体事件894ms
调整JVM运行参数
-Xmx10m -Xms10m -XX:-DoEscapeAnalysis -XX:-UseTLAB -XX:+PrintGC
关闭逃逸,关闭TLAB
运行结果
[GC (Allocation Failure)  2048K->472K(9728K), 0.0007073 secs]
[GC (Allocation Failure)  2520K->528K(9728K), 0.0009216 secs]
[GC (Allocation Failure)  2576K->504K(9728K), 0.0005897 secs]
[GC (Allocation Failure)  2551K->424K(9728K), 0.0005780 secs]
[GC (Allocation Failure)  2472K->440K(9728K), 0.0006923 secs]
[GC (Allocation Failure)  2488K->456K(8704K), 0.0006277 secs]
[GC (Allocation Failure)  1480K->389K(9216K), 0.0005560 secs]
.......
[GC (Allocation Failure)  2437K->389K(9728K), 0.0003227 secs]
[GC (Allocation Failure)  2437K->389K(9728K), 0.0004264 secs]
[GC (Allocation Failure)  2437K->389K(9728K), 0.0004396 secs]
[GC (Allocation Failure)  2437K->389K(9728K), 0.0002773 secs]
[GC (Allocation Failure)  2437K->389K(9728K), 0.0002766 secs]
1718 ms
查看内存使用情况:

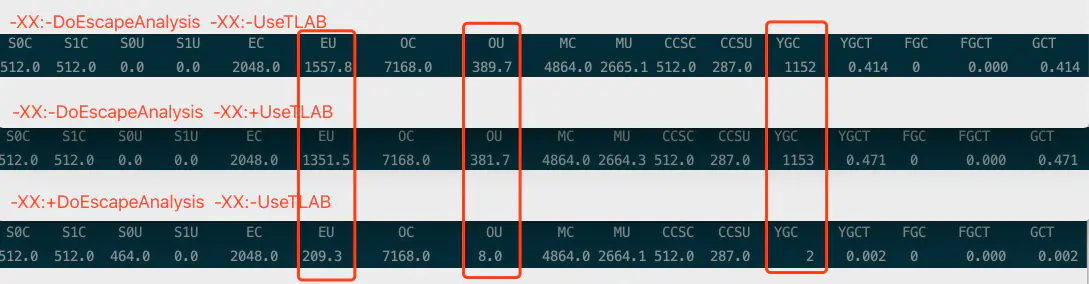
运行结果对比
- 运行耗时(开启逃逸 VS关闭逃逸(开启TLAB)VS关闭逃逸(关闭TLAB)):
6ms VS 894ms VS 1718ms - 虚拟机内存&回收(开启逃逸VS关闭逃逸):

调整分配空间大小
/**
 * @since 2019/8/13  上午6:55
 * -Xmx10m -Xms10m    -XX:-DoEscapeAnalysis -XX:+UseTLAB  -XX:+PrintCommandLineFlags -XX:+PrintGC
 */
public class AllocationOnStack {

    private static final int _1B =  65;

    public static void main(String[] args) throws InterruptedException {
        long start = System.currentTimeMillis();
        for (int index = 0; index < 100000000; index++) {
            allocateBigSpace();
        }
        long end = System.currentTimeMillis();
        System.out.println(end - start);
        Thread.sleep(1000*1000);
        // 看后台堆情况,来佐证关闭逃逸优化后,是走的堆分配。
    }

    public static void allocate() {
        byte[] bytes = new byte[2];
        bytes[0] = 1;
        bytes[1] = 1;
    }
    public static void allocateBigSpace() {
        byte[] allocation1;
        allocation1 = new byte[1 * _1B];
    }
}
运行结果
-XX:+DoEscapeAnalysis -XX:InitialHeapSize=5242880 -XX:MaxHeapSize=5242880 -XX:+PrintCommandLineFlags -XX:+PrintGC -XX:+UseCompressedClassPointers -XX:+UseCompressedOops -XX:+UseParallelGC -XX:-UseTLAB
[GC (Allocation Failure)  1023K->516K(5632K), 0.0028410 secs]
[GC (Allocation Failure)  1540K->578K(5632K), 0.0023265 secs]
........
[GC (Allocation Failure)  2466K->1442K(5632K), 0.0013395 secs]
[GC (Allocation Failure)  2466K->1442K(5632K), 0.0004367 secs]
8925
调整启动参数: -XX:+DoEscapeAnalysis -XX:-UseTLAB
运行结果:
-XX:+DoEscapeAnalysis -XX:InitialHeapSize=5242880 -XX:MaxHeapSize=5242880 -XX:+PrintCommandLineFlags -XX:+PrintGC -XX:+UseCompressedClassPointers -XX:+UseCompressedOops -XX:+UseParallelGC -XX:-UseTLAB
[GC (Allocation Failure)  1023K->516K(5632K), 0.0028410 secs]
[GC (Allocation Failure)  1540K->578K(5632K), 0.0023265 secs]
........
[GC (Allocation Failure)  2466K->1442K(5632K), 0.0013395 secs]
[GC (Allocation Failure)  2466K->1442K(5632K), 0.0004367 secs]
8925
经过对比得出结论:
分配内存为>64byte == -XX:-UseTLAB
经过多次测试发现当_1B=64b时效率还是非常高,一旦大于64b就会急剧下降。所以推断出64byte是JVM选择是TLAB分配 OR Eden区分配的临界值。
TLAB的基本介绍
TLAB(Thread Local Allocation Buffer)
线程本地分配缓存,这是一个线程独享的内存分配区域。
特点
-
TLAB解决了:直接在线程共享堆上安全分配带来的线程同步性能消耗问题(解决了指针碰撞)。
-
TLAB内存空间位于Eden区。
-
默认TLAB大小为占用Eden Space的1%。
开启TLAB的参数
- -XX:+UseTLAB
- -XX:+TLABSize
- -XX:TLABRefillWasteFraction
- -XX:TLABWasteTargetPercent
- -XX:+PrintTLAB
TLAB的源码
TLAB的数据结构
class ThreadLocalAllocBuffer: public CHeapObj<mtThread> {
  HeapWord* _start;                              // address of TLAB
  HeapWord* _top;                                // address after last allocation
  HeapWord* _pf_top;                             // allocation prefetch watermark
  HeapWord* _end;                                // allocation end (excluding alignment_reserve)
  size_t    _desired_size;                       // desired size   (including alignment_reserve)
  size_t    _refill_waste_limit;                 // hold onto tlab if free() is larger than this
}
- _start 指TLAB连续内存起始地址。
- _top 指TLAB当前分配到的地址。
- _end 指TLAB连续内存截止地址。
- _desired_size 是指TLAB的内存大小。
- _refill_waste_limit 是指最大的浪费空间。默认值为64b
eg:假设为_refill_waste_limit=5KB:
-
假如当前TLAB已经分配96KB,还剩下4KB可分配,但是现在new了一个对象需要6KB的空间,显然TLAB的内存不够了,4kb<5kb这时只浪费4KB的空间,在_refill_waste_limit之内,这时可以申请一个新的TLAB空间,原先的TLAB交给Eden管理。
-
假如当前TLAB已经分配90KB,还剩下10KB,现在new了一个对象需要11KB,显然TLAB的内存不够了,这时就不能简单的抛弃当前TLAB,这11KB会被安排到Eden区进行申请。
分配规则
-
obj_size + tlab_top <= tlab_end,直接在TLAB空间分配对象。
-
obj_size + tlab_top >= tlab_end && tlab_free > tlab_refill_waste_limit,
-
对象不在TLAB分配,在Eden区分配。(tlab_free:剩余的内存空间,tlab_refill_waste_limit:允许浪费的内存空间)
-
tlab剩余可用空间>tlab可浪费空间,当前线程不能丢弃当前TLAB,本次申请交由Eden区分配空间。
-
-
obj_size + tlab_top >= tlab_end && tlab_free < _refill_waste_limit,重新分配一块TLAB空间,在新的TLAB中分配对象。
- tlab剩余可用空间<tlab可浪费空间,在当前允许可浪费空间内,重新申请一个新TLAB空间,原TLAB交给Eden。
- 清单:/src/share/vm/memory/ThreadLocalAllocationBuffer.inline.hpp
- 功能:TLAB内存分配
inline HeapWord* ThreadLocalAllocBuffer::allocate(size_t size) {
  invariants();
  // 获取当前top
  HeapWord* obj = top();
  if (pointer_delta(end(), obj) >= size) {
    // successful thread-local allocation
#ifdef ASSERT
    // Skip mangling the space corresponding to the object header to
    // ensure that the returned space is not considered parsable by
    // any concurrent GC thread.
    size_t hdr_size = oopDesc::header_size();
    Copy::fill_to_words(obj + hdr_size, size - hdr_size, badHeapWordVal);
#endif // ASSERT
    // This addition is safe because we know that top is
    // at least size below end, so the add can't wrap.
    // 重置top
    set_top(obj + size);
    invariants();
    return obj;
  }
  return NULL;
}
实际上虚拟机内部会维护一个叫作refill_waste的值,当剩余对象空间大于refill_waste时,会选择在堆中分配,若小于该值,则会废弃当前TLAB,新建TLAB来分配对象。
这个阈值可以使用TLABRefillWasteFraction来调整,它表示TLAB中允许产生这种浪费的比例。
默认值为64,即表示使用约为1/64的TLAB空间作为refill_waste。
-
TLAB和refill_waste都会在运行时不断调整的,使系统的运行状态达到最优。
-
如果想要禁用自动调整TLAB的大小,可以使用-XX:-ResizeTLAB禁用ResizeTLAB
-
使用-XX:TLABSize手工指定一个TLAB的大小。
指针碰撞&Eden区分配
// 指针碰撞分配
HeapWord* compare_to = *Universe::heap()->top_addr();
HeapWord* new_top = compare_to + obj_size;
if (new_top <= *Universe::heap()->end_addr()) {
    if (Atomic::cmpxchg_ptr(new_top, Universe::heap()->top_addr(), compare_to) != compare_to) {
                  goto retry;
    }
    result = (oop) compare_to;
   }
}
Eden区指针碰撞,需要模拟多线程并发申请内存空间。
/**
 * @since 2019/8/19  下午11:25
-Xmx100m -Xms100m -XX:-DoEscapeAnalysis -XX:+UseTLAB
-XX:TLABWasteTargetPercent=1 -XX:+PrintCommandLineFlags  -XX:+PrintGCDetails
 */
public class AllocationTLABSomeThread {
    private static final int threadNum = 100;
    private static CountDownLatch latch = new CountDownLatch(threadNum);
    private static final int n = 50000000 / threadNum;

    private static void alloc() {
        byte[] b = new byte[100];
    }

    public static void main(String[] args) {
        long start = System.currentTimeMillis();
        for (int i = 0; i < threadNum; i++) {
            new Thread(() -> {
                for (int j = 0; j < n; j++) {
                    alloc();
                }
                latch.countDown();
            }).start();
        }
        try {
            latch.await();
        } catch (InterruptedException e) {
            System.out.println("hello world");
        }
        long end = System.currentTimeMillis();
        System.out.println(end - start);
    }

}
且需要关闭逃逸分析 -XX:-DoEscapeAnalysis -XX:+UseTLAB
运行结果
-XX:-DoEscapeAnalysis -XX:InitialHeapSize=104857600 -XX:MaxHeapSize=104857600 -XX:+PrintCommandLineFlags -XX:+PrintGCDetails -XX:TLABWasteTargetPercent=1 -XX:+UseCompressedClassPointers -XX:+UseCompressedOops -XX:+UseParallelGC -XX:+UseTLAB
[GC (Allocation Failure) [PSYoungGen: 25600K->960K(29696K)] 25600K->968K(98304K), 0.0019559 secs] [Times: user=0.01 sys=0.00, real=0.00 secs]
[GC (Allocation Failure) [PSYoungGen: 26560K->960K(29696K)] 26568K->968K(98304K), 0.0022243 secs] [Times: user=0.01 sys=0.00, real=0.00 secs]
[GC (Allocation Failure) [PSYoungGen: 26560K->768K(29696K)] 26568K->776K(98304K), 0.0022446 secs] [Times: user=0.00 sys=0.00, real=0.00 secs]
........
[GC (Allocation Failure) [PSYoungGen: 32768K->0K(33280K)] 34193K->1425K(101888K), 0.0014598 secs] [Times: user=0.01 sys=0.00, real=0.00 secs]
[GC (Allocation Failure) [PSYoungGen: 32768K->0K(33280K)] 34193K->1425K(101888K), 0.0015168 secs] [Times: user=0.00 sys=0.01, real=0.00 secs]
823
Heap
 PSYoungGen      total 33280K, used 3655K [0x00000007bdf00000, 0x00000007c0000000, 0x00000007c0000000)
  eden space 32768K, 11% used [0x00000007bdf00000,0x00000007be291c48,0x00000007bff00000)
  from space 512K, 0% used [0x00000007bff80000,0x00000007bff80000,0x00000007c0000000)
  to   space 512K, 0% used [0x00000007bff00000,0x00000007bff00000,0x00000007bff80000)
 ParOldGen       total 68608K, used 1425K [0x00000007b9c00000, 0x00000007bdf00000, 0x00000007bdf00000)
  object space 68608K, 2% used [0x00000007b9c00000,0x00000007b9d64798,0x00000007bdf00000)
 Metaspace       used 4255K, capacity 4718K, committed 4992K, reserved 1056768K
  class space    used 477K, capacity 533K, committed 640K, reserved 1048576K
关闭逃逸和TLAB分配 -XX:-DoEscapeAnalysis -XX:-UseTLAB 运行结果:
-XX:-DoEscapeAnalysis -XX:InitialHeapSize=104857600 -XX:MaxHeapSize=104857600 -XX:+PrintCommandLineFlags -XX:+PrintGCDetails -XX:TLABWasteTargetPercent=1 -XX:+UseCompressedClassPointers -XX:+UseCompressedOops -XX:+UseParallelGC -XX:-UseTLAB
[GC (Allocation Failure) [PSYoungGen: 25599K->976K(29696K)] 25599K->984K(98304K), 0.0023516 secs] [Times: user=0.01 sys=0.00, real=0.00 secs]
[GC (Allocation Failure) [PSYoungGen: 26575K->880K(29696K)] 26583K->888K(98304K), 0.0015459 secs] [Times: user=0.01 sys=0.00, real=0.00 secs]
[GC (Allocation Failure) [PSYoungGen: 26480K->832K(29696K)] 26488K->840K(98304K), 0.0006776 secs] [Times: user=0.00 sys=0.00, real=0.00 secs]
.......
[GC (Allocation Failure) [PSYoungGen: 32767K->0K(33280K)] 34053K->1285K(101888K), 0.0004838 secs] [Times: user=0.00 sys=0.00, real=0.00 secs]
[GC (Allocation Failure) [PSYoungGen: 32767K->0K(33280K)] 34053K->1285K(101888K), 0.0005389 secs] [Times: user=0.00 sys=0.00, real=0.01 secs]
5388
Heap
 PSYoungGen      total 33280K, used 21392K [0x00000007bdf00000, 0x00000007c0000000, 0x00000007c0000000)
  eden space 32768K, 65% used [0x00000007bdf00000,0x00000007bf3e4230,0x00000007bff00000)
  from space 512K, 0% used [0x00000007bff00000,0x00000007bff00000,0x00000007bff80000)
  to   space 512K, 0% used [0x00000007bff80000,0x00000007bff80000,0x00000007c0000000)
 ParOldGen       total 68608K, used 1285K [0x00000007b9c00000, 0x00000007bdf00000, 0x00000007bdf00000)
  object space 68608K, 1% used [0x00000007b9c00000,0x00000007b9d41788,0x00000007bdf00000)
 Metaspace       used 4248K, capacity 4718K, committed 4992K, reserved 1056768K
  class space    used 478K, capacity 533K, committed 640K, reserved 1048576K
经过对比,相差7倍左右。二者内存回收♻️,从YoungGC次数和耗时上没有太大变化:应为都是Eden区分配。
G1垃圾回收过程
触发混合回收条件:
-XX:InitiatingHeapOccupancyPercent=45 ,当老年代空间使用占整个堆空间45%时。
混合回收范围:
新生代、老年代、大对象。
混合回收过程:
初始标记:
-
这个过程会STW,停止系统线程。
-
标记GC-Roots的直接引用对象。
- 线程栈中局部变量表 。
- 方法区中的静态变量/常量等。
- 本地方法栈。
- 特点:速度极快。
并发标记
- 这个过程不会STW,系统线程正常运行。
- 从第一阶段标记的GC-Roots开始追踪所有存活对象。
- 特点:慢,很耗时。
- 优化:JVM会对“并发标记”阶段新产生的对象及对象修改做记录(RememberSet)
最终标记:
- 这个过程会STW,系统线程停止运行。
- 会根据“并发标记”阶段记录的RememberSet进行对象标记。
- 特点:很快。
- RememberSet相当于是拿空间换时间。
混合回收:
- 这个过程会STW,系统线程停止运行。
- 会计算老年代中每个Region中存活对象数量,存活对象占比,执行垃圾回收预期耗时和效率。
-
耗时:会根据启动参数中
-XX:MaxGCPauseMillis=200和历史回收耗时来计算本次要回收多少老年代Region才能耗时200ms。 -
特点:回收了一部分远远没有达到回收的效果,G1还有一个特殊处理方法,STW后进行回收,然后恢复系统线程,然后再次STW,执行混合回收掉一部分Region,
‐XX:G1MixedGCCountTarget=8(默认是8次),反复执行上述过程8次。
注意:假设要回收400个Region,如果受限200ms,每次只能回收50个Region,反复8次刚好全部回收完毕。这么做的好处是避免单次停顿回收STW时间太长。
-
**还有一个参数要提一下
‐XX:G1HeapWastePercent=5 (默认是5%)。- 混合回收是采用复制算法,把要回收的Region中存活的对象放入其他Region中。
- 然后这个Region中的垃圾全部清理掉,这样就会不断有Region释放出来,当释放出的Region占整个堆空间5%时,停止混合回收。
-
还有一个参数:
‐XX:G1MixedGCLiveThresholdPercent=85 (默认值85%)。回收Region的时候,必须是存活对象低于85%。
混合回收失败时:
-
在Mixed回收的时候,无论是年轻代还是老年代都是基于复制算法进行回收,都要把各个Region的存活对象拷贝到另外其他的Region里去,万一拷贝是发生空间不足,就会触发一次失败。
-
一旦回收失败,立马就会切换采用Serial 单线程进行标记+清理+整理,整个过程是非常慢的(灾难)。


![[Linux]HTTP状态响应码和示例](https://img-blog.csdnimg.cn/direct/836e694c716c4b6baddadb7099dbbeed.jpeg#pic_center)
![[笔记]Spring AOP](https://img-blog.csdnimg.cn/direct/0cf3aa4762f3404ab1fe16628520c1f3.png)