监控需求及常见工具
目标:了解服务器性能监控需求及常见监控工具
路径
- step1:监控需求
- step2:常见工具
实施
监控需求
- 问题:数据量越来越大,机器数量越来越多,如何保证所有服务器稳定的的运行,确保所有业务不掉线?
- 资源:CPU、内存、磁盘、网络
- 阈值:80%
- 解决:高效的监控系统可以对运维数据进行分析整理,将运维工作透明化可视化,方便运维人员及时找出问题,保障系统稳定运行,提高运维效率,满足不同业务需求,适用不同服务器场景,也是决定运维成本和效率的重要因素
- 需求
覆盖式监控:监控所有机器、所有服务的运行
统一监控内容:CPU、内存、磁盘、网络IO
分离告警和显示:实时的监控机器负载,程序运行,并针对不同业务实现不同方式的告警和报表
常见工具
zabbix
   基于WEB界面的提供分布式系统监视以及网络监视功能的企业级的开源解决方案
      zabbix能监视各种网络参数,保证服务器系统的安全运营
      提供灵活的通知机制以让系统管理员快速定位/解决存在的各种问题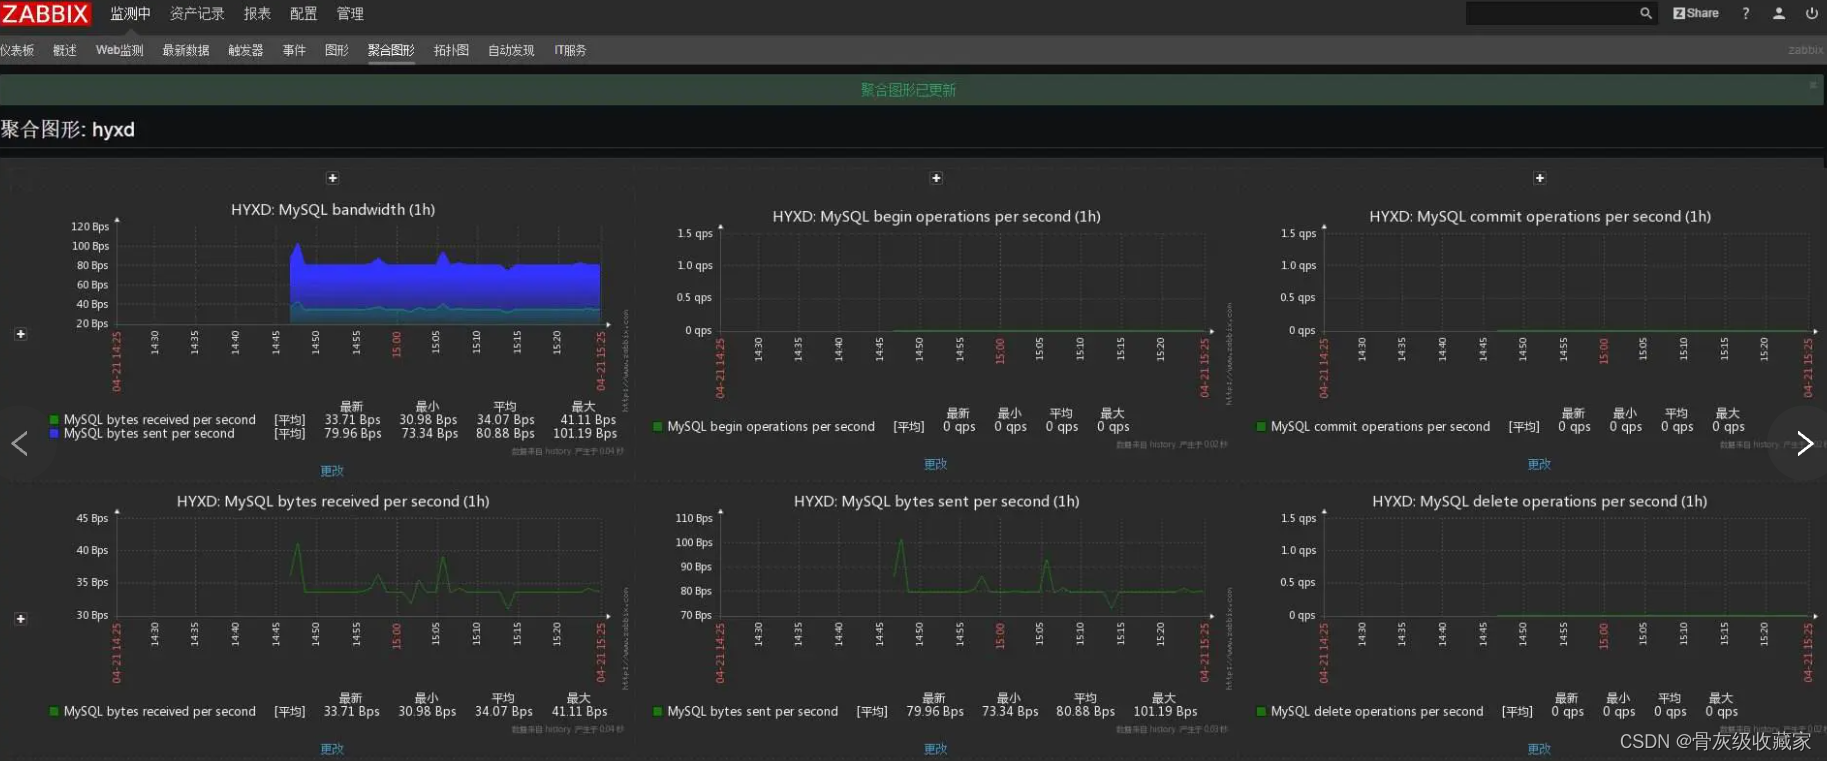
Nagios
    一款开源的免费网络监视工具,能有效监控Windows、Linux和Unix的状态,交换机路由器等网络设备,打印机等
      在系统或服务状态异常时发出邮件或短信报警第一时间通知网站运维人员,在状态恢复后发出正常的邮件或短信通知
Prometheus
Prometheus是由SoundCloud开发的开源监控报警系统和时序列数据库(TSDB),它启发于 Google 的 borgmon 监控系统,由工作在 SoundCloud 的 google 前员工在 2012 年创建,作为社区开源项目进行开发,并于 2015 年正式发布。
      2016 年,Prometheus 正式加入 Cloud Native Computing Foundation,成为受欢迎度仅次于 Kubernetes 的项目。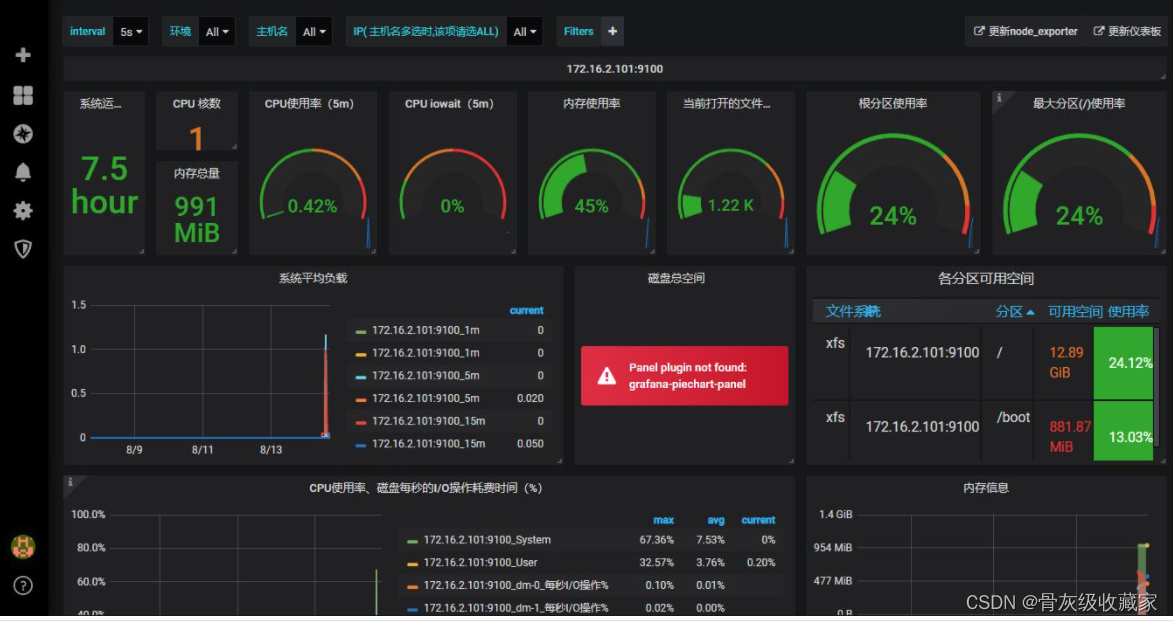
Prometheus的介绍
目标:了解Prometheus的功能和特点
路径
- step1:功能
- step2:特点
实施
- https://prometheus.io/

- 功能:服务器性能指标监控及时序数据存储
- Prometheus实现了高纬度数据模型,时间序列数据由指标名称和键值对指标组成。
- PromQL允许对收集的时间序列数据进行切片和切块,生成ad-hoc图形、图表、告警
- Prometheus有多种数据可视化模式:内置表达式浏览器,grafana集成、控制台模板语言
- Prometheus使用有效的自定义格式将时间序列数据存储在内存中和本地磁盘,通过函数式分片和联邦进行弹性扩展。
- 每个服务器都是独立的,仅依赖于本地存储。用go语言编写,所有二进制文件都是静态链接,易于部署。
- 告警是基于PromQL灵活定义的,并保留维度信息,告警管理器控制告警信息的通知与否。
- 特点
- 多维度数据模型。
- 灵活的查询语言。
- 不依赖分布式存储,单个服务器节点是自主的。
- 通过基于HTTP的pull方式采集时序数据。
- 可以通过中间网关进行时序列数据推送。
- 通过服务发现或者静态配置来发现目标服务对象。
- 支持多种多样的图表和界面展示,比如Grafana等。
Prometheus的架构
目标:了解Prometheus的架构
实施
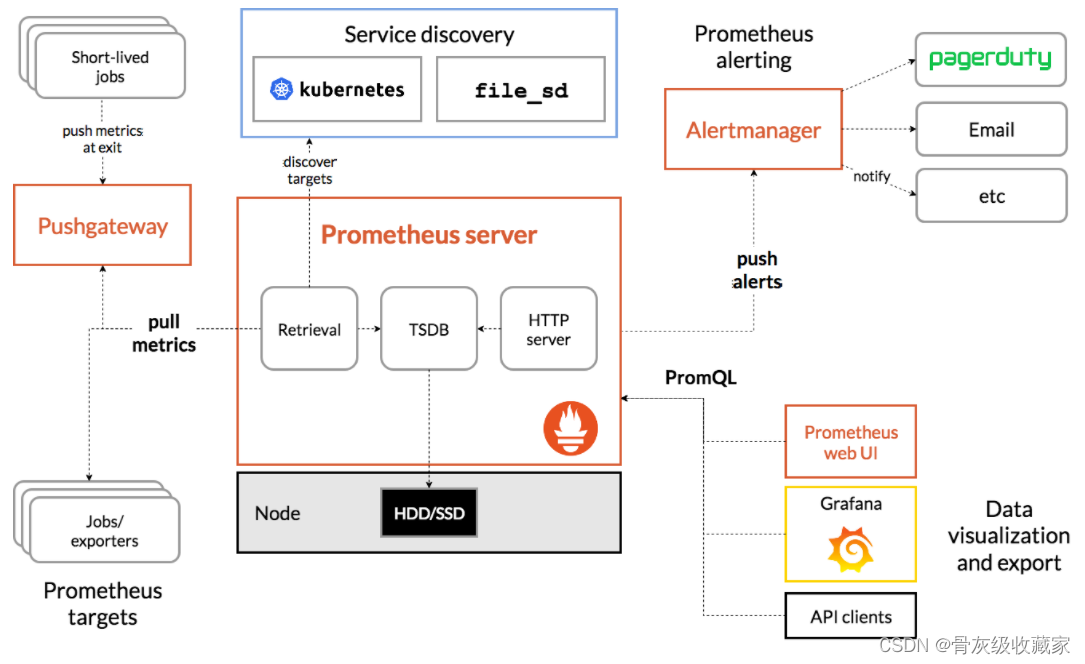
- **Prometheus server**:Prometheus主服务器,它会收集并存储时间序列数据
- **Alalert manager**:处理告警信息
- **Push gateway**:支持短暂任务的推送网关
- Client libraries:用于检测应用程序代码的客户端库
- Exporters:特定的导出器服务,例如:HAProxy,StatsD,Graphite等服务。
Prometheus的部署
目标:实现Prometheus的部署
实施
上传解压
cd ~
    rz
    # 解压安装包
    tar zxvf prometheus-2.26.0.linux-amd64.tar.gz -C /opt
    # 修改文件名
    mv /opt/prometheus-2.26.0.linux-amd64/ /opt/prometheus-2.26
    # 进入解压后的安装包
    cd /opt/prometheus-2.26
验证
./prometheus --version- 查看配置:prometheus.yml
# my global config
    global:
      scrape_interval:     15s # Set the scrape interval to every 15 seconds. Default is every 1 minute.
      evaluation_interval: 15s # Evaluate rules every 15 seconds. The default is every 1 minute.
      # scrape_timeout is set to the global default (10s).

    # Alertmanager configuration
    alerting:
      alertmanagers:
      - static_configs:
        - targets:
          # - alertmanager:9093

    # Load rules once and periodically evaluate them according to the global 'evaluation_interval'.
    rule_files:
      # - "first_rules.yml"
      # - "second_rules.yml"

    # A scrape configuration containing exactly one endpoint to scrape:
    # Here it's Prometheus itself.
    scrape_configs:
      # The job name is added as a label `job=<job_name>` to any timeseries scraped from this config.
      - job_name: 'prometheus'

        # metrics_path defaults to '/metrics'
        # scheme defaults to 'http'.

        static_configs:
        - targets: ['localhost:9090']
注册系统服务
vim /etc/systemd/system/prometheus.service [Unit]
Description=Prometheus
Documentation=Prometheus Monitoring System
[Service]
ExecStart=/opt/prometheus-2.26/prometheus --config.file=/opt/prometheus-2.26/prometheus.yml
Restart=on-failure
[Install]
WantedBy=multi-user.target启动
# 设置开机自启动
systemctl enable prometheus
# 启动服务
systemctl start prometheus
# 查看服务状态
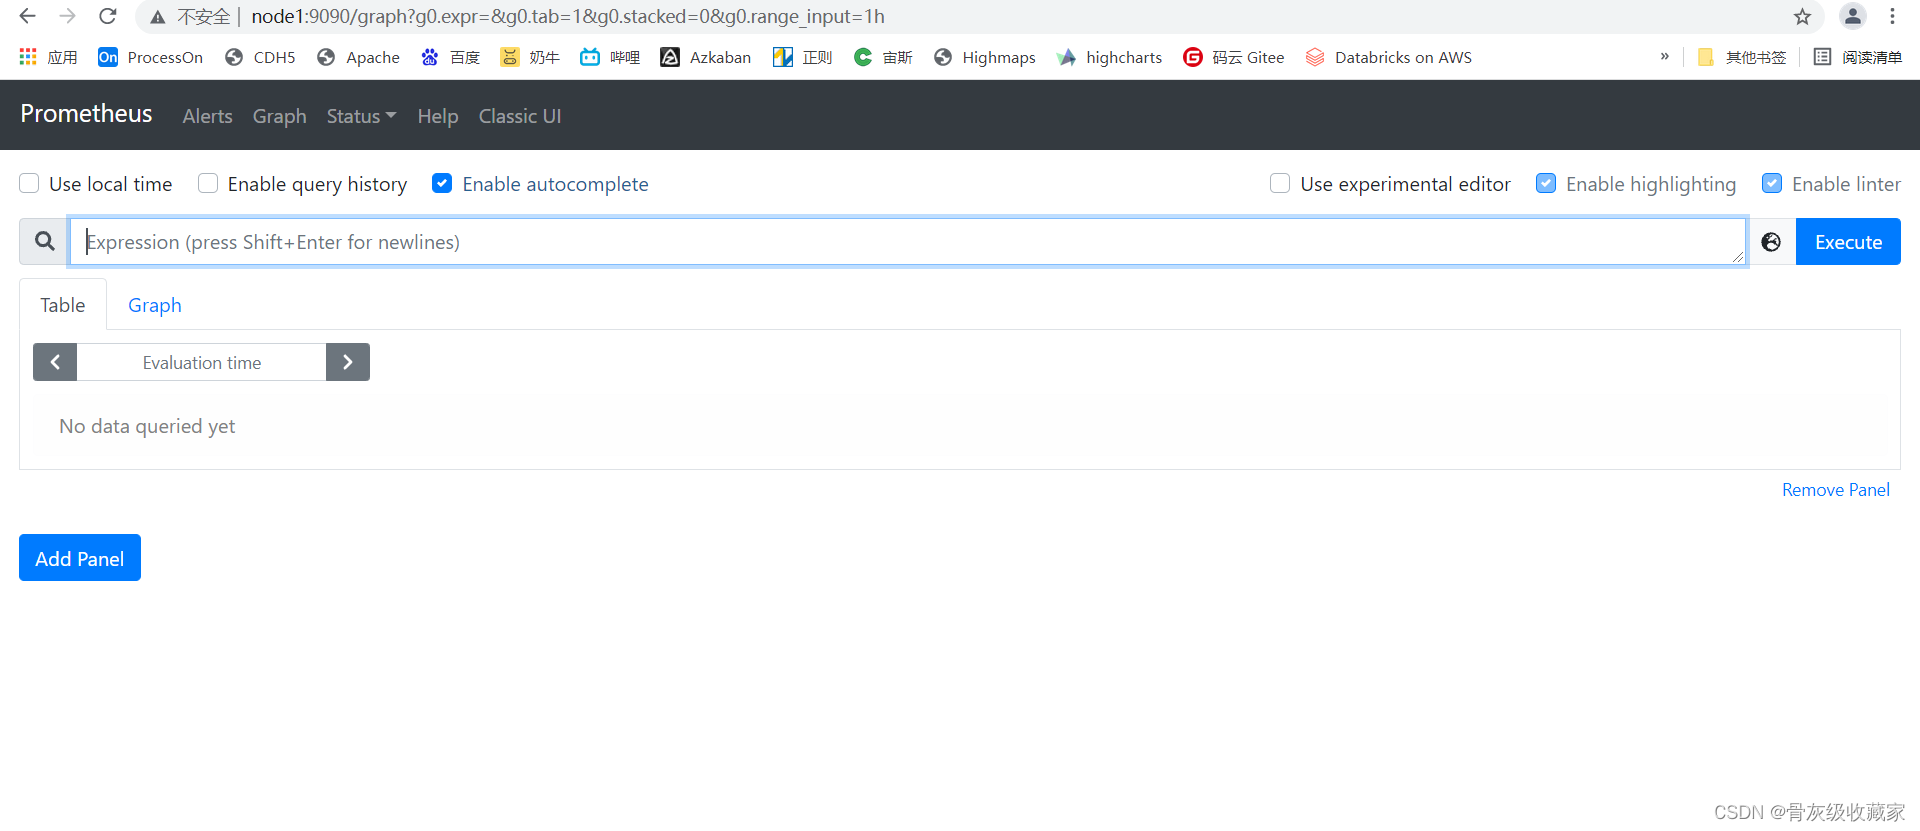
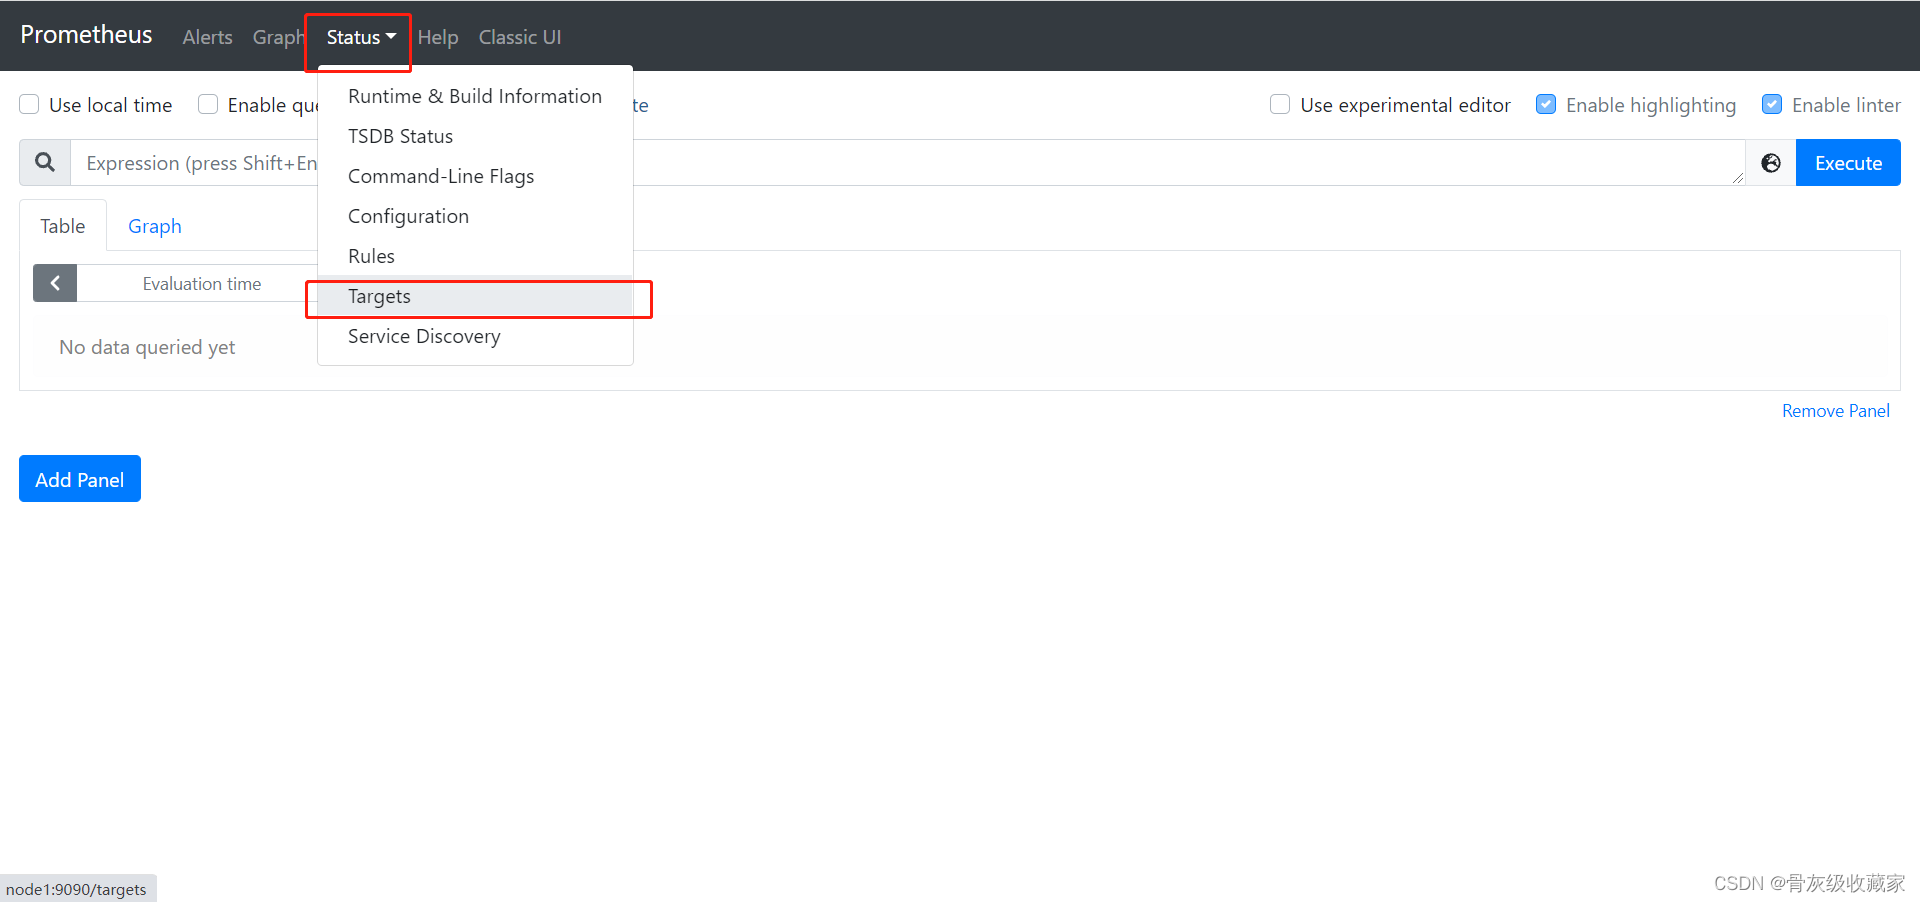
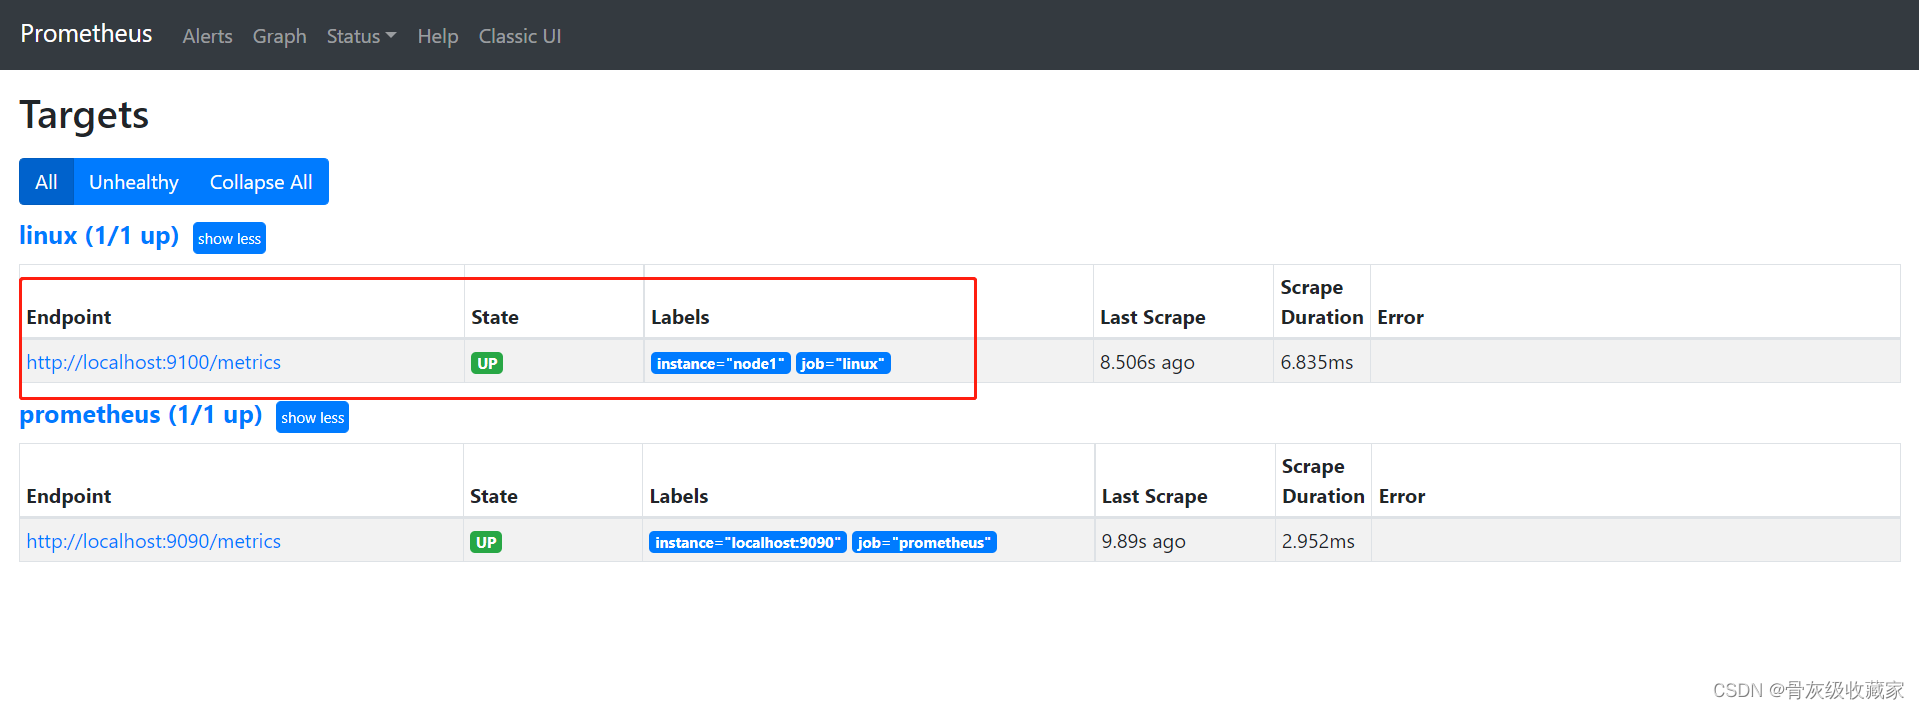
systemctl status prometheus验证:node1:9090
node_exporter插件
目标:实现node_exporter插件的安装监控Linux指标
实施
上传安装
  cd ~
    rz
    tar zxvf node_exporter-1.1.2.linux-amd64.tar.gz -C /opt/prometheus-2.26/
    mv /opt/prometheus-2.26/node_exporter-1.1.2.linux-amd64 /opt/prometheus-2.26/node_exporter
注册
 # 创建并编辑文件
    vim /etc/systemd/system/node_exporter.service
[Unit]
Description=node_exporter
Documentation=Prometheus node_exporter plugin
[Service]
ExecStart=/opt/prometheus-2.26/node_exporter/node_exporter
Restart=on-failure
[Install]
WantedBy=multi-user.target启动
   # 设置开机自启动
    systemctl enable node_exporter
    # 启动服务
    systemctl start node_exporter
    # 查看服务状态
    systemctl status node_exporter
配置Prometheus
vim /opt/prometheus-2.26/prometheus.ymlscrape_configs:
- job_name: 'prometheus'
static_configs:
- targets: ['localhost:9090']
# 增加以下内容
- job_name: 'linux'
static_configs:
- targets: ['localhost:9100']
labels:
instance: node1 重启prometheus
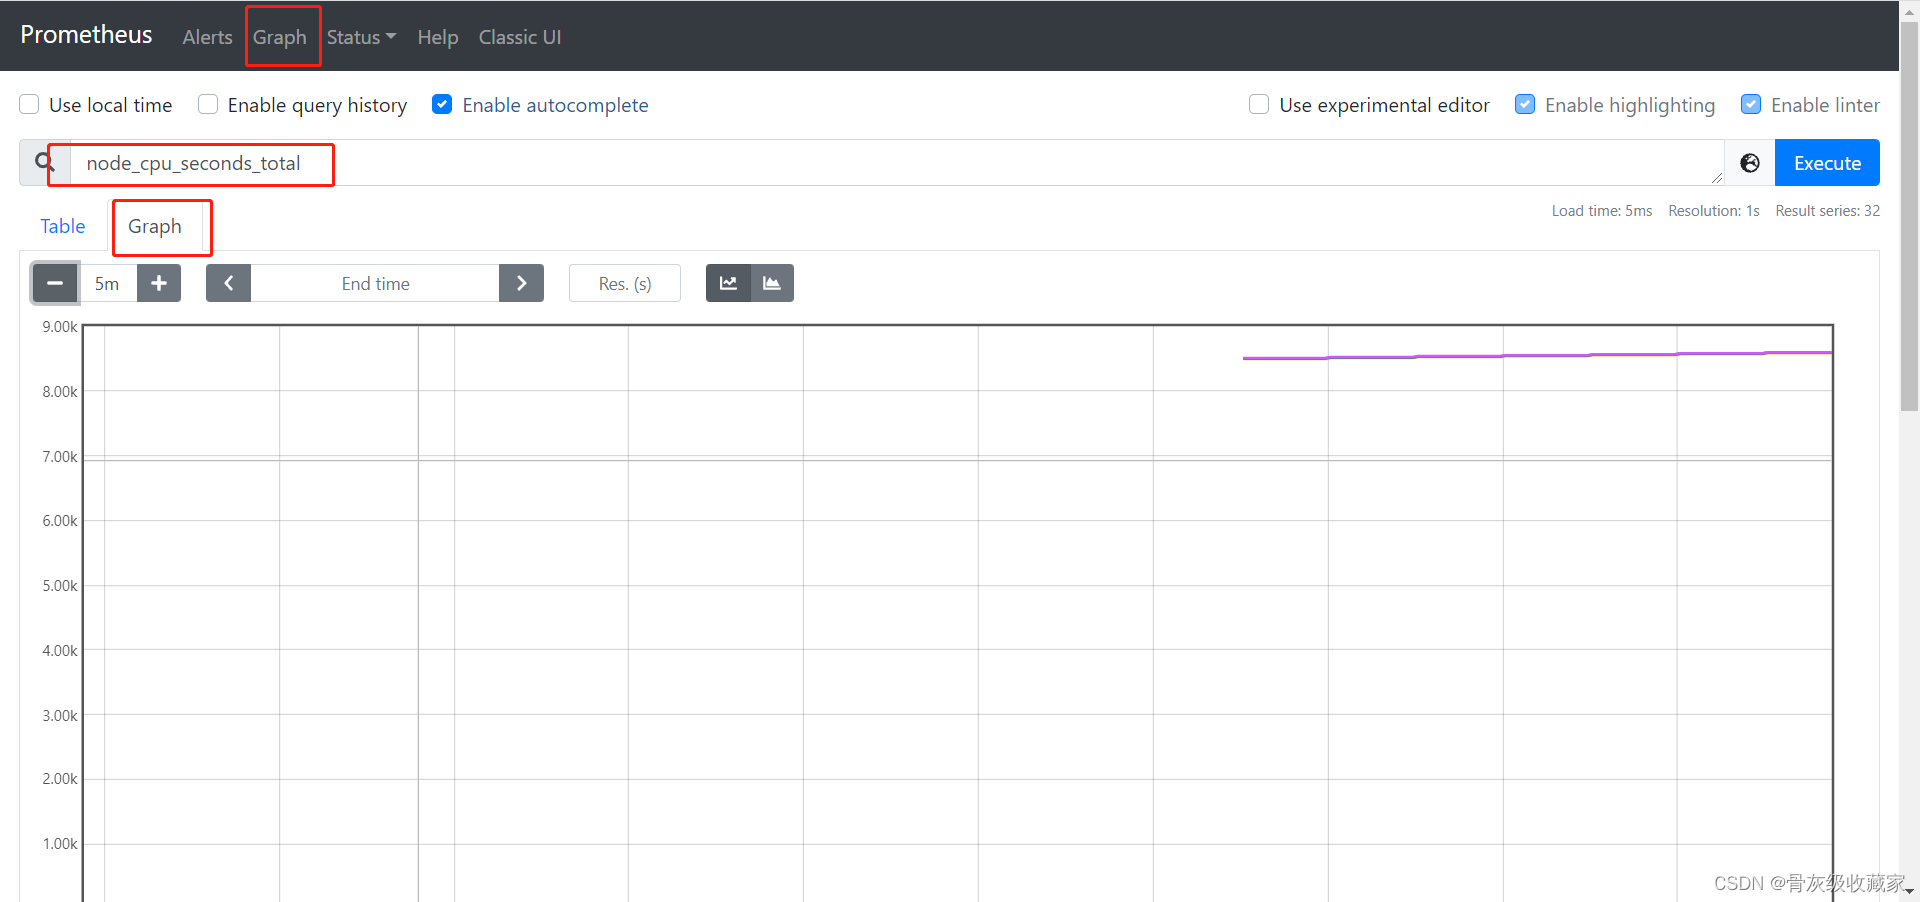
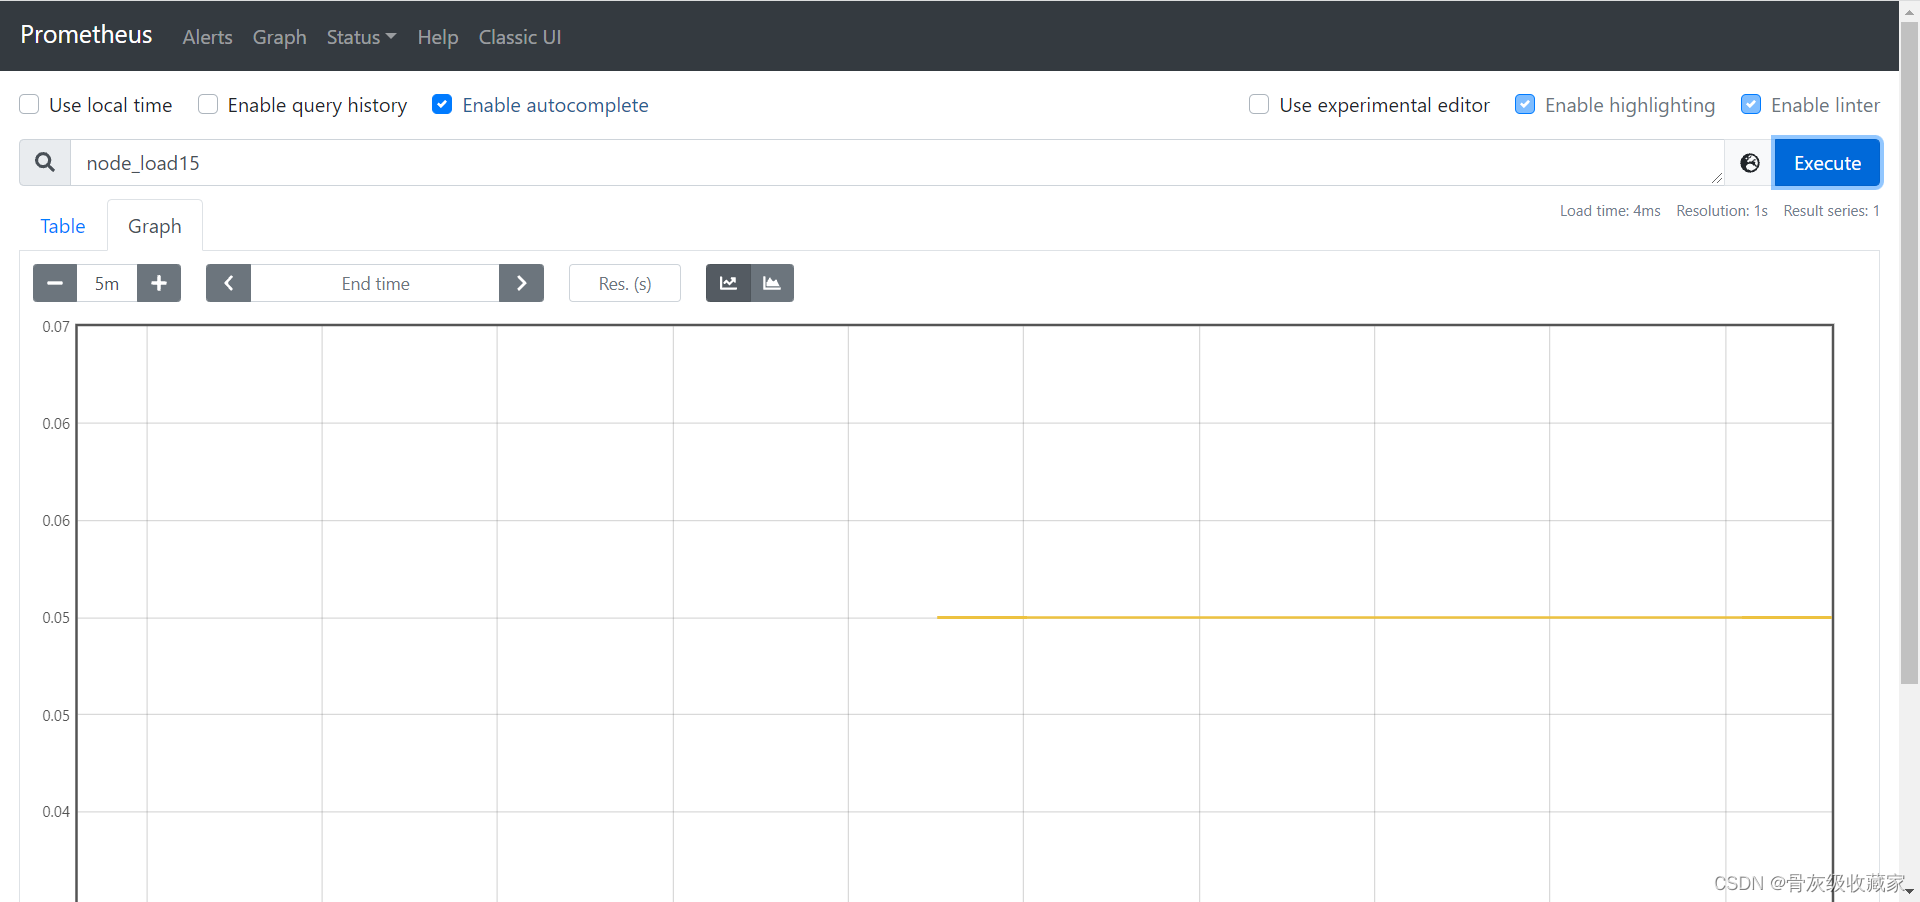
systemctl restart prometheus.service验证:http://node1:9090
- 查看当前主机的CPU使用情况:node_cpu_seconds_total
- 查看当前主机的CPU负载情况 :node_load15
mysqld_exportor插件
目标:实现mysqld_exportor插件的安装监控MySQL指标
实施
上传安装
cd ~
    rz
    tar zxvf mysqld_exporter-0.13.0-rc.0.linux-amd64.tar.gz -C /opt/prometheus-2.26/
    mv /opt/prometheus-2.26/mysqld_exporter-0.13.0-rc.0.linux-amd64/ /opt/prometheus-2.26/mysqld_exporter/
- **配置MySQL用户授权**
  mysql -uroot -p
    SHOW VARIABLES LIKE 'validate_password%';
    set global validate_password_policy=LOW;
    set global validate_password_length=6;
    # 授权
    GRANT PROCESS, REPLICATION CLIENT, SELECT ON *.* TO 'mysql_exporter'@'localhost' IDENTIFIED BY '123456' WITH MAX_USER_CONNECTIONS 3;
    flush privileges;
- DDL:数据定义语言:建库建表
- DML:数据操作语言:增删改
- DQL:数据查询语言:查询
- DCL:grant、revoke
- **注册服务**
vim /etc/systemd/system/mysqld_exporter.service [Unit]
Description=mysqld_exporter
Documentation=Prometheus mysql exporter plugin
[Service]
Type=simple
User=mysql
Environment=DATA_SOURCE_NAME=mysql_exporter:123456@(localhost:3306)/
ExecStart=/opt/prometheus-2.26/mysqld_exporter/mysqld_exporter --config.my-cnf /etc/my.cnf \
--collect.slave_status \
--collect.slave_hosts \
--log.level=error \
--collect.info_schema.processlist \
--collect.info_schema.innodb_metrics \
--collect.info_schema.innodb_tablespaces \
--collect.info_schema.innodb_cmp \
--collect.info_schema.innodb_cmpmem
Restart=on-failure
[Install]
WantedBy=multi-user.target启动服务
  # 设置开机自启动
    systemctl enable mysqld_exporter
    # 启动服务
    systemctl start mysqld_exporter
    # 查看服务状态
    systemctl status mysqld_exporter
- **配置Prometheus**
vim /opt/prometheus-2.26/prometheus.yml scrape_configs:
# 增加以下内容
- job_name: 'mysql'
scrape_interval: 1s
static_configs:
- targets: ['localhost:9104']
labels:
instance: 'mysqld_exporter'- 重启prometheus
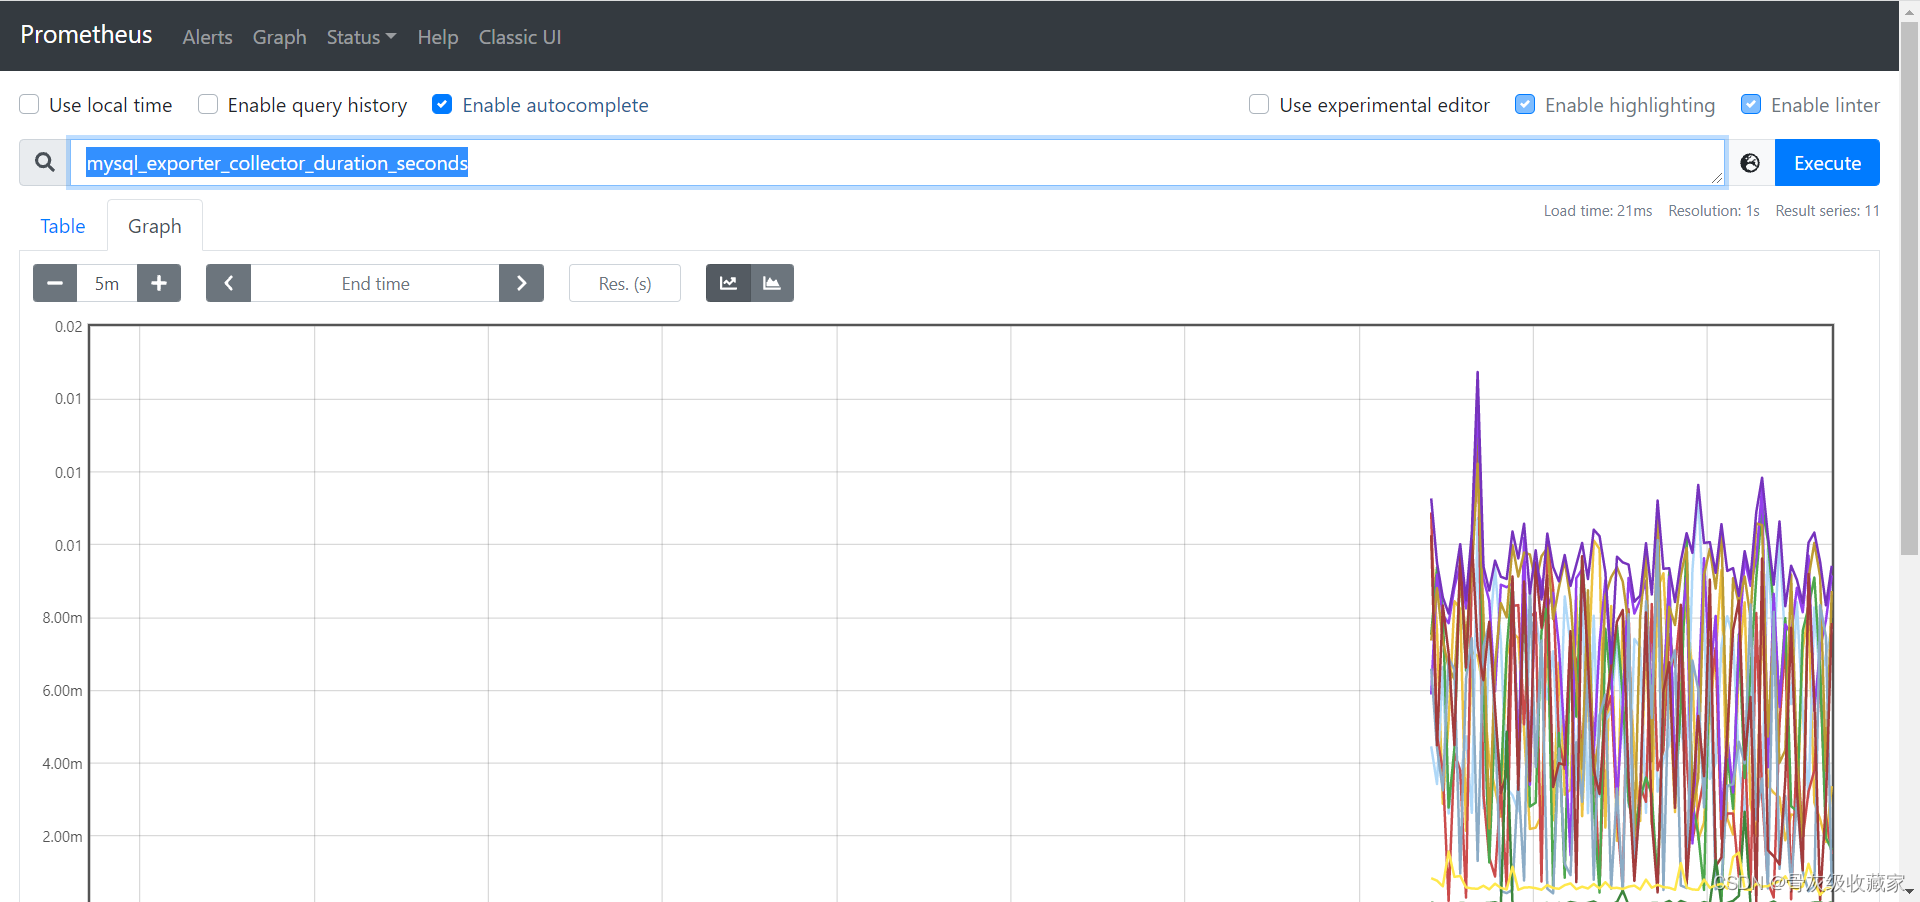
systemctl restart prometheus.service验证
- mysql_exporter_collector_duration_seconds
可视化工具Grafana介绍
目标:了解Grafana的功能及特点
路径
- step1:功能
- step2:特点
实施
- https://grafana.com/

功能:Grafana是一个跨平台的开源的度量分析和可视化工具,可以通过将采集的数据查询然后可视化的展示,并及时通知
特点
展示方式多样:快速灵活的客户端图表,面板插件有许多不同方式的可视化指标和日志,官方库中具有丰富的仪表盘插件,比如热图、折线图、图表等多种展示方式
数据源丰富:Graphite,InfluxDB,OpenTSDB,Prometheus,Elasticsearch,CloudWatch和KairosDB等
多种通知提醒:以可视方式定义最重要指标的警报规则,Grafana将不断计算并发送通知,在数据达到阈值时通过Slack、PagerDuty等获得通知
混合展示:在同一图表中混合使用不同的数据源,可以基于每个查询指定数据源,甚至自定义数据源
注释:使用来自不同数据源的丰富事件注释图表,将鼠标悬停在事件上会显示完整的事件元数据和标记
过滤器:Ad-hoc过滤器允许动态创建新的键/值过滤器,这些过滤器会自动应用于使用该数据源的所有查询
可视化工具Grafana部署
目标:实现可视化工具Grafana的部署
实施
上传安装
 cd ~
    rz
    yum install -y  grafana-7.5.3-1.x86_64.rpm
启动服务
# 设置开机自启动
systemctl enable grafana-server
# 启动服务
systemctl start grafana-server
# 查看服务状态
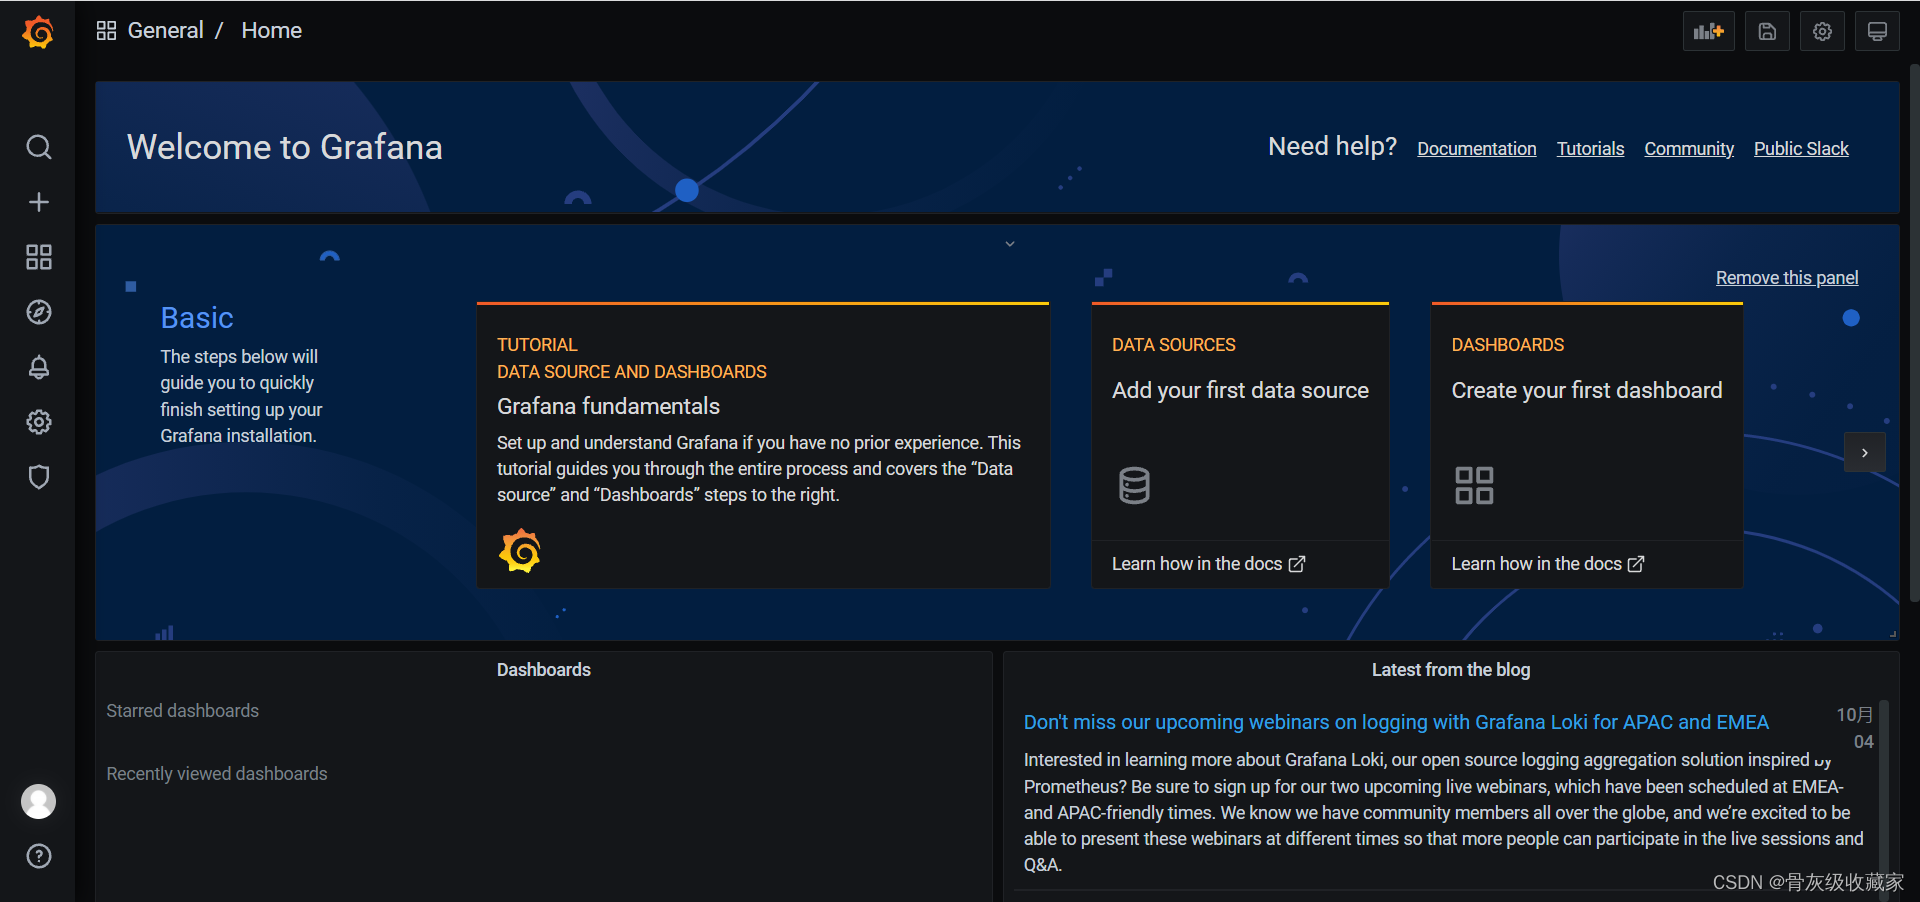
systemctl status grafana-server验证:http://node1:3000/
- 默认用户名密码均为admin

- 可以自行修改

- 进入主界面
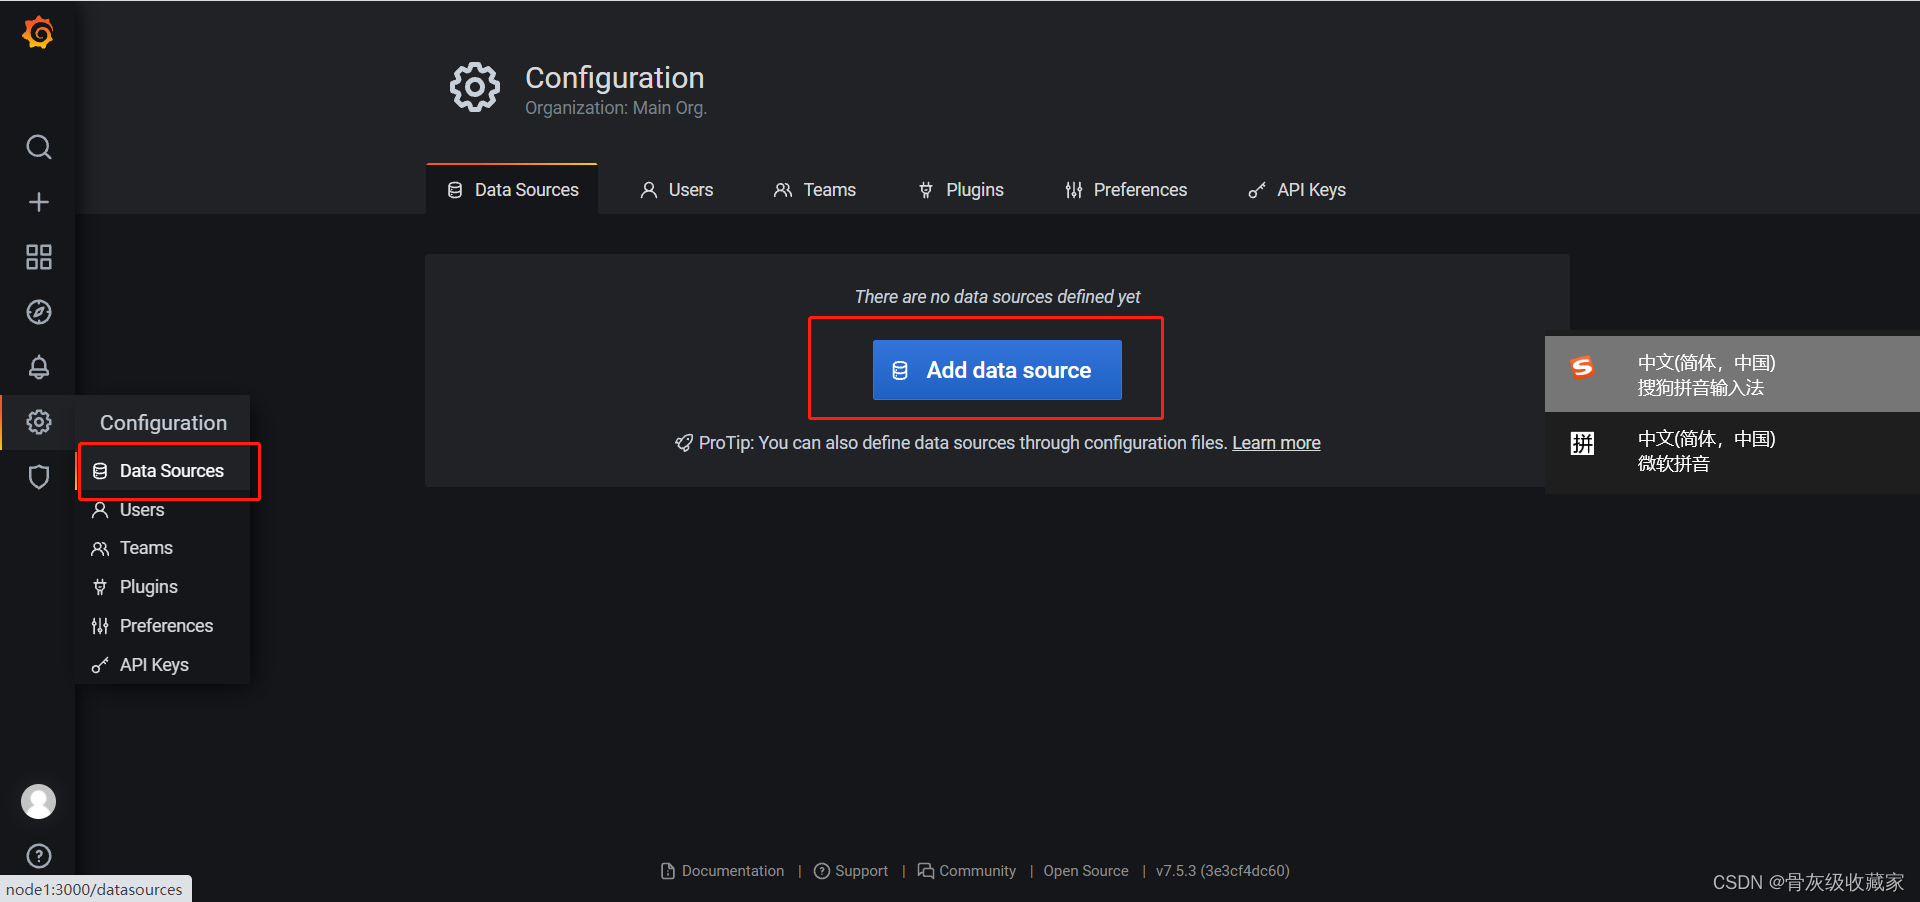
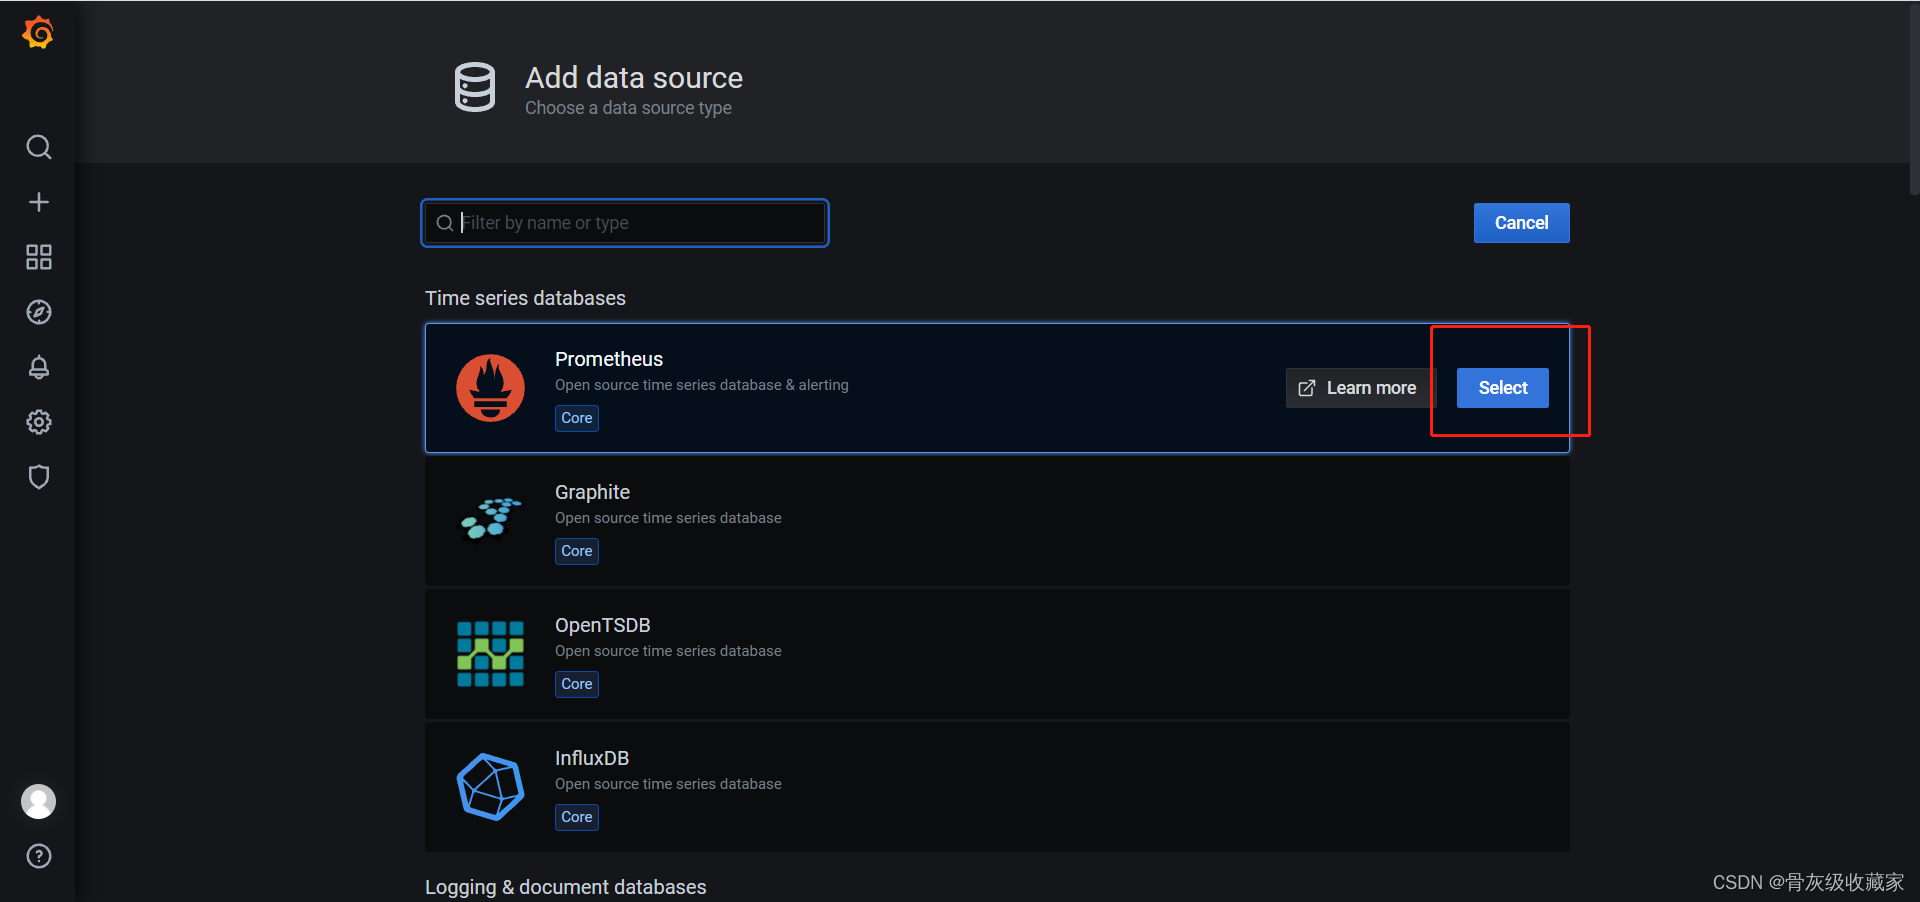
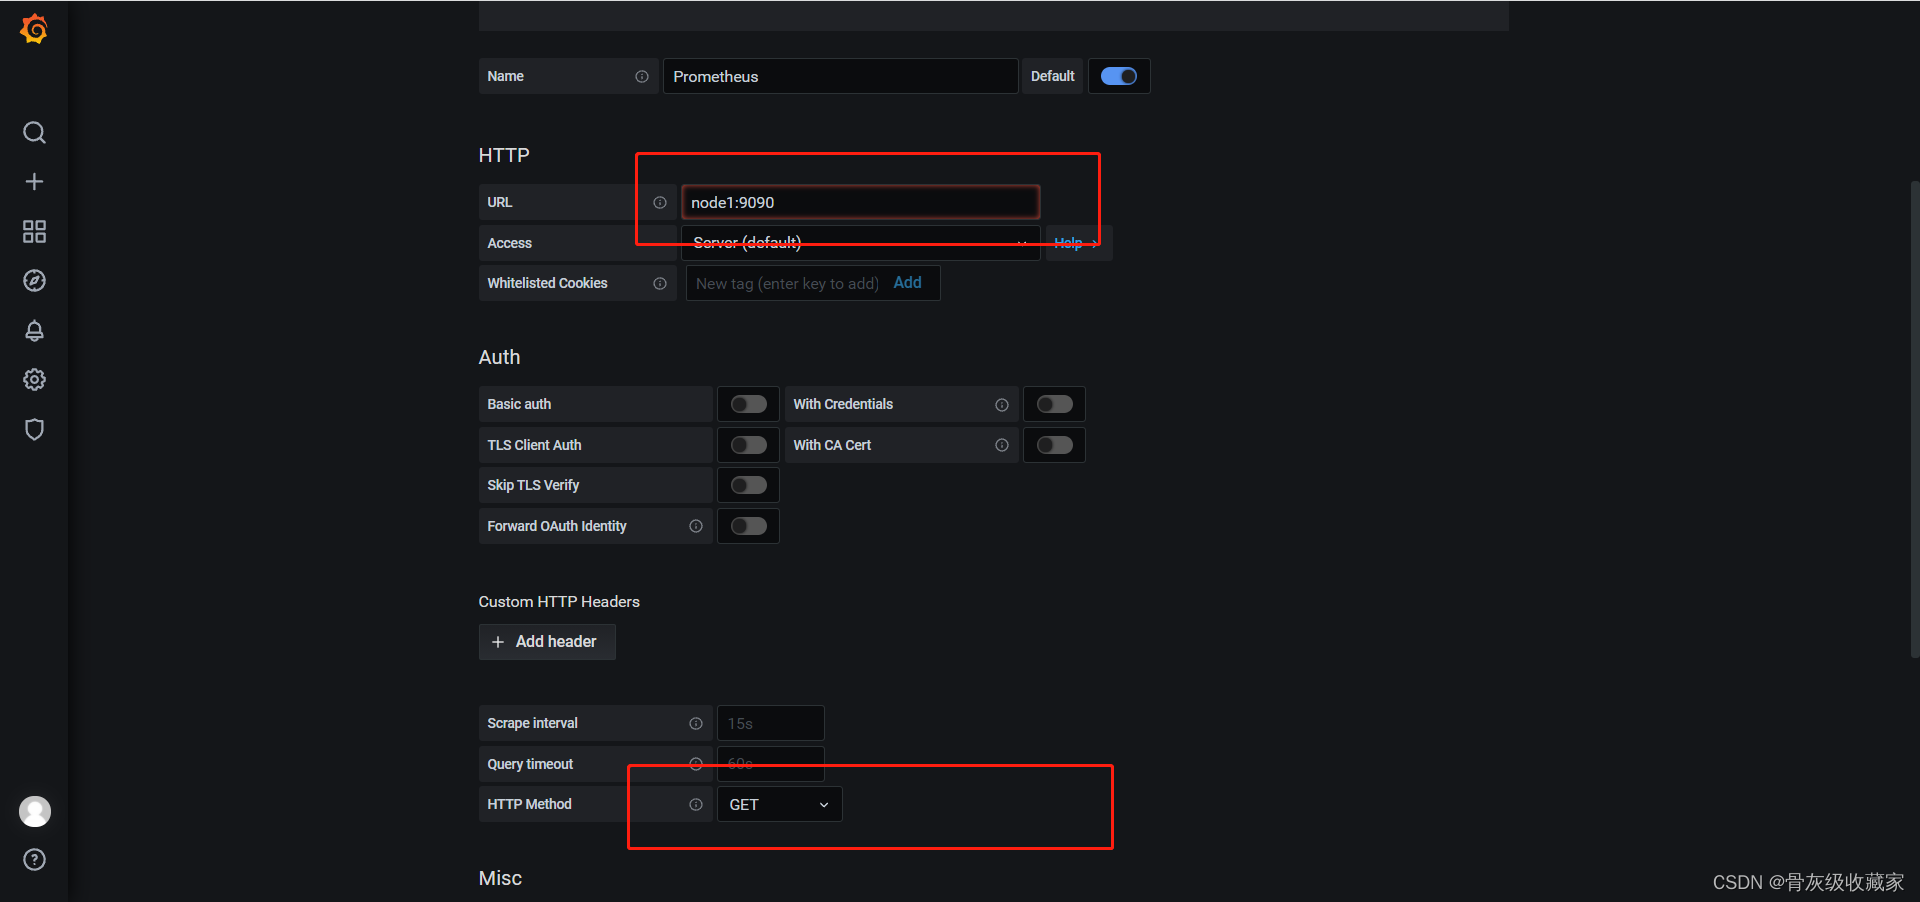
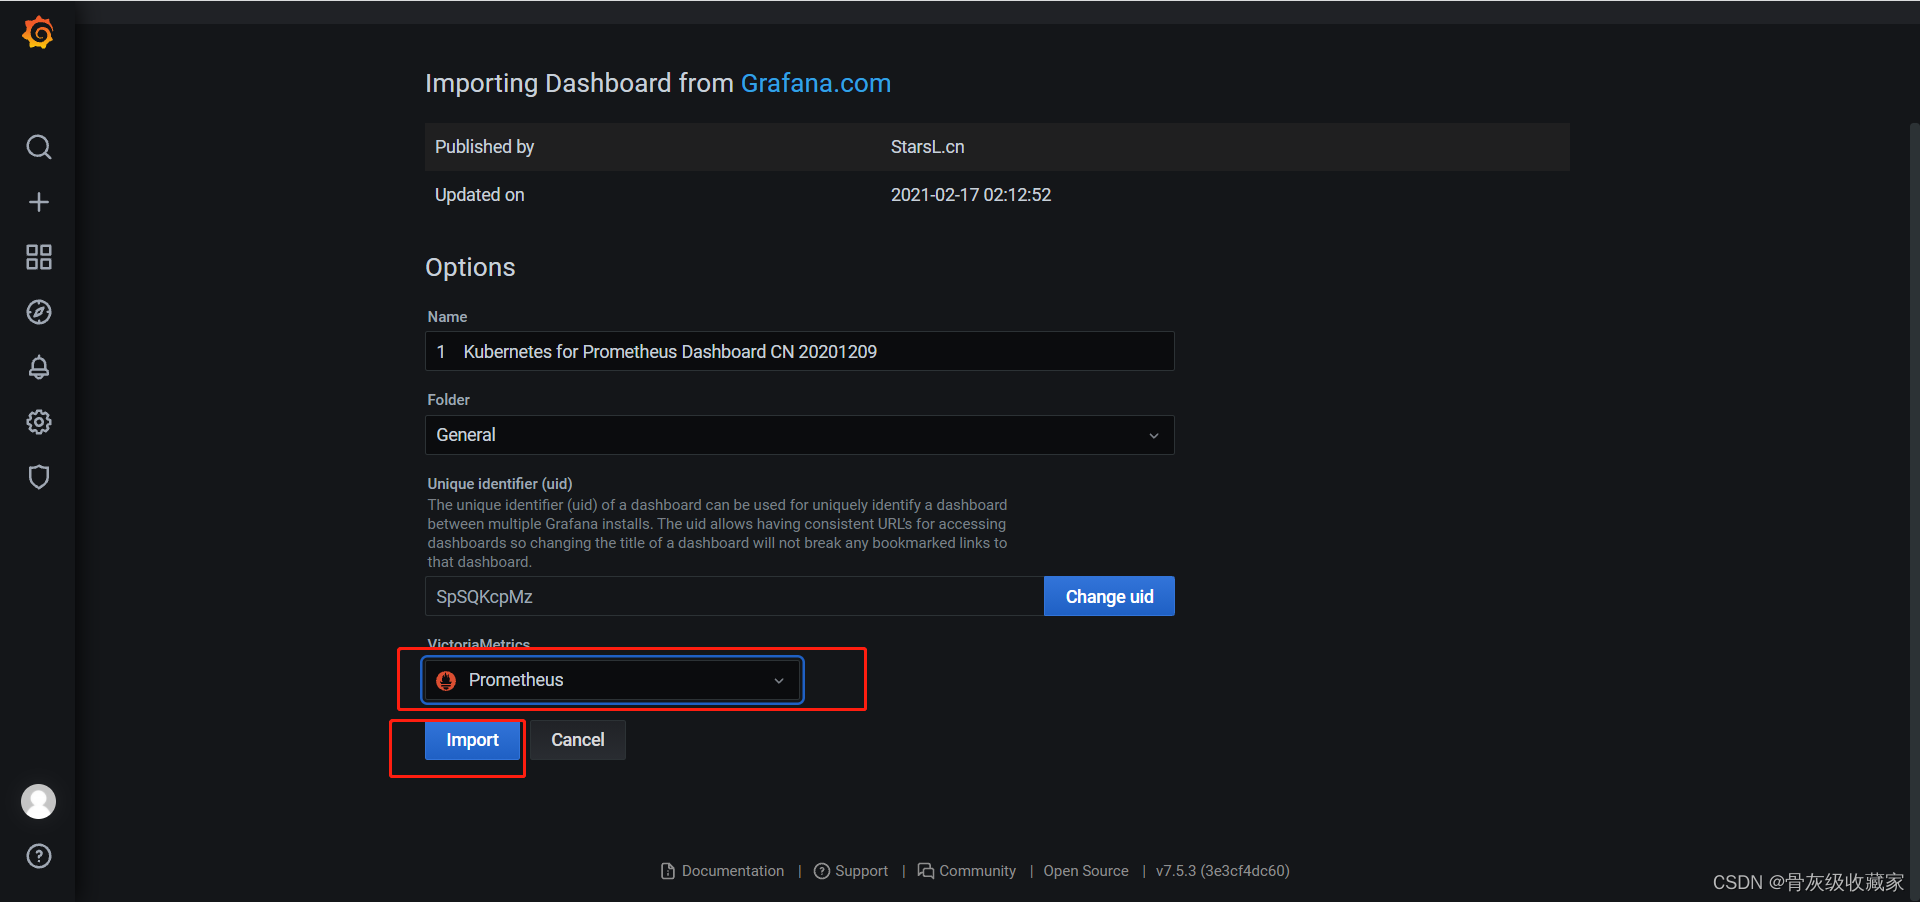
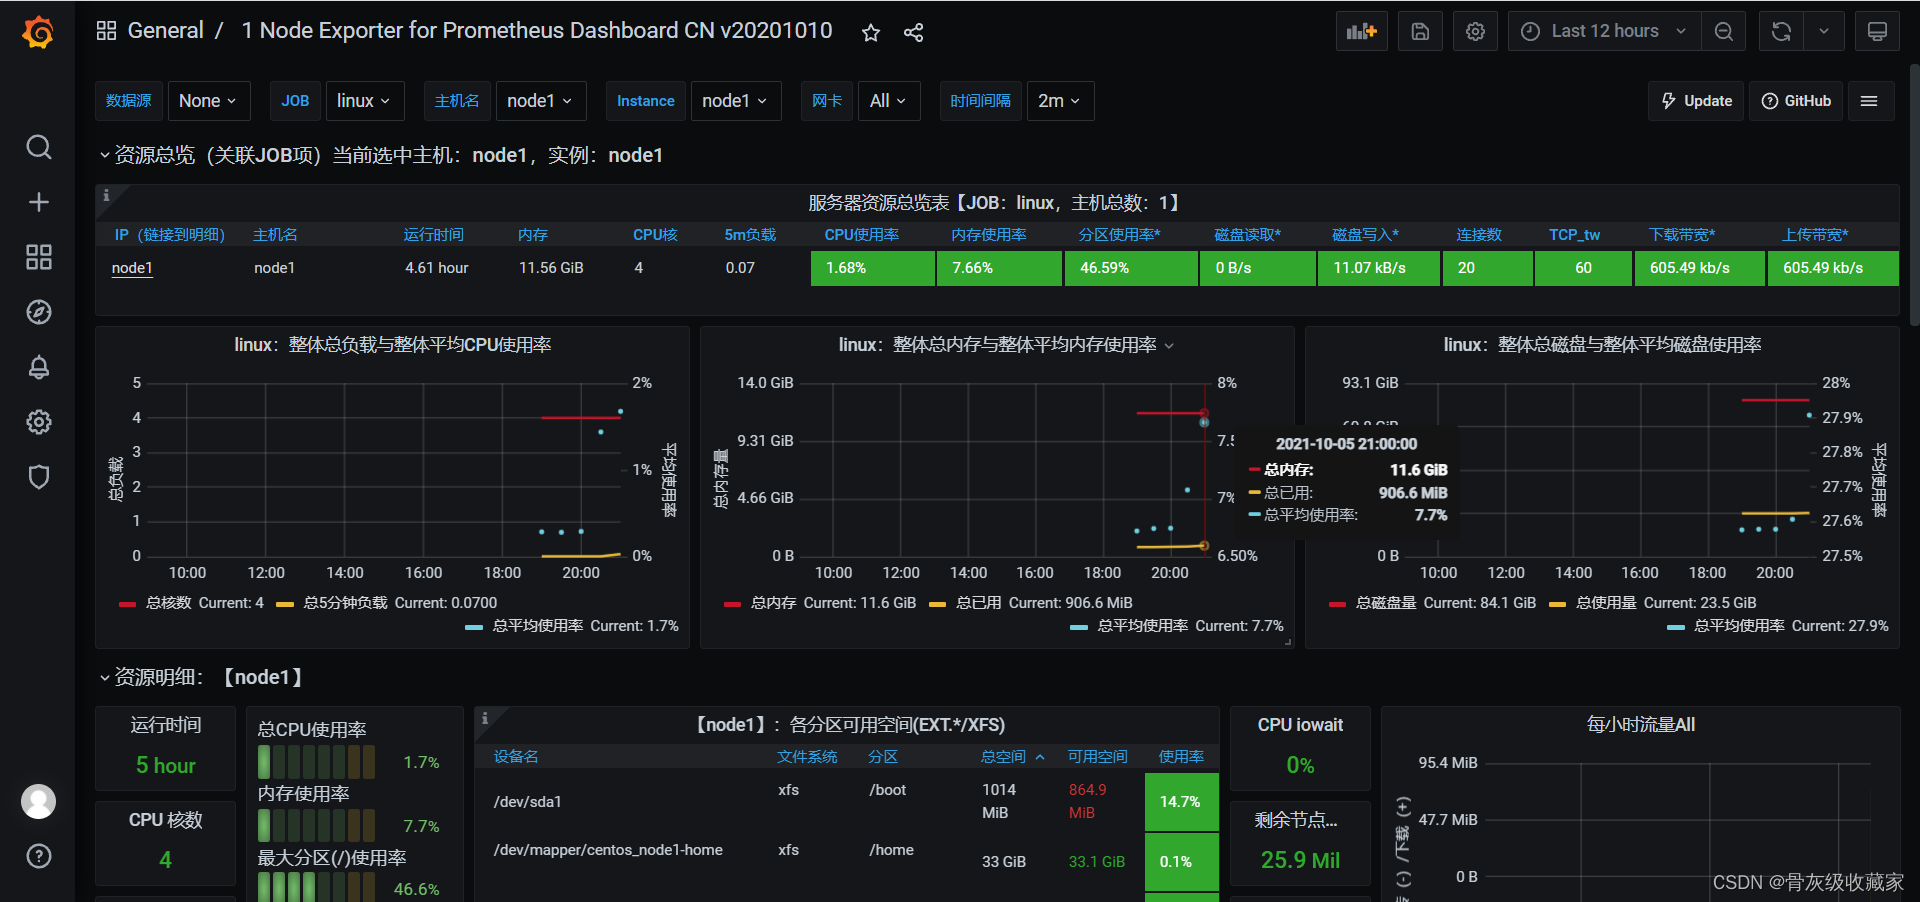
Grafana集成Prometheus
目标:实现Grafana集成Prometheus
实施
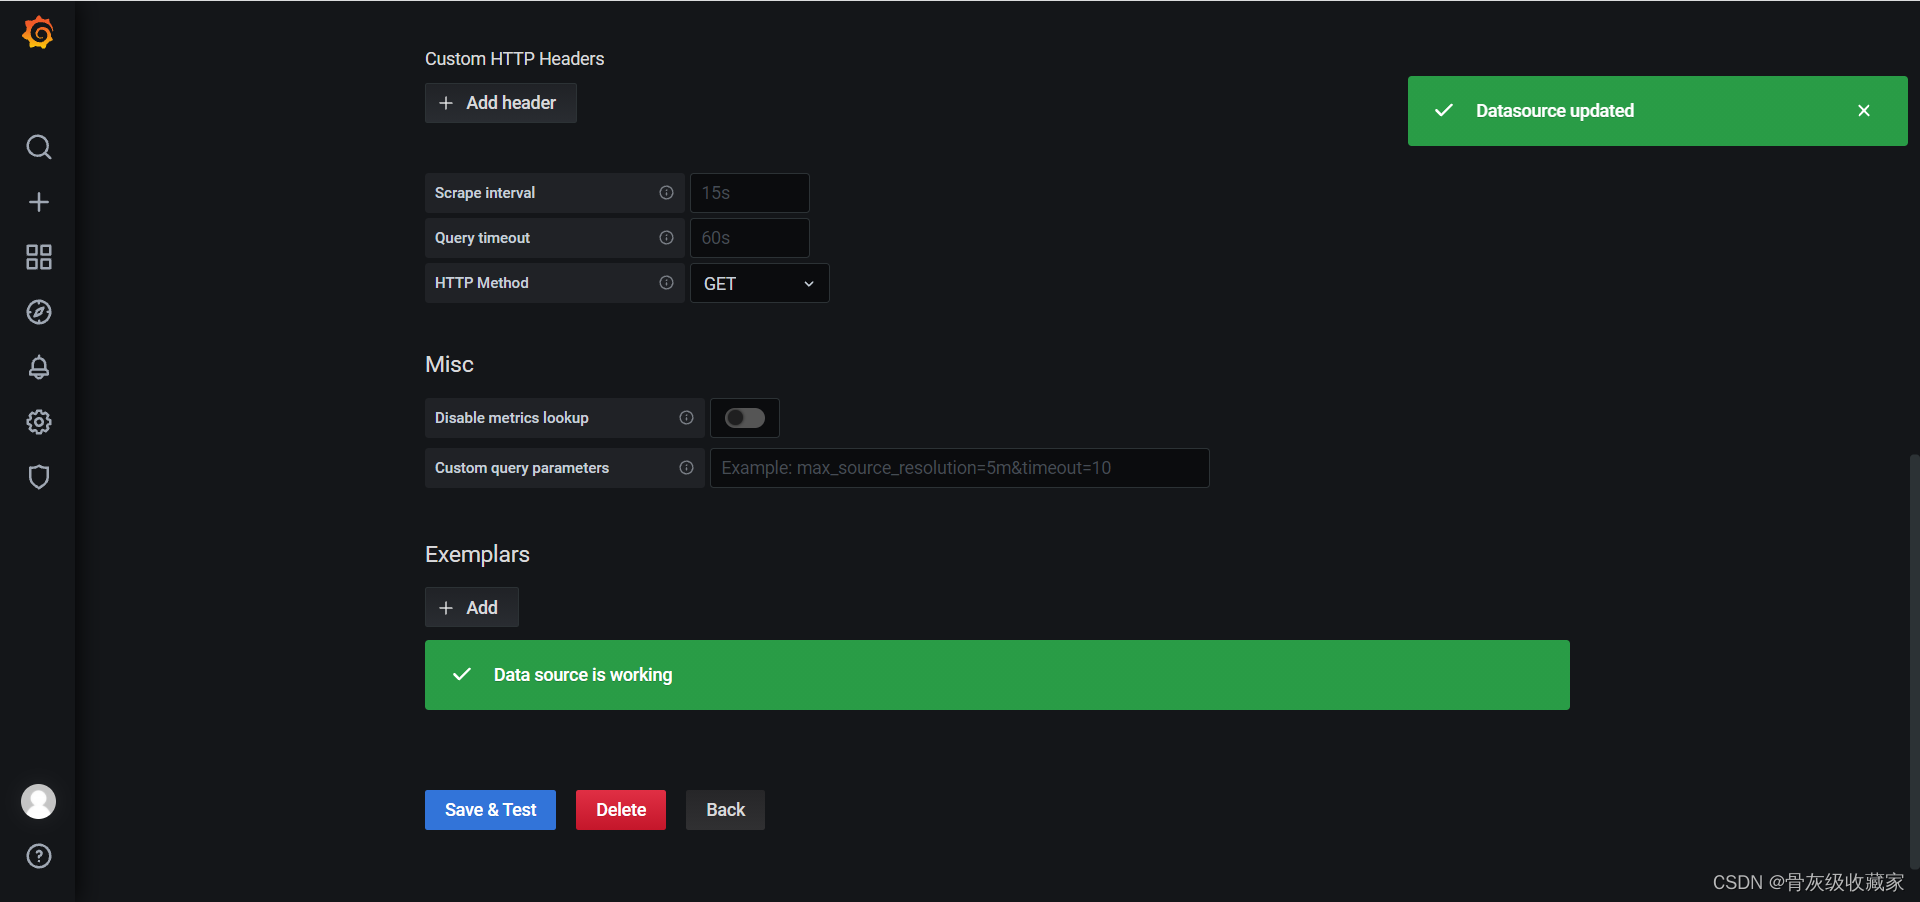
添加数据源
选择模板
- https://grafana.com/grafana/dashboards
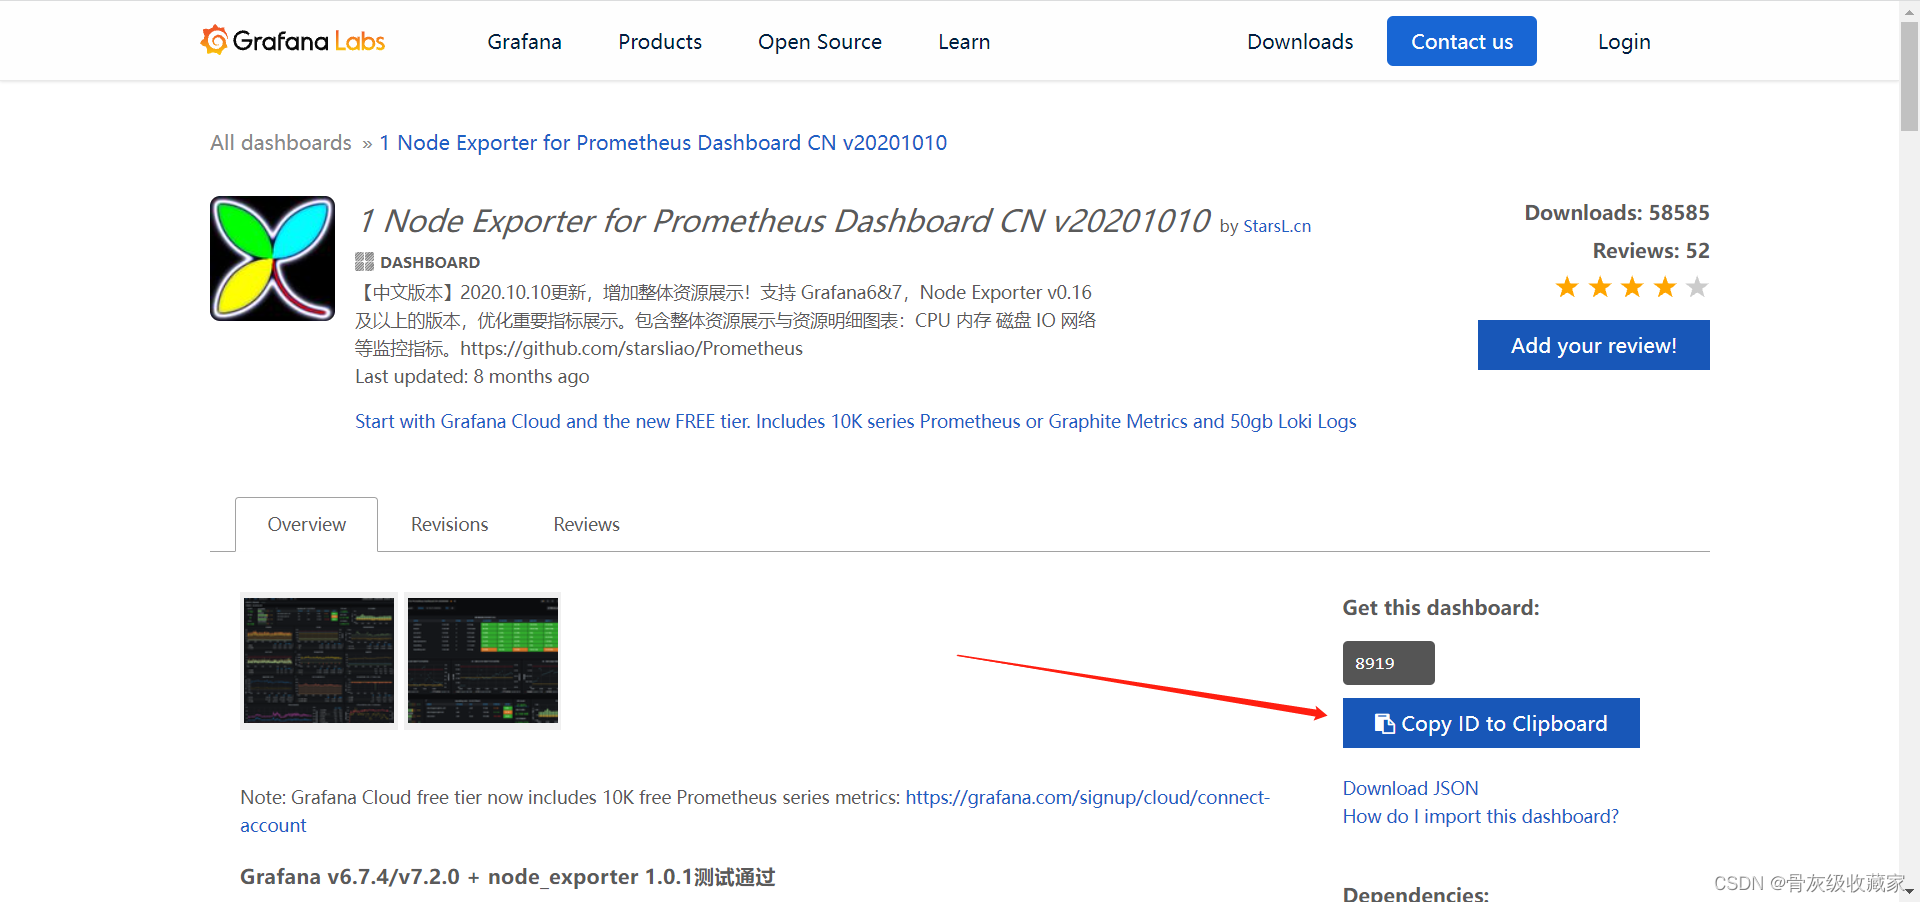
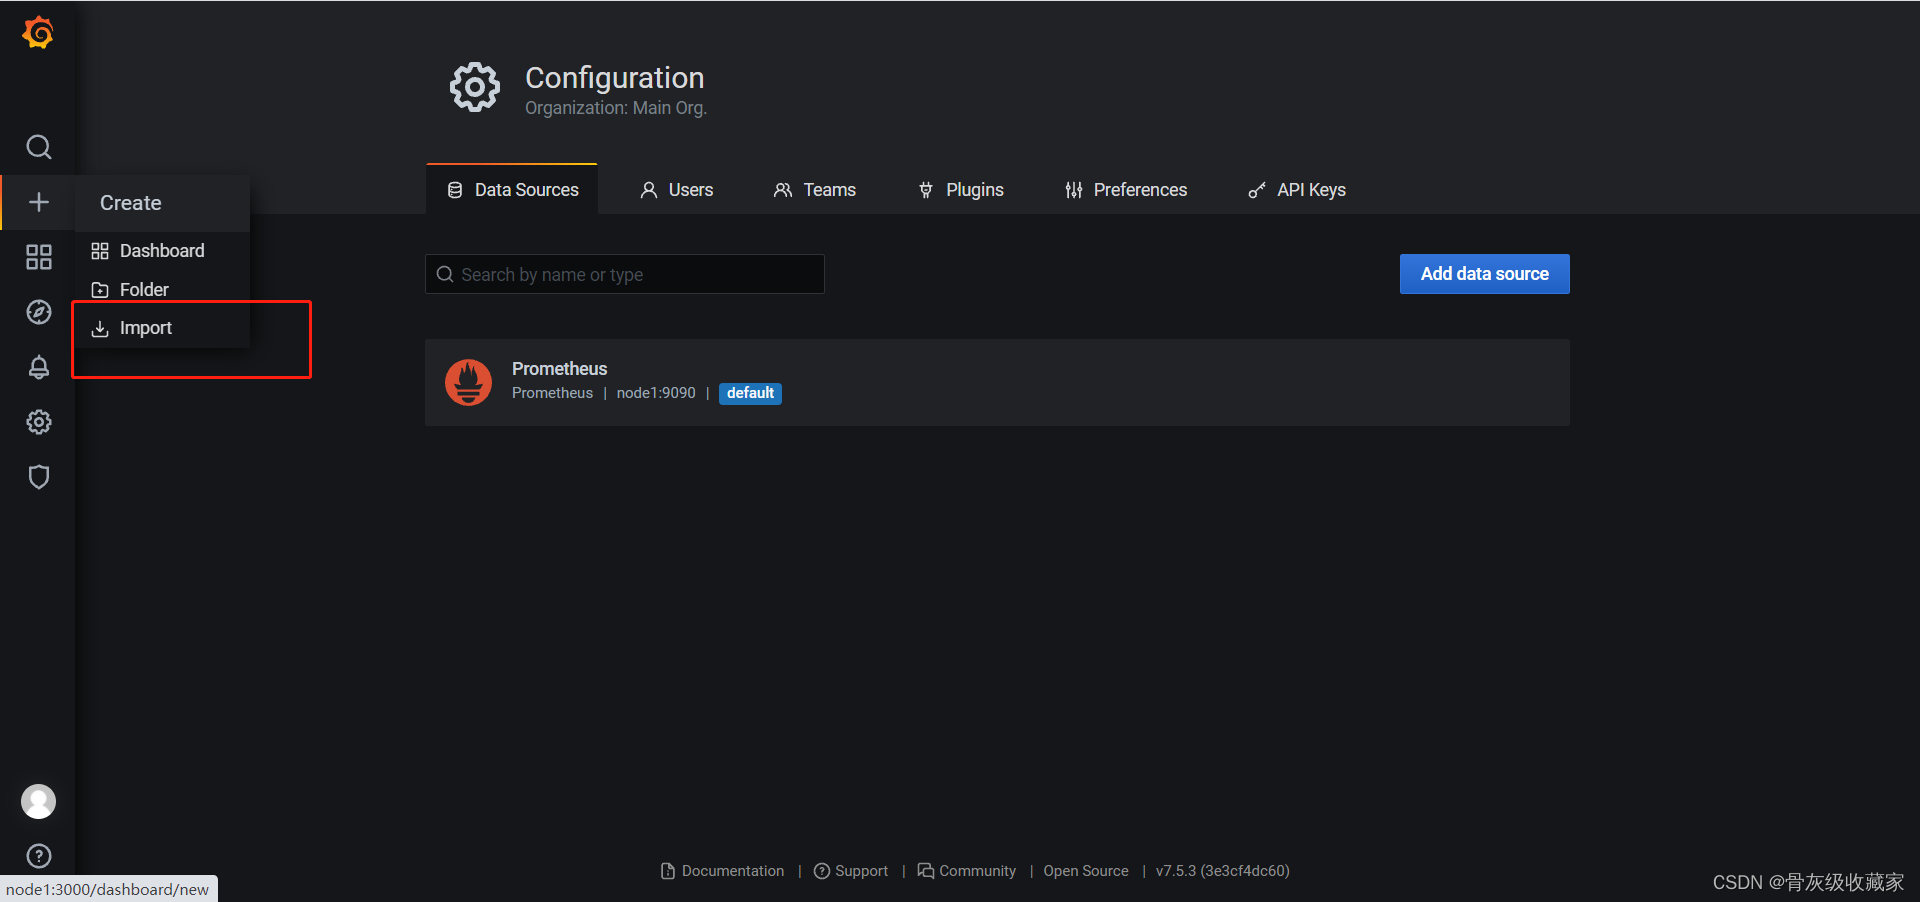
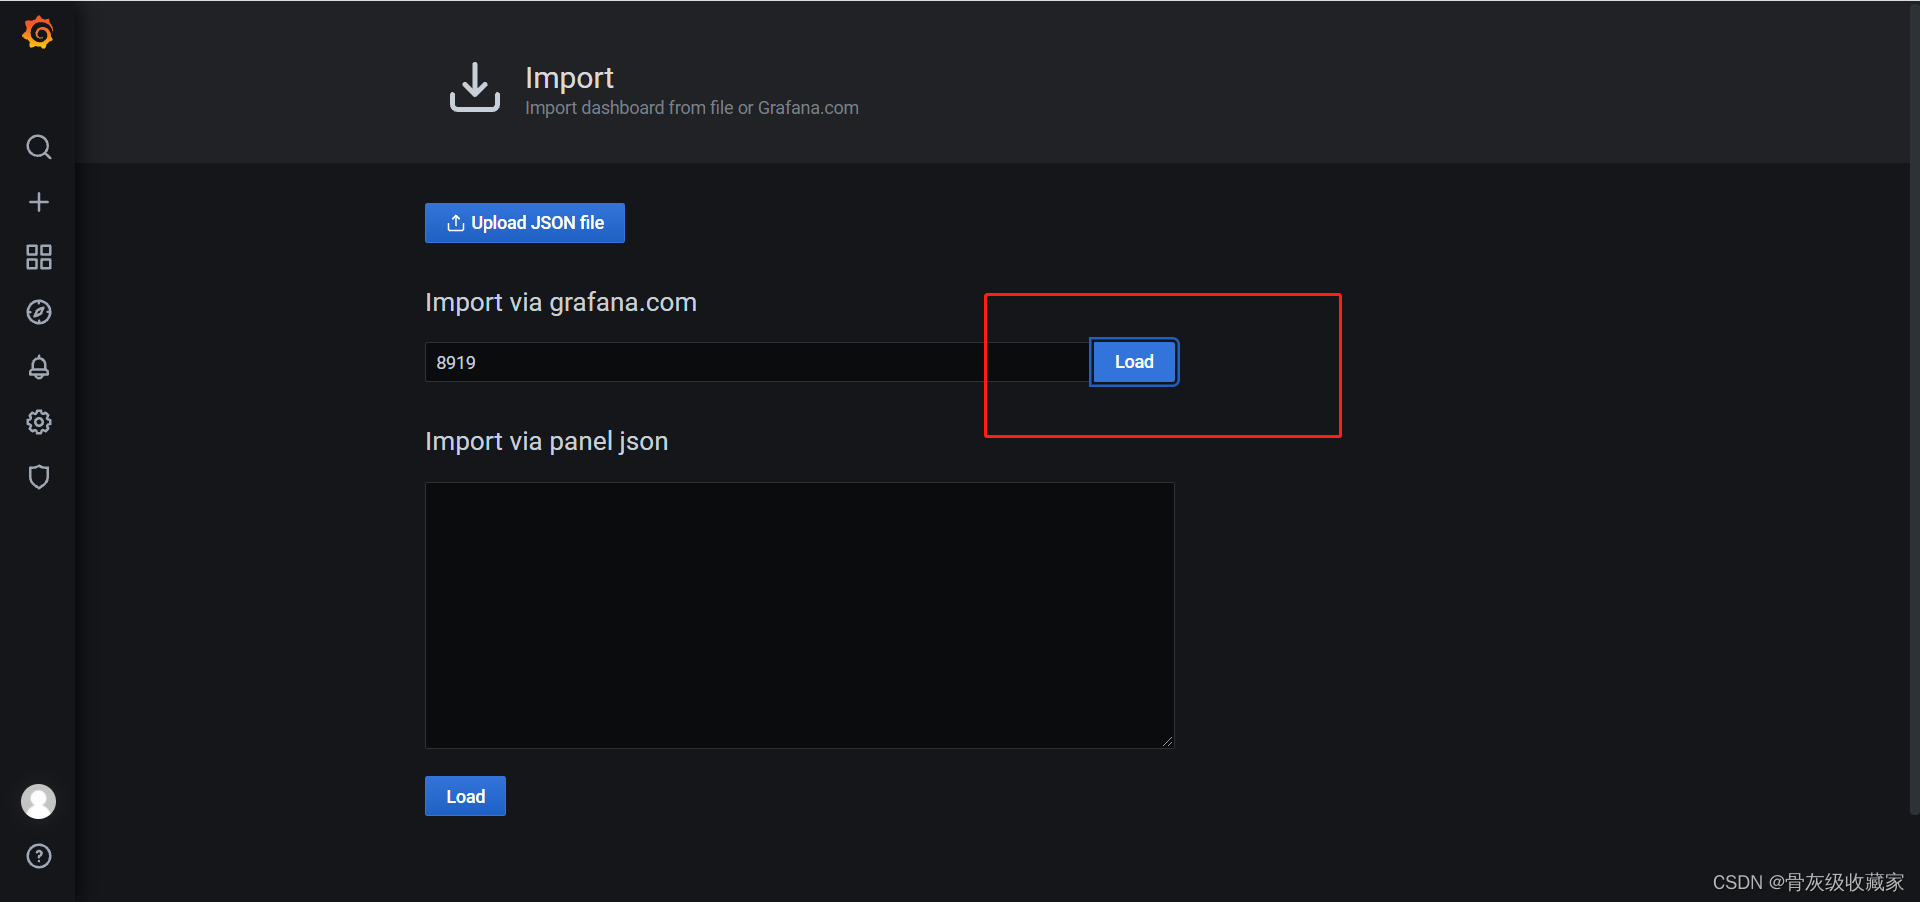
导入报表


![leetcode 23[python3]几种方法的思考与总结](https://img-blog.csdnimg.cn/8d71bdd82c9b4f04b37711057e227acd.png)