查看专栏目录
canvas示例教程100+专栏,提供canvas的基础知识,高级动画,相关应用扩展等信息。canvas作为html的一部分,是图像图标地图可视化的一个重要的基础,学好了canvas,在其他的一些应用上将会起到非常重要的帮助。
文章目录
- 语法:
- 参数
- 数据大小计算:
- 示例效果图
- 示例源代码(共90行)
- canvas基本属性
- canvas基础方法
如何使用canvas来创建图像数据呢? canvas createImageData() 方法返回一个图像的数据值。
语法:
createImageData(width, height)
createImageData(width, height, settings)
createImageData(imagedata)
参数
width矩形的宽度
height:矩形的高度
settings具有以下属性的对象:colorSpace:指定图像数据的色彩空间。 对于 sRGB 颜色空间,可以设置为“srgb”,对于 display-p3 颜色空间,可以设置为“display-p3”。
imagedata:复制过来的宽度和高度的现有 ImageData 对象。 图像本身不会被复制。
数据大小计算:
createImageData(100, 50)
生成的对象宽 100 像素,高 50 像素,总共 5,000 像素。 ImageData 对象中的每个像素都包含四个数组值,因此该对象的 data 属性的长度为 4 × 5,000 或 20,000。
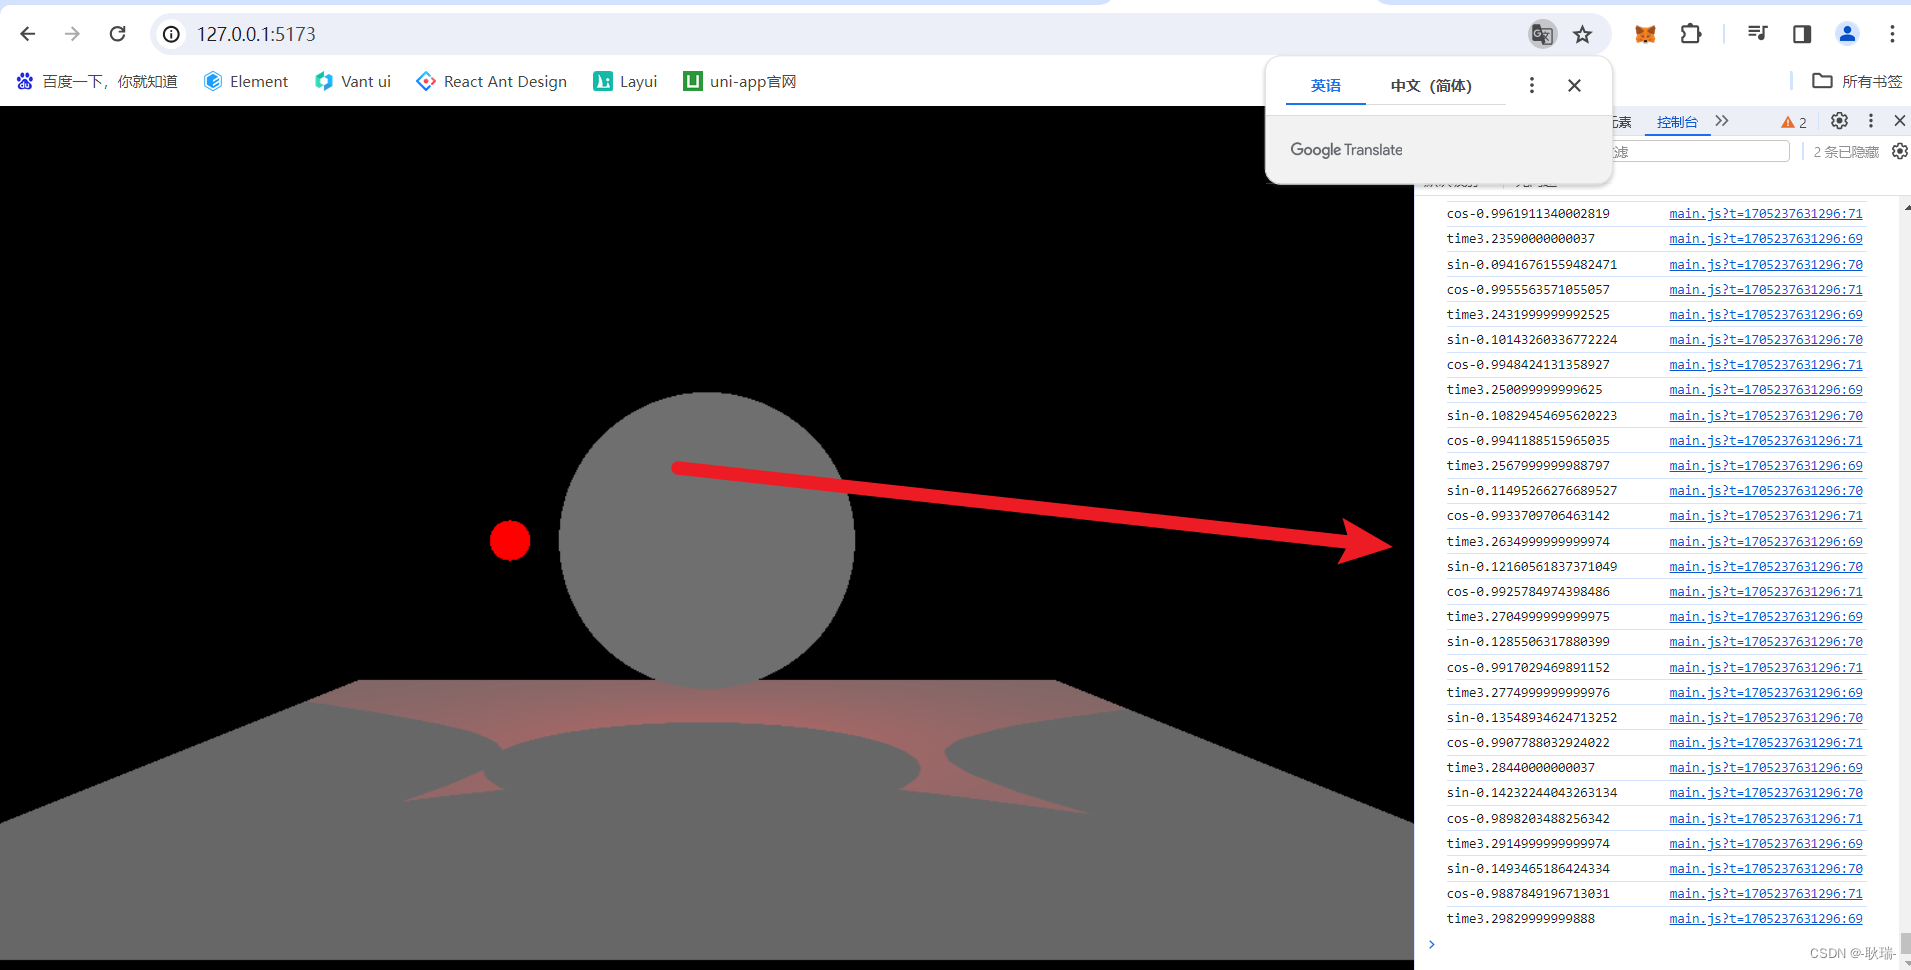
示例效果图

示例源代码(共90行)
/*
* @Author: 大剑师兰特(xiaozhuanlan),还是大剑师兰特(CSDN)
* @此源代码版权归大剑师兰特所有,可供学习或商业项目中借鉴,未经授权,不得重复地发表到博客、论坛,问答,git等公共空间或网站中。
* @Email: 2909222303@qq.com
* @weixin: gis-dajianshi
* @First published in CSDN
* @First published time: 2024-01-15
*/
<template>
	<div class="djs_container">
		<div class="top">
			<h3>canvas创建图像数据,并在画布上展示</h3>
			<div>大剑师兰特, 还是大剑师兰特,gis-dajianshi</div>
			<h4>
				<el-button type="primary" size="mini" @click="draw()">创建图像数据</el-button>
				<el-button type="danger" size="mini" @click="clearCanvas()">清除</el-button>
			</h4>
		</div>
		<div class="dajianshi ">
			<canvas id="dajianshi" ref="mycanvas" width="980" height="490"></canvas>
		</div>

	</div>
</template>
<script>
	export default {
		data() {
			return {
				ctx: null,
				canvas: null,
			}
		},
		mounted() {
			this.setCanvas()
		},
		methods: {
			clearCanvas() {
				this.ctx.clearRect(0, 0, this.canvas.width, this.canvas.height);
			},
			setCanvas() {
				this.canvas = document.getElementById('dajianshi');
				if (!this.canvas.getContext) return;
				this.ctx = this.canvas.getContext("2d");
			},
			draw() {
				this.clearCanvas()
				const imageData = this.ctx.createImageData(300, 200); //设定图像数据的宽、高


				//设定图像的颜色
				for (let i = 0; i < imageData.data.length; i += 4) {
					// Modify pixel data
					imageData.data[i + 0] = 255 * Math.random(); // R value
					imageData.data[i + 1] = 255 * Math.random(); // G value
					imageData.data[i + 2] = 255 * Math.random(); // B value
					imageData.data[i + 3] = 120; // A value
				}
				console.log(imageData);
				//将图像数据放到canvas上显示出来
				this.ctx.putImageData(imageData, 300, 150);

			},

		}
	}
</script>

<style scoped>
	.djs_container {
		width: 1000px;
		height: 680px;
		margin: 50px auto;
		border: 1px solid #994170;
		position: relative;
	}

	.top {
		margin: 0 auto 0px;
		padding: 10px 0;
		background: #994170;
		color: #fff;
	}

	.dajianshi {
		margin: 5px auto 0;
		border: 1px solid #ccc;
		width: 980px;
		height: 490px;
		background-color: #f9f9f9;
	}
</style>
canvas基本属性
| 属性 | 属性 | 属性 |
|---|---|---|
| canvas | fillStyle | filter |
| font | globalAlpha | globalCompositeOperation |
| height | lineCap | lineDashOffset |
| lineJoin | lineWidth | miterLimit |
| shadowBlur | shadowColor | shadowOffsetX |
| shadowOffsetY | strokeStyle | textAlign |
| textBaseline | width |
canvas基础方法
| 方法 | 方法 | 方法 |
|---|---|---|
| arc() | arcTo() | addColorStop() |
| beginPath() | bezierCurveTo() | clearRect() |
| clip() | close() | closePath() |
| createImageData() | createLinearGradient() | createPattern() |
| createRadialGradient() | drawFocusIfNeeded() | drawImage() |
| ellipse() | fill() | fillRect() |
| fillText() | getImageData() | getLineDash() |
| isPointInPath() | isPointInStroke() | lineTo() |
| measureText() | moveTo() | putImageData() |
| quadraticCurveTo() | rect() | restore() |
| rotate() | save() | scale() |
| setLineDash() | setTransform() | stroke() |
| strokeRect() | strokeText() | transform() |
| translate() |