ELK:filebeat日志收集工具和logstash相同
filebeat是一个轻量级的日志收集工具,所使用的系统资源比logstash部署和启动时使用的资源要小的多。
filebeat可以运行在非java环境。他可以代理logstash在非java环境上收集日志
filebeat无法实现数据的过滤,一般是结合logstash的数据过滤功能一块使用
filebeat收集的数据可以发往多个主机。远程收集。
数据流程图:

实验:
20.0.0.10:logstash+kibana+filebeat
20.0.0.20:es1
20.0.0.30:es2
20.0.0.75:mysql
vim /etc/logstash/logstash.yml
64行
path.data: /opt/log
重启服务即可
yum -y install ntpdate
#时间同步
ntpdate ntp.aliyun.com
yum -y install nginx
#安装nginx
开启nginx
vim /usr/local/nginx/html/index.html
this is nginx
到浏览器页面访问测试一下
20.0.0.10:8080
回到10主机
cd filebeat
cp filebeat.yml filebeat.yml.bck
vim filebeat.yml
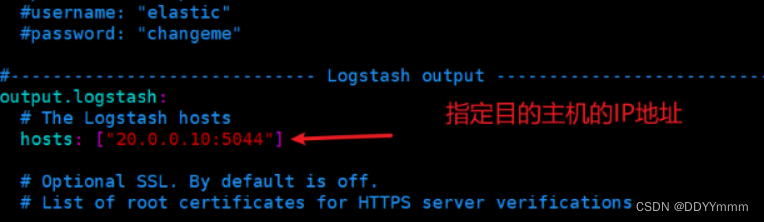
Logstash output部分
output.logstash:解除注释
hosts: ["20.0.0.10:5044"]解除注释
15 filebeat.inputs:
16 - type: log
17 enabled: true
18 paths:
19 - /usr/local/nginx/logs/access.log
20 - /usr/local/nginx/logs/error.log
21 tags: ["nginx"]
22 fields:
23 service_name: 20.0.0.10_nginx
24 log_type: nginx
25 from: 20.0.0.10
cd /opt/log
vim nginx.conf
input {
beats { prot => "5044"}
}
output {
if "nginx" in [tags] {
elasticsearch {
hosts => ["20.0.0.20:9200","20.0.0.30:9200"]
index => "%{[fields][service_name]}"-%{+YYYY.MM.dd}
}
}
stdout {
codec => rubydebug
}
}
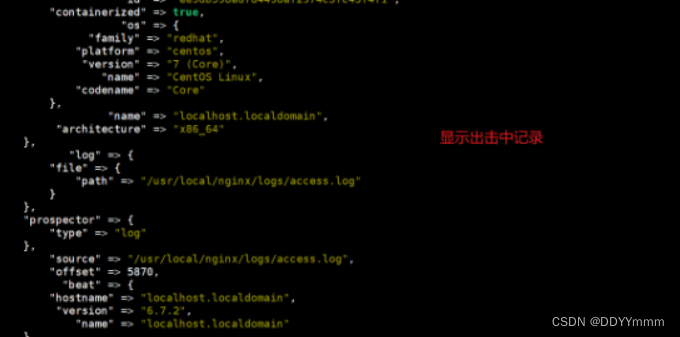
nohup ./filebeat -e -c filebeat.yml > filebeat.out &
#nohup表示在后台记录执行命令的过程
#./filebeat运行文件
#-e使用标准输出同时禁用syslog文件输出
#-c指定配置文件
cd /opt/log
logstash -f file_nginx.conf --path.data /opt/ng3 &

到浏览器测试一下
logstash收集日志的过程:
input(从哪收集)
filter(过滤)
output(发送es实例)
远程收集多个日志
MySQL主机
vim /etc/my.conf
general_log=ON
general_log_file=/usr/local/mysql/data/mysql_general.log
#开启日志功能和指定日志位置
systemctl restart mysqld.service
#重启MySQL服务
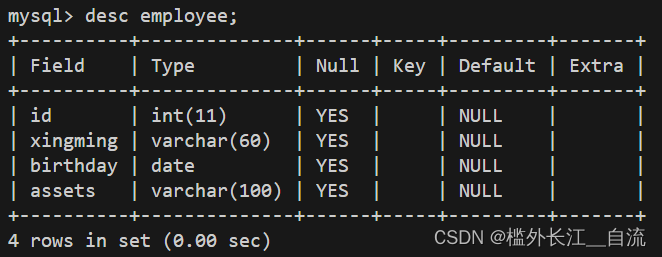
打开MySQL进入创建一个库和一个表给日志创造一点信息
yum -y install httpd
#安装httpd服务
yum -y install nginx
#安装nginx服务
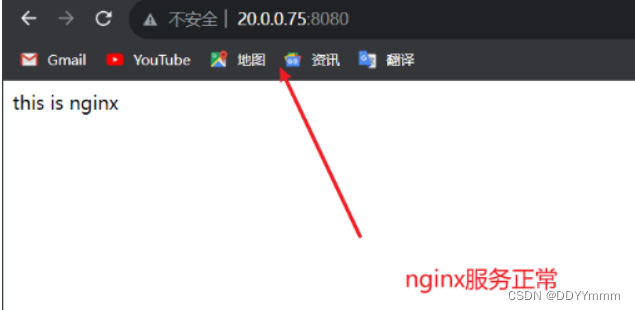
修改nginx的端口号为8080
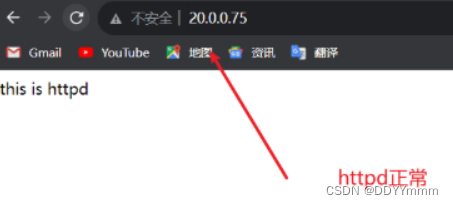
到浏览器访问测试一下httpd和nginx
20.0.0.75:80
20.0.0.75:8080
在MySQL主机上安装filebeat
cd filebeat
cp filebeat.yml filebeat.yml.bak
vim filebeat.yml
打开optput
hosts: [20.0.0.10]
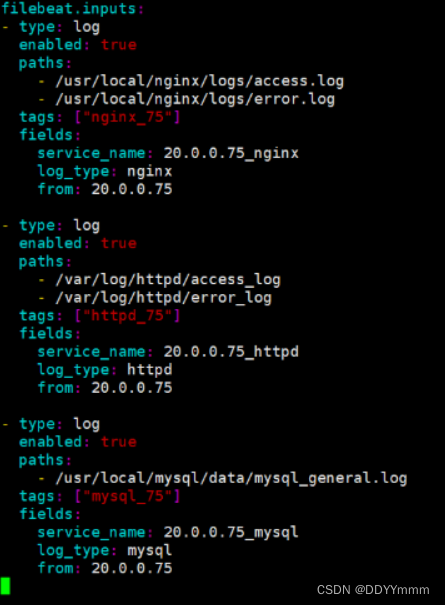
filebeat.inputs:
- type: log
enabled: true
paths:
- /usr/local/nginx/logs/access.log
- /usr/local/nginx/logs/error.log
type: ["nginx_75"]
fields:
service_name: 20.0.0.75_nginx
log_type: nginx
from: 20.0.0.75
- type: log
enabled: true
paths:
- /var/log/httpd/access.log
- /var/log/httpd/error.log
type: ["httpd_75"]
fields:
service_name: 20.0.0.75_httpd
log_type: httpd
from: 20.0.0.75
- type: log
enabled: true
paths:
- /usr/local/mysql/data/mysql_general.log
type: ["mysql_75"]
fields:
service_name: 20.0.0.75_mysql
log_type: mysql
from: 20.0.0.75
回到elk主机
cd /opt/log
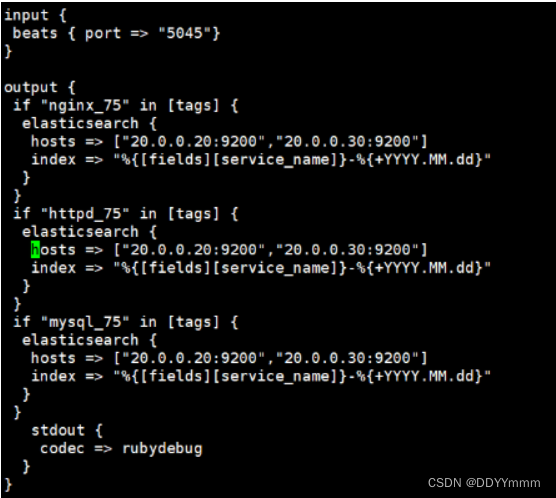
vim nhm_75.conf
input {
beats { port => "5045"}
}
output {
if "nginx_75" in [tags] {
elasticsearch {
hosts => ["20.0.0.20:9200","20.0.0.30:9200"]
index => "%{[fields][service_name]}-%{+YYYY.MM.dd}"
}
}
if "httpd_75" in [tags] {
elasticsearch {
hosts => ["20.0.0.20:9200","20.0.0.30:9200"]
index => "%{[fields][service_name]}-%{+YYYY.MM.dd}"
}
}
if "mysql_75" in [tags] {
elasticsearch {
hosts => ["20.0.0.20:9200","20.0.0.30:9200"]
index => "%{[fields][service_name]}-%{+YYYY.MM.dd}"
}
}
stdout {
codec => rubydebug
}
}
回到MySQL主机
nohup ./filebeat -e -c filebeat.yml > filebeat.out &
回到elk主机
logstash -f nhm_75.conf --path.data /opt/nhm
回到MySQL主机修改端口号
hosts: ["20.0.0.75:5045"]
nohup ./filebeat -e -c filebeat.yml > filebeat.out &
到elk主机
logstash -f nhm.conf --path.data /opt/nhm2 &
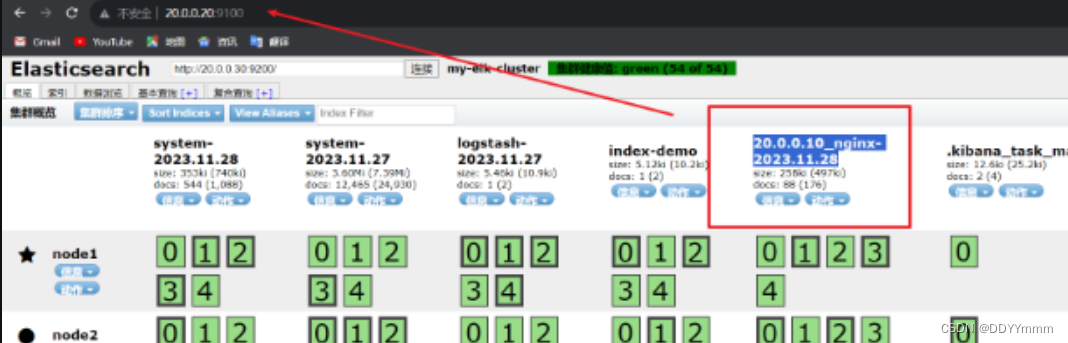
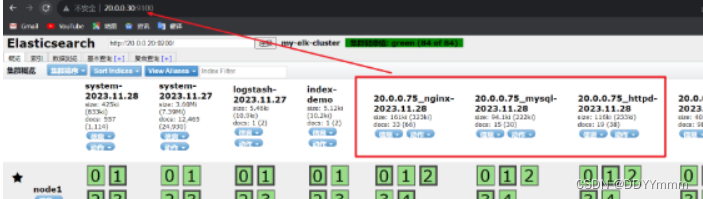
到浏览器查看一下es索引是否创建成功
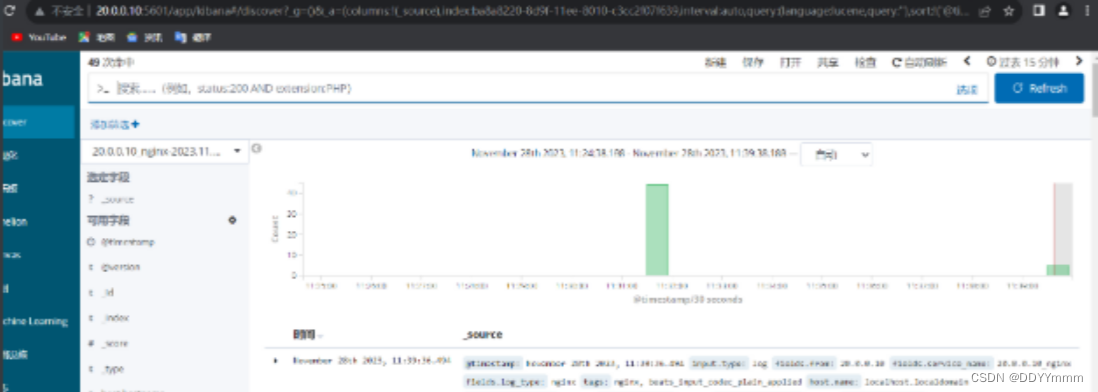
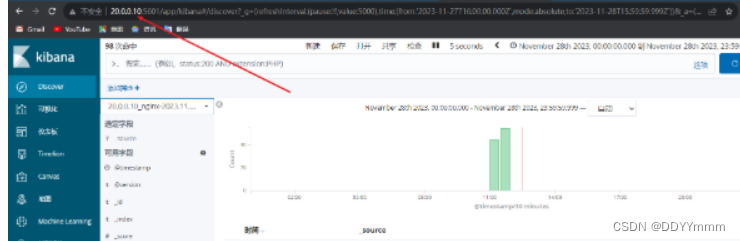
再到kibana上创建索引查看是否有日志记录
logstash性能优化:
logstash启动是在jvm虚拟机当中其中,启动一次至少500M内存。
vim /etc/logstash/logstash.yml
41行
pipeline.workers: 2
#定义了logstash的工作线程,默认值就是cpu数。4核最好给2,8核给2,给一半即可
pipline.batch.size: 125
#一次性批量处理检索时间的大小
#125是条数。可以根据自行修改
50行
pipeline.batch.delay: 50
#查询更新的延迟
#50是50毫秒,也可也自行调整
#生产中一般10-15毫秒。也要看机器性能