< pieChartNormal : opt= "contractStatics" style= "width: 100%;height: 100%;" / >
import pieChartNormal from "./components/pieChartNormal" ;
data ( ) {
return {
contractStatics : {
seriesData : [ {
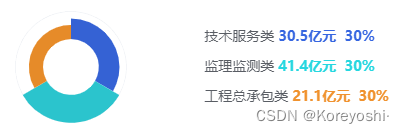
name : '技术服务类' ,
value : 30.5 ,
itemStyle : {
color : '#3562D4' ,
} ,
} ,
{
name : '监理监测类' ,
value : 41.4 ,
itemStyle : {
color : '#2BC4CD' ,
} ,
} ,
{
name : '工程总承包类' ,
value : 21.1 ,
itemStyle : {
color : '#E68B29' ,
} ,
} ] ,
}
}
}
< template>
< div style= "width: 100%;height: 100%;" >
< ChartPanel ref= "chart" : option= "options" : style= "opt.yAxisName ? 'height:calc(100% - 16px)' : ''" > < / ChartPanel>
< / div>
< / template>
< script>
import * as echarts from 'echarts'
import ChartPanel from '@/components/ChartPanel' ;
export default {
components : {
ChartPanel
} ,
props : {
opt : {
type : Object,
default ( ) {
return { }
}
}
} ,
data ( ) {
return {
options : null
}
} ,
watch : {
opt : {
deep : true ,
immediate : true ,
handler ( val ) {
this . getOpt ( val)
}
}
} ,
methods : {
getOpt ( val ) {
let {
seriesData
} = val
let color = [ '#3666E0' , '#26D7E0' , '#F0922E' ]
this . options = {
animation : true ,
legend : {
orient : 'vertical' ,
show : true ,
x : '40%' ,
y : 'center' ,
itemWidth : 0 ,
itemHeight : 0 ,
textStyle : {
color : '#595D64' ,
fontSize : 14 ,
lineHeight : 20 ,
rich : {
percent0 : {
color : color[ 0 ] ,
fontSize : 14 ,
fontWeight : 700
} ,
percent1 : {
color : color[ 1 ] ,
fontSize : 14 ,
fontWeight : 700
} ,
percent2 : {
color : color[ 2 ] ,
fontSize : 14 ,
fontWeight : 700
} ,
} ,
} ,
formatter : name => {
let dataIndex = 0
let obj = ( seriesData. filter ( ( item, index ) => {
if ( item. name == name) {
dataIndex = index
return item
}
} ) ) [ 0 ]
return obj. name + ' {percent' + dataIndex + '|' + obj. value + '亿元} ' +
' {percent' + dataIndex + '|30%}'
} ,
} ,
tooltip : {
borderWidth : 0 ,
show : true ,
formatter : params => {
if ( params. seriesName != '内边线' ) {
return ` <div style="font-weight:700"> ${ params. name} </div>
<div>
<span style="color: ${ params. color} ;font-weight:700"> ${ params. value} 亿元 ${ params. percent} %</span>
</div>
` }
}
} ,
series : [
{
type : 'pie' ,
roseType : 'area' ,
radius : [ '45%' , '90%' ] ,
center : [ '15%' , '50%' ] ,
hoverAnimation : false ,
z : 10 ,
color : color,
label : {
show : false ,
} ,
data : seriesData,
labelLine : {
show : false ,
} ,
} ,
{
type : "pie" ,
name : '内边线' ,
center : [ "15%" , "50%" ] ,
radius : [ "89%" , "90%" ] ,
label : {
show : false
} ,
hoverAnimation : false ,
data : [ {
value : 1 ,
itemStyle : {
normal : {
color : 'rgba(242, 244, 247, 1)'
}
}
} ]
} ,
] ,
} ;
this . $nextTick ( ( ) => {
this . $refs. chart. initChart ( echarts, chart => {
this . options && chart. setOption ( this . options, true ) ;
} ) ;
} )
}
}
}
< / script>


![详解—C++ [异常]](https://img-blog.csdnimg.cn/direct/a6c938f57af54fe8a52422eb0fb9f79f.png)