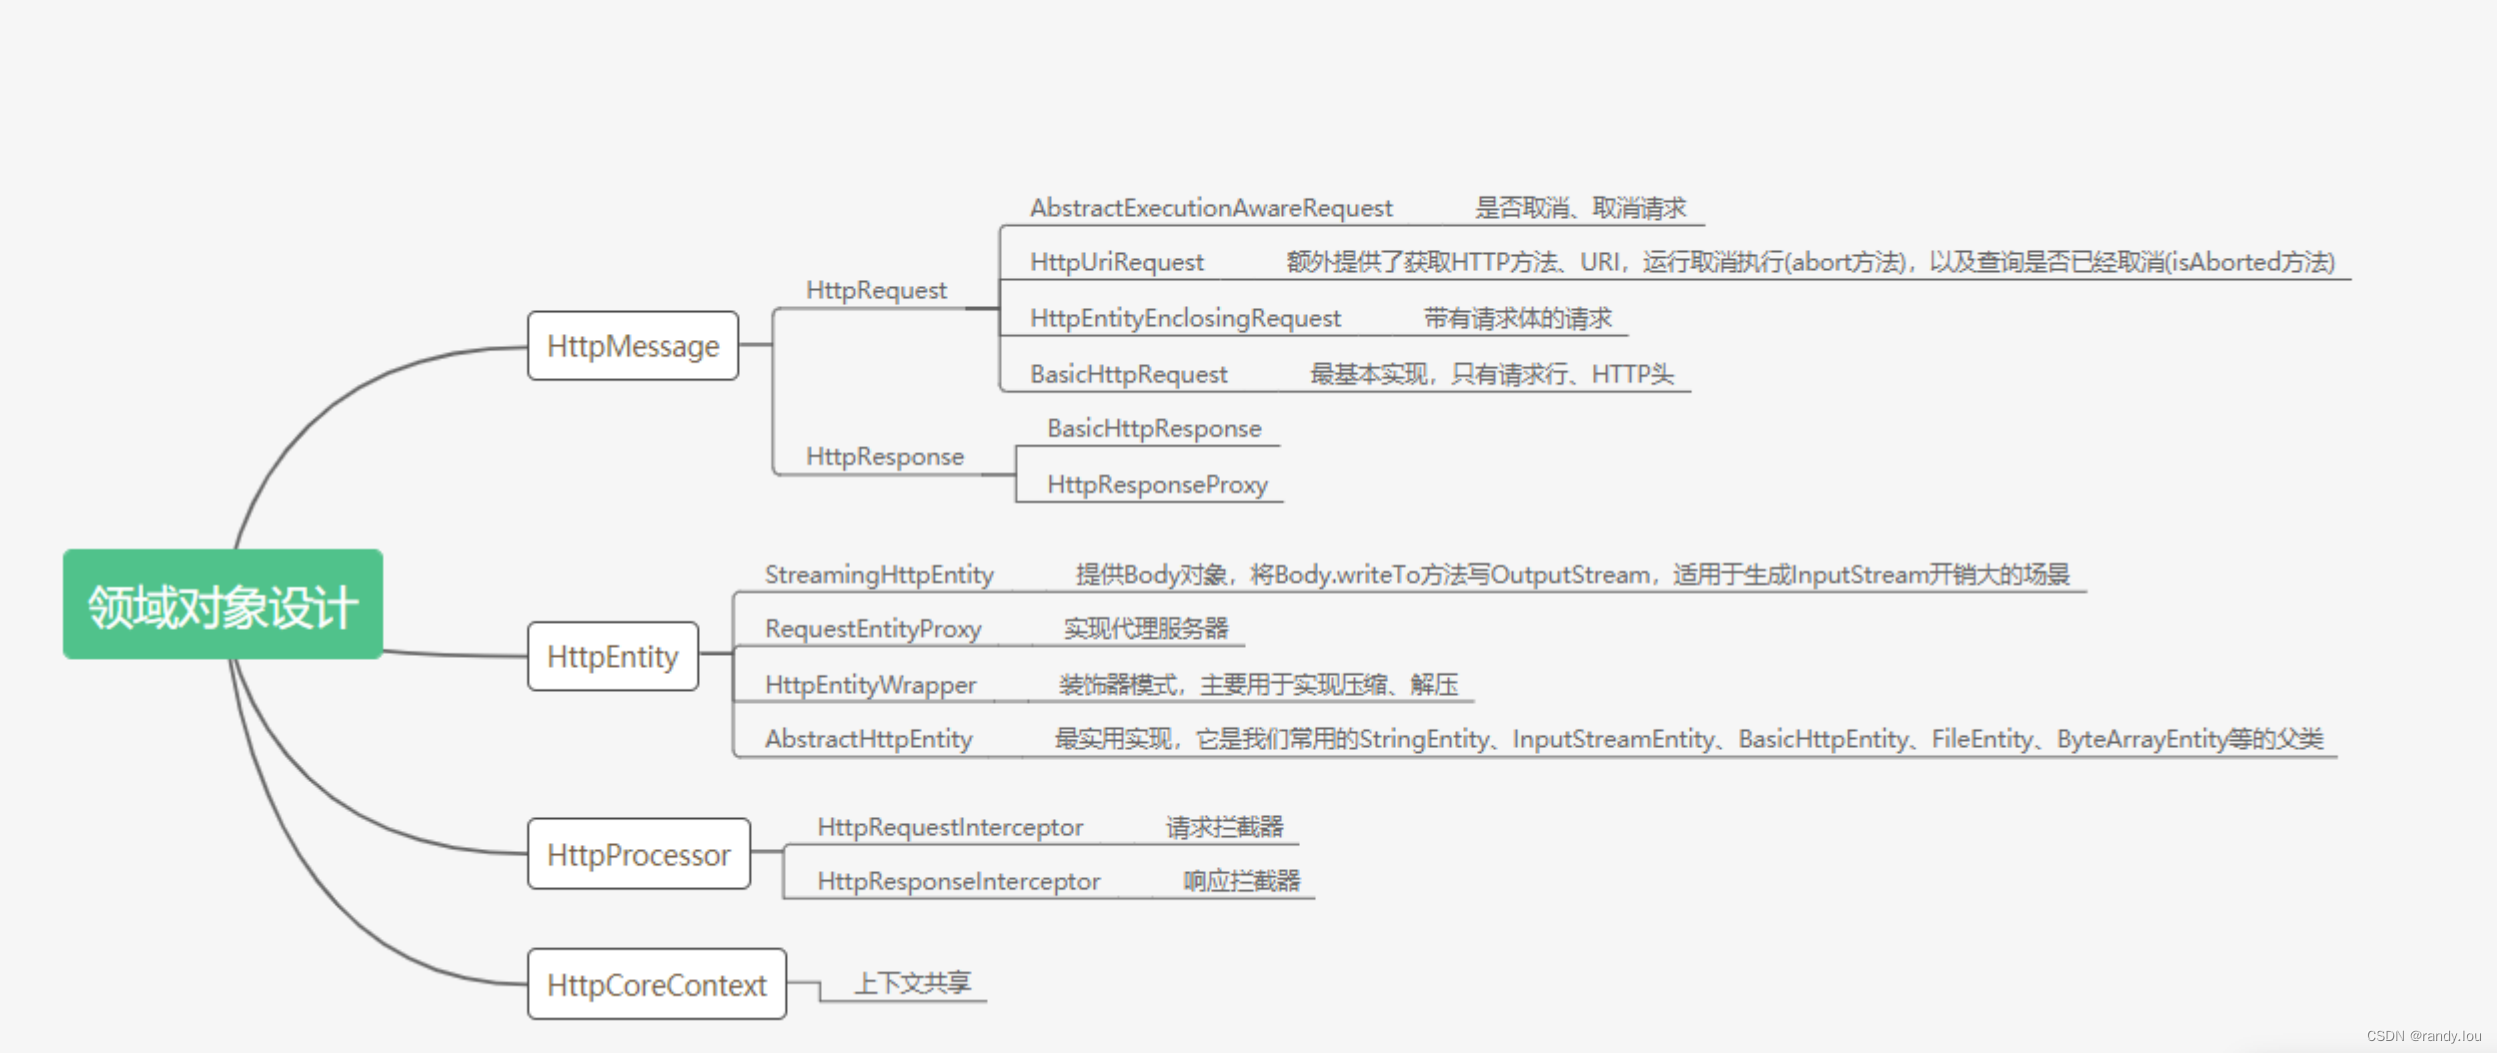
Setttings> Build, Execution,Deployment>Debugger> Data Views> Java
取消 Enable "toString()" object view;

Speed up debugging in IntelliJ
Yesterday, I observed painfully slow debugging in IntelliJ. Every step over or step in took almost 10 seconds to perform.
It was a simple Java console application having about some 88k entries in few arrays. I had successfully debugged applications having millions of entries in arrays, lists and maps before without any performance issues.
Then I looked at the
toString()implementation of the custom object which I was holding in the arraypublic String toString() { StringBuilder s = new StringBuilder(); s.append(V + " vertices, " + E + " edges " + NEWLINE); for (int v = 0; v < V; v++) { s.append(String.format("%d: ", v)); for (int w : adj[v]) { s.append(String.format("%d ", w)); } s.append(NEWLINE); } return s.toString(); }This
toString()implementation was looping over all the 88k items and IntelliJ is configured to evaluatetoString()after every step.Turning off the setting
Enable toString() data viewssolved this problem of slow debugging.Incase you are experiencing slow debugging issues on IntelliJ, do make sure that this setting is turned off.
参考:
Speed up debugging in IntelliJ – Madhur Ahuja






![二叉树的层序遍历[中等]](https://img-blog.csdnimg.cn/direct/28fbc84b21fa4685ad55efbcf90b82b1.png)
![【算法每日一练]-图论(保姆级教程篇12 tarjan篇)#POJ3352道路建设 #POJ2553图的底部 #POJ1236校园网络 #缩点](https://img-blog.csdnimg.cn/f68d05a84ef541f595c0886ca4d6a348.png)
![[ndss 2023]确保联邦敏感主题分类免受中毒攻击](https://img-blog.csdnimg.cn/direct/8163200e253d4d4ca31a599048128579.png)


