centos7国内阿里源安装docker
1、安装必要的系统工具
sudo yum install -y yum-utils device-mapper-persistent-data lvm2
2添加官方仓库
sudo yum-config-manager --add-repo https://mirrors.aliyun.com/docker-ce/linux/centos/docker-ce.repo
sudo sed -i 's+download.docker.com+mirrors.aliyun.com/docker-ce+' /etc/yum.repos.d/docker-ce.repo
3、更新并安装Docker-CE
sudo yum makecache fast
sudo yum -y install docker-ce
4、开启Docker服务
sudo systemctl start docker
5、查看docker状态
sudo systemctl status docker

6、查看docker状态
docker --version
安装influxdb
1、下载influxDB镜像
安装最新版本
docker pull influxdb
安装固定版本(比如这里安装1.8版本)
docker pull influxdb:1.8
2、 启动influxDB容器
用以下命令,如果未下载influxdb镜像,则系统自动下载最新的influxdb镜像,其中jmeterdb为自己起的容器名称。
docker run -d -p 8086:8086 -p 8083:8083 --name=jmeterdb influxdb
启动固定版本的influxDB容器则用以下命令(如启动influxdb:1.8版本):
docker run -d -p 8086:8086 -p 8083:8083 --name=jmeterdb influxdb:1.8
3、查看influxDB容器
docker ps -a

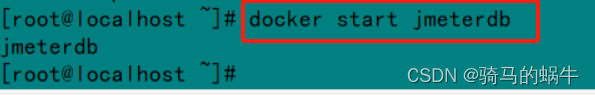
4、启动influxDB容器
docker start [docker container id]
5、进入influxDB容器
docker exec -it jmeterdb bash

6、进入influxDB数据库
在influxdb容器内执行:influx

7、创建jmeter数据数据库
create database jmeter

配置jmeter
添加后端监听器(Jmeter BackEnd Listenter)----Backend Listener implementation选择“org.apache.jmeter.visualizers.backend.influxdb.influxdbBackendListenerClient”----修改influxdbUrl

测试jmeter与influxDB是否连通
1、添加Jmeter请求

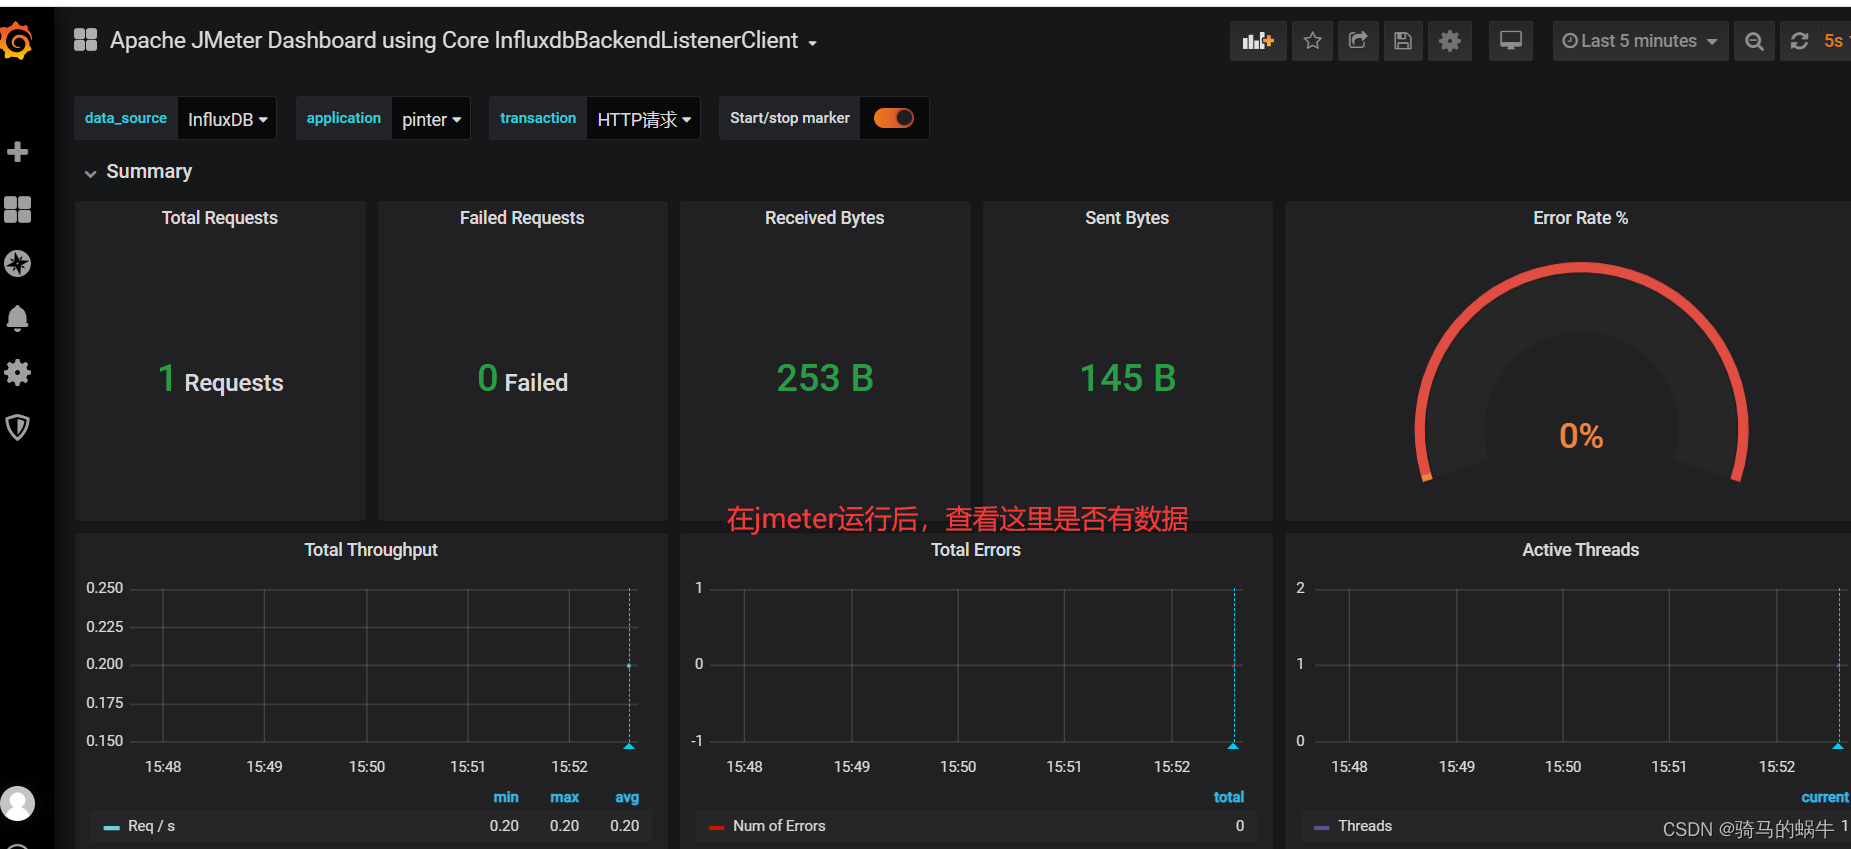
2、运行线程组后,在influxdb的jmeter数据库查询是否有数据

安装granfana
1、 下载grafana镜像
下载最新的镜像:
docker pull grafana/grafana相同于docker pull grafana/grafana:lastest
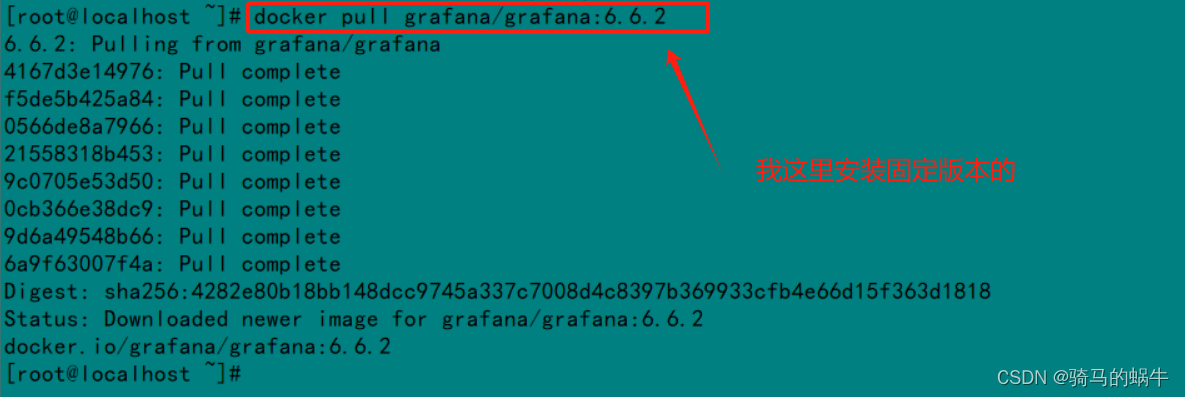
安装固定版本:
docker pull grafana/grafana:6.6.2
2、查看grafana镜像是否下载成功
docker images

3、启动grafana镜像
docker run -d -p 3000:3000 --name=jmeterGraf grafana/grafana:6.6.2

3、查看grafana镜像是否启动成功
docker ps

4、 浏览器输入linux的IP+grafana(我这里是3000)进行访问,验证grafana运行正常

输入 默认用户名/密码:admin/admin进入系统

配置granfana
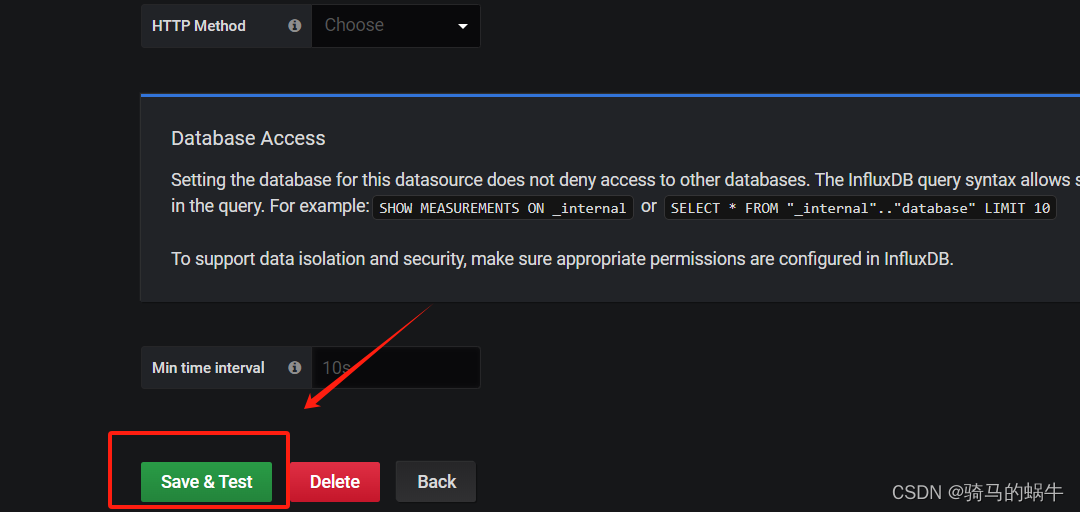
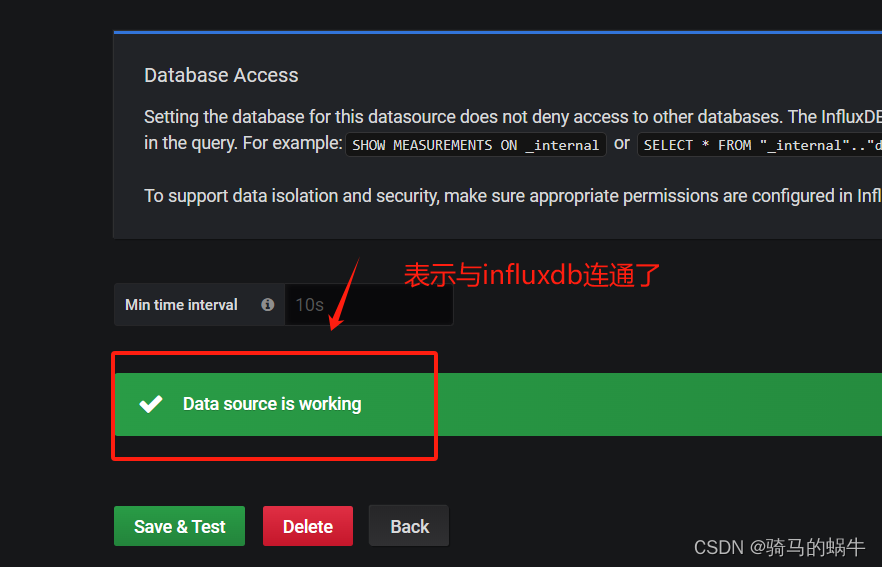
1、 在Grafana中添加数据源


输入url:http://[hostname or IP]:8086


保存

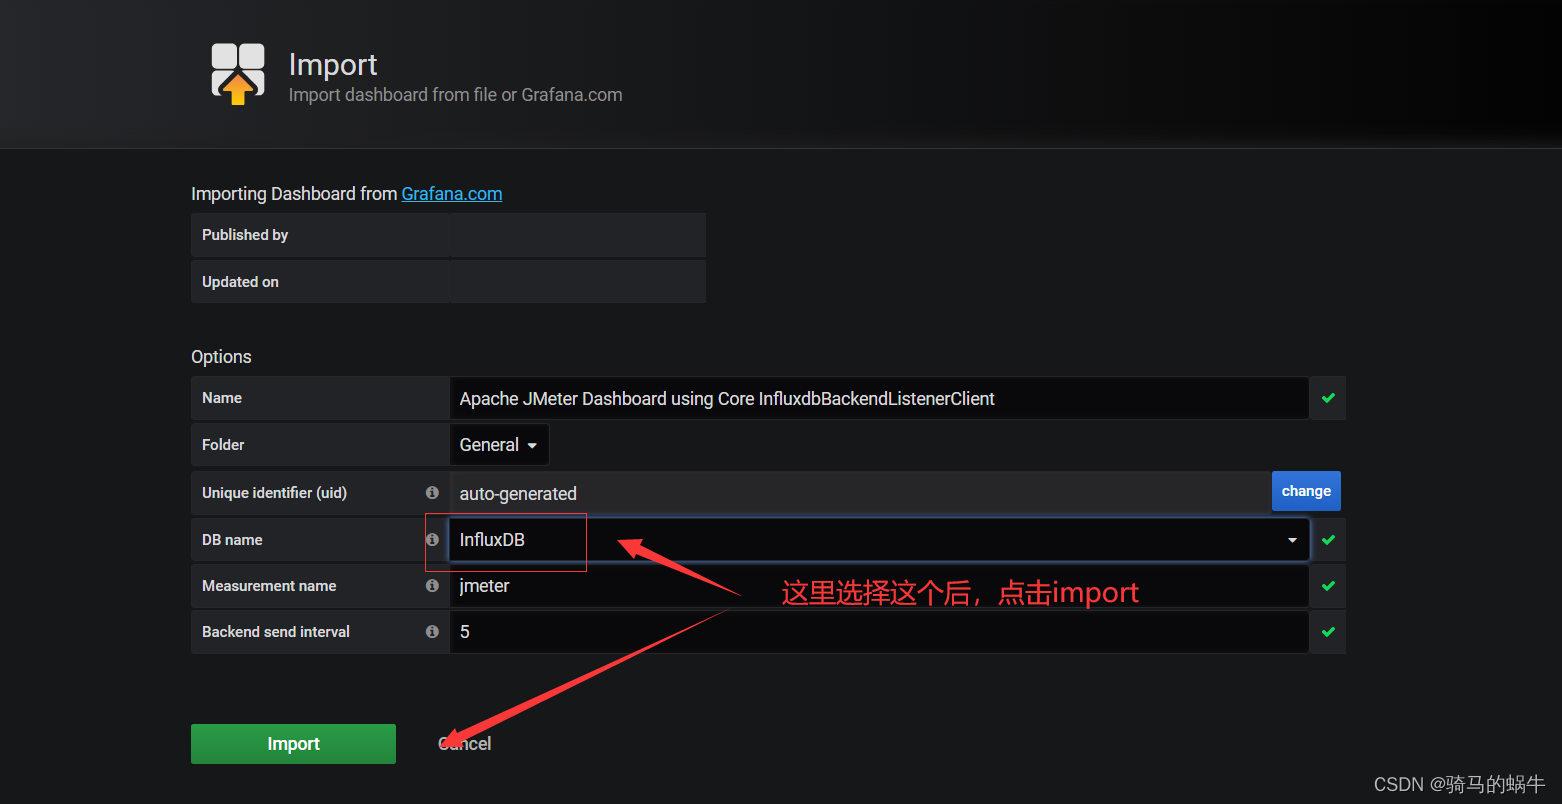
选择import

浏览器访问:https://grafana.com/grafana/dashboards ,在页面中搜索 node exporter ,选择适合的面板,点击 Copy ID 或者 Download JSON,也可以用我提供的

{
"__inputs": [
{
"name": "JMETER_DASHBOARD",
"label": "DB name",
"description": "Create a Datasource in Grafana that points to jmeter database",
"type": "datasource",
"pluginId": "influxdb",
"pluginName": "InfluxDB"
},
{
"name": "VAR_MEASUREMENT_NAME",
"type": "constant",
"label": "Measurement name",
"value": "jmeter",
"description": "InfluxDB measurement name"
},
{
"name": "VAR_SEND_INTERVAL",
"type": "constant",
"label": "Backend send interval",
"value": "5",
"description": "in second, should match JMeter property \"backend_influxdb.send_interval\""
}
],
"__requires": [
{
"type": "grafana",
"id": "grafana",
"name": "Grafana",
"version": "4.6.2"
},
{
"type": "datasource",
"id": "influxdb",
"name": "InfluxDB",
"version": "1.4.0"
},
{
"type": "panel",
"id": "graph",
"name": "Graph",
"version": ""
},
{
"type": "panel",
"id": "singlestat",
"name": "Singlestat",
"version": ""
},
{
"type": "panel",
"id": "table",
"name": "Table",
"version": ""
}
],
"annotations": {
"list": [
{
"$$hashKey": "object:4298",
"builtIn": 1,
"datasource": "$data_source",
"enable": true,
"hide": false,
"iconColor": "rgba(0, 211, 255, 1)",
"limit": 100,
"name": "Start/stop marker",
"query": "select text from events where $timeFilter",
"showIn": 0,
"textColumn": "",
"type": "dashboard"
}
]
},
"description": "Monitor your Apache JMeter load test in real time with InfluxDB and Grafana.\r\nGet overall summary, errors details and particular transaction response times.",
"editable": true,
"gnetId": 5496,
"graphTooltip": 0,
"id": 5,
"iteration": 1523369228272,
"links": [],
"panels": [
{
"collapsed": false,
"gridPos": {
"h": 1,
"w": 24,
"x": 0,
"y": 0
},
"id": 33,
"panels": [],
"repeat": null,
"title": "Summary",
"type": "row"
},
{
"cacheTimeout": null,
"colorBackground": false,
"colorValue": true,
"colors": [
"#299c46",
"#e5ac0e",
"#d44a3a"
],
"datasource": "$data_source",
"decimals": 0,
"format": "none",
"gauge": {
"maxValue": 100,
"minValue": 0,
"show": false,
"thresholdLabels": false,
"thresholdMarkers": true
},
"gridPos": {
"h": 7,
"w": 4,
"x": 0,
"y": 1
},
"height": "",
"id": 26,
"interval": "[[send_interval]]s",
"links": [],
"mappingType": 1,
"mappingTypes": [
{
"name": "value to text",
"value": 1
},
{
"name": "range to text",
"value": 2
}
],
"maxDataPoints": 100,
"nullPointMode": "connected",
"nullText": null,
"postfix": " Requests",
"postfixFontSize": "50%",
"prefix": "",
"prefixFontSize": "50%",
"rangeMaps": [
{
"from": "null",
"text": "N/A",
"to": "null"
}
],
"sparkline": {
"fillColor": "rgba(31, 118, 189, 0.18)",
"full": false,
"lineColor": "#e5ac0e",
"show": false
},
"tableColumn": "",
"targets": [
{
"dsType": "influxdb",
"groupBy": [
{
"params": [
"$__interval"
],
"type": "time"
},
{
"params": [
"null"
],
"type": "fill"
}
],
"orderByTime": "ASC",
"policy": "default",
"query": "SELECT sum(\"count\") FROM \"$measurement_name\" WHERE (\"application\" =~ /^$application$/ AND \"transaction\" = 'all') AND $timeFilter GROUP BY time($__interval) fill(null)",
"rawQuery": true,
"refId": "A",
"resultFormat": "time_series",
"select": [
[
{
"params": [
"value"
],
"type": "field"
},
{
"params": [],
"type": "mean"
}
]
],
"tags": []
}
],
"thresholds": "",
"title": "Total Requests",
"type": "singlestat",
"valueFontSize": "80%",
"valueMaps": [
{
"op": "=",
"text": "0",
"value": "null"
}
],
"valueName": "total"
},
{
"cacheTimeout": null,
"colorBackground": false,
"colorValue": true,
"colors": [
"#299c46",
"#e24d42",
"#d44a3a"
],
"datasource": "$data_source",
"decimals": 0,
"format": "none",
"gauge": {
"maxValue": 100,
"minValue": 0,
"show": false,
"thresholdLabels": false,
"thresholdMarkers": true
},
"gridPos": {
"h": 7,
"w": 4,
"x": 4,
"y": 1
},
"height": "",
"id": 28,
"interval": "[[send_interval]]s",
"links": [],
"mappingType": 1,
"mappingTypes": [
{
"name": "value to text",
"value": 1
},
{
"name": "range to text",
"value": 2
}
],
"maxDataPoints": 100,
"nullPointMode": "connected",
"nullText": null,
"postfix": " Failed",
"postfixFontSize": "50%",
"prefix": "",
"prefixFontSize": "50%",
"rangeMaps": [
{
"from": "null",
"text": "N/A",
"to": "null"
}
],
"sparkline": {
"fillColor": "rgba(31, 118, 189, 0.18)",
"full": false,
"lineColor": "#bf1b00",
"show": false
},
"tableColumn": "",
"targets": [
{
"dsType": "influxdb",
"groupBy": [
{
"params": [
"$__interval"
],
"type": "time"
},
{
"params": [
"null"
],
"type": "fill"
}
],
"orderByTime": "ASC",
"policy": "default",
"query": "SELECT sum(\"countError\") FROM \"$measurement_name\" WHERE (\"transaction\" = 'all' AND \"application\" =~ /^$application$/) AND $timeFilter GROUP BY time($__interval) fill(null)",
"rawQuery": true,
"refId": "A",
"resultFormat": "time_series",
"select": [
[
{
"params": [
"value"
],
"type": "field"
},
{
"params": [],
"type": "mean"
}
]
],
"tags": []
}
],
"thresholds": "",
"title": "Failed Requests",
"type": "singlestat",
"valueFontSize": "80%",
"valueMaps": [
{
"op": "=",
"text": "0",
"value": "null"
}
],
"valueName": "total"
},
{
"cacheTimeout": null,
"colorBackground": false,
"colorValue": true,
"colors": [
"#299c46",
"#e24d42",
"#d44a3a"
],
"datasource": "$data_source",
"decimals": 0,
"format": "bytes",
"gauge": {
"maxValue": 100,
"minValue": 0,
"show": false,
"thresholdLabels": false,
"thresholdMarkers": true
},
"gridPos": {
"h": 7,
"w": 4,
"x": 8,
"y": 1
},
"height": "",
"id": 38,
"interval": "[[send_interval]]s",
"links": [],
"mappingType": 1,
"mappingTypes": [
{
"name": "value to text",
"value": 1
},
{
"name": "range to text",
"value": 2
}
],
"maxDataPoints": 100,
"nullPointMode": "connected",
"nullText": null,
"postfix": " ",
"postfixFontSize": "50%",
"prefix": "",
"prefixFontSize": "50%",
"rangeMaps": [
{
"from": "null",
"text": "N/A",
"to": "null"
}
],
"sparkline": {
"fillColor": "rgba(31, 118, 189, 0.18)",
"full": false,
"lineColor": "#bf1b00",
"show": false
},
"tableColumn": "",
"targets": [
{
"dsType": "influxdb",
"groupBy": [
{
"params": [
"$__interval"
],
"type": "time"
},
{
"params": [
"null"
],
"type": "fill"
}
],
"orderByTime": "ASC",
"policy": "default",
"query": "SELECT sum(\"rb\") FROM \"$measurement_name\" WHERE (\"transaction\" = 'all' AND \"application\" =~ /^$application$/) AND $timeFilter ",
"rawQuery": true,
"refId": "A",
"resultFormat": "time_series",
"select": [
[
{
"params": [
"value"
],
"type": "field"
},
{
"params": [],
"type": "mean"
}
]
],
"tags": []
}
],
"thresholds": "",
"title": "Received Bytes",
"type": "singlestat",
"valueFontSize": "80%",
"valueMaps": [
{
"op": "=",
"text": "0",
"value": "null"
}
],
"valueName": "total"
},
{
"cacheTimeout": null,
"colorBackground": false,
"colorValue": true,
"colors": [
"#299c46",
"#e24d42",
"#d44a3a"
],
"datasource": "$data_source",
"decimals": 0,
"format": "bytes",
"gauge": {
"maxValue": 100,
"minValue": 0,
"show": false,
"thresholdLabels": false,
"thresholdMarkers": true
},
"gridPos": {
"h": 7,
"w": 4,
"x": 12,
"y": 1
},
"height": "",
"id": 37,
"interval": "[[send_interval]]s",
"links": [],
"mappingType": 1,
"mappingTypes": [
{
"name": "value to text",
"value": 1
},
{
"name": "range to text",
"value": 2
}
],
"maxDataPoints": 100,
"nullPointMode": "connected",
"nullText": null,
"postfix": " ",
"postfixFontSize": "50%",
"prefix": "",
"prefixFontSize": "50%",
"rangeMaps": [
{
"from": "null",
"text": "N/A",
"to": "null"
}
],
"sparkline": {
"fillColor": "rgba(31, 118, 189, 0.18)",
"full": false,
"lineColor": "#bf1b00",
"show": false
},
"tableColumn": "",
"targets": [
{
"dsType": "influxdb",
"groupBy": [
{
"params": [
"$__interval"
],
"type": "time"
},
{
"params": [
"null"
],
"type": "fill"
}
],
"orderByTime": "ASC",
"policy": "default",
"query": "SELECT max(\"sb\") FROM \"$measurement_name\" WHERE (\"transaction\" = 'all' AND \"application\" =~ /^$application$/) AND $timeFilter GROUP BY time($__interval) fill(null)",
"rawQuery": true,
"refId": "A",
"resultFormat": "time_series",
"select": [
[
{
"params": [
"value"
],
"type": "field"
},
{
"params": [],
"type": "mean"
}
]
],
"tags": []
}
],
"thresholds": "",
"title": "Sent Bytes",
"type": "singlestat",
"valueFontSize": "80%",
"valueMaps": [
{
"op": "=",
"text": "0",
"value": "null"
}
],
"valueName": "total"
},
{
"cacheTimeout": null,
"colorBackground": false,
"colorValue": true,
"colors": [
"#299c46",
"#ef843c",
"#e24d42"
],
"datasource": "$data_source",
"decimals": 2,
"format": "percentunit",
"gauge": {
"maxValue": 1,
"minValue": 0,
"show": true,
"thresholdLabels": false,
"thresholdMarkers": true
},
"gridPos": {
"h": 7,
"w": 8,
"x": 16,
"y": 1
},
"id": 29,
"interval": "[[send_interval]]s",
"links": [],
"mappingType": 1,
"mappingTypes": [
{
"name": "value to text",
"value": 1
},
{
"name": "range to text",
"value": 2
}
],
"maxDataPoints": 100,
"nullPointMode": "connected",
"nullText": null,
"postfix": "",
"postfixFontSize": "50%",
"prefix": "",
"prefixFontSize": "50%",
"rangeMaps": [
{
"from": "null",
"text": "N/A",
"to": "null"
}
],
"sparkline": {
"fillColor": "rgba(31, 118, 189, 0.18)",
"full": false,
"lineColor": "rgb(31, 120, 193)",
"show": false
},
"tableColumn": "",
"targets": [
{
"dsType": "influxdb",
"groupBy": [
{
"params": [
"$__interval"
],
"type": "time"
},
{
"params": [
"null"
],
"type": "fill"
}
],
"orderByTime": "ASC",
"policy": "default",
"query": "SELECT sum(\"error\") / sum(\"all\") FROM (SELECT sum(\"count\") AS \"all\" FROM \"$measurement_name\" WHERE \"transaction\" = 'all' AND \"application\" =~ /^$application$/ AND $timeFilter GROUP BY time($__interval) fill(null)), (SELECT sum(\"countError\") AS \"error\" FROM \"$measurement_name\" WHERE \"transaction\" = 'all' AND \"application\" =~ /^$application$/ AND $timeFilter GROUP BY time($__interval) fill(null))",
"rawQuery": true,
"refId": "A",
"resultFormat": "time_series",
"select": [
[
{
"params": [
"value"
],
"type": "field"
},
{
"params": [],
"type": "mean"
}
]
],
"tags": []
}
],
"thresholds": "0,0.01",
"title": "Error Rate %",
"type": "singlestat",
"valueFontSize": "50%",
"valueMaps": [
{
"op": "=",
"text": "0",
"value": "null"
}
],
"valueName": "total"
},
{
"aliasColors": {
"No of Errors": "#6ED0E0",
"Req / s": "#6ed0e0",
"Req / sec": "#65c5db"
},
"bars": false,
"dashLength": 10,
"dashes": false,
"datasource": "$data_source",
"decimals": 2,
"editable": true,
"error": false,
"fill": 7,
"gridPos": {
"h": 7,
"w": 8,
"x": 0,
"y": 8
},
"id": 4,
"interval": "[[send_interval]]s",
"legend": {
"alignAsTable": true,
"avg": true,
"current": false,
"max": true,
"min": true,
"rightSide": false,
"show": true,
"sort": null,
"sortDesc": null,
"total": false,
"values": true
},
"lines": true,
"linewidth": 1,
"links": [],
"nullPointMode": "null",
"percentage": false,
"pointradius": 1,
"points": false,
"renderer": "flot",
"seriesOverrides": [],
"spaceLength": 10,
"stack": false,
"steppedLine": false,
"targets": [
{
"alias": "Req / s",
"dsType": "influxdb",
"groupBy": [
{
"params": [
"$__interval"
],
"type": "time"
}
],
"measurement": "jmeter",
"orderByTime": "ASC",
"policy": "default",
"query": "SELECT mean(\"count\") / $send_interval FROM \"$measurement_name\" WHERE (\"transaction\" = 'all' AND \"application\" =~ /^$application$/) AND $timeFilter GROUP BY time($__interval) fill(null)",
"rawQuery": true,
"refId": "B",
"resultFormat": "time_series",
"select": [
[
{
"params": [
"count"
],
"type": "field"
},
{
"params": [],
"type": "last"
}
]
],
"tags": [
{
"key": "transaction",
"operator": "=",
"value": "all"
},
{
"condition": "AND",
"key": "application",
"operator": "=~",
"value": "/^$application$/"
}
]
}
],
"thresholds": [],
"timeFrom": null,
"timeShift": null,
"title": "Total Throughput",
"tooltip": {
"msResolution": false,
"shared": true,
"sort": 0,
"value_type": "individual"
},
"type": "graph",
"xaxis": {
"buckets": null,
"mode": "time",
"name": null,
"show": true,
"values": []
},
"yaxes": [
{
"format": "short",
"label": null,
"logBase": 1,
"max": null,
"min": null,
"show": true
},
{
"format": "short",
"label": null,
"logBase": 1,
"max": null,
"min": null,
"show": false
}
]
},
{
"aliasColors": {
"No of Errors": "#BF1B00",
"Num of Errors": "#bf1b00"
},
"bars": false,
"dashLength": 10,
"dashes": false,
"datasource": "$data_source",
"decimals": 0,
"editable": true,
"error": false,
"fill": 7,
"gridPos": {
"h": 7,
"w": 8,
"x": 8,
"y": 8
},
"id": 2,
"interval": "[[send_interval]]s",
"legend": {
"alignAsTable": true,
"avg": false,
"current": false,
"max": false,
"min": false,
"rightSide": false,
"show": true,
"total": true,
"values": true
},
"lines": true,
"linewidth": 1,
"links": [],
"nullPointMode": "null",
"percentage": false,
"pointradius": 1,
"points": false,
"renderer": "flot",
"seriesOverrides": [],
"spaceLength": 10,
"stack": false,
"steppedLine": false,
"targets": [
{
"alias": "Num of Errors",
"dsType": "influxdb",
"groupBy": [
{
"params": [
"$aggregation"
],
"type": "time"
},
{
"params": [
"null"
],
"type": "fill"
}
],
"measurement": "jmeter",
"orderByTime": "ASC",
"policy": "default",
"query": "SELECT sum(\"countError\") FROM \"$measurement_name\" WHERE (\"transaction\" = 'all' AND \"application\" =~ /^$application$/) AND $timeFilter GROUP BY time($__interval) fill(null)",
"rawQuery": true,
"refId": "B",
"resultFormat": "time_series",
"select": [
[
{
"params": [
"countError"
],
"type": "field"
},
{
"params": [],
"type": "sum"
}
]
],
"tags": [
{
"key": "transaction",
"operator": "=",
"value": "all"
},
{
"condition": "AND",
"key": "application",
"operator": "=~",
"value": "/^$application$/"
}
]
}
],
"thresholds": [],
"timeFrom": null,
"timeShift": null,
"title": "Total Errors",
"tooltip": {
"msResolution": false,
"shared": true,
"sort": 0,
"value_type": "individual"
},
"type": "graph",
"xaxis": {
"buckets": null,
"mode": "time",
"name": null,
"show": true,
"values": []
},
"yaxes": [
{
"decimals": 0,
"format": "short",
"label": null,
"logBase": 1,
"max": null,
"min": null,
"show": true
},
{
"format": "short",
"label": null,
"logBase": 1,
"max": null,
"min": null,
"show": false
}
]
},
{
"aliasColors": {
"Threads": "#614d93",
"threads": "#614d93"
},
"bars": false,
"dashLength": 10,
"dashes": false,
"datasource": "$data_source",
"decimals": 0,
"fill": 7,
"gridPos": {
"h": 7,
"w": 8,
"x": 16,
"y": 8
},
"id": 31,
"interval": "[[send_interval]]s",
"legend": {
"alignAsTable": true,
"avg": false,
"current": true,
"max": false,
"min": false,
"show": true,
"total": false,
"values": true
},
"lines": true,
"linewidth": 1,
"links": [],
"nullPointMode": "null",
"percentage": false,
"pointradius": 5,
"points": false,
"renderer": "flot",
"seriesOverrides": [],
"spaceLength": 10,
"stack": false,
"steppedLine": false,
"targets": [
{
"alias": "Threads",
"dsType": "influxdb",
"groupBy": [
{
"params": [
"$__interval"
],
"type": "time"
},
{
"params": [
"null"
],
"type": "fill"
}
],
"orderByTime": "ASC",
"policy": "default",
"query": "SELECT last(\"maxAT\") FROM \"$measurement_name\" WHERE (\"transaction\" = 'internal' AND \"application\" =~ /^$application$/) AND $timeFilter GROUP BY time($__interval) fill(null)",
"rawQuery": true,
"refId": "A",
"resultFormat": "time_series",
"select": [
[
{
"params": [
"value"
],
"type": "field"
},
{
"params": [],
"type": "mean"
}
]
],
"tags": []
}
],
"thresholds": [],
"timeFrom": null,
"timeShift": null,
"title": "Active Threads",
"tooltip": {
"shared": true,
"sort": 0,
"value_type": "individual"
},
"type": "graph",
"xaxis": {
"buckets": null,
"mode": "time",
"name": null,
"show": true,
"values": []
},
"yaxes": [
{
"decimals": 0,
"format": "short",
"label": null,
"logBase": 1,
"max": null,
"min": null,
"show": true
},
{
"format": "short",
"label": null,
"logBase": 1,
"max": null,
"min": null,
"show": true
}
]
},
{
"aliasColors": {
"banner": "#508642"
},
"bars": false,
"dashLength": 10,
"dashes": false,
"datasource": "$data_source",
"decimals": 2,
"editable": true,
"error": false,
"fill": 1,
"gridPos": {
"h": 7,
"w": 24,
"x": 0,
"y": 15
},
"height": "",
"id": 23,
"interval": "[[send_interval]]s",
"legend": {
"alignAsTable": true,
"avg": true,
"current": false,
"hideEmpty": false,
"hideZero": false,
"max": true,
"min": false,
"rightSide": true,
"show": true,
"total": false,
"values": true
},
"lines": true,
"linewidth": 1,
"links": [],
"nullPointMode": "null",
"percentage": false,
"pointradius": 1,
"points": false,
"renderer": "flot",
"repeat": null,
"repeatDirection": "h",
"seriesOverrides": [],
"spaceLength": 10,
"stack": false,
"steppedLine": false,
"targets": [
{
"alias": "$tag_transaction",
"dsType": "influxdb",
"groupBy": [
{
"params": [
"transaction"
],
"type": "tag"
}
],
"measurement": "jmeter",
"orderByTime": "ASC",
"policy": "default",
"query": "SELECT mean(\"pct95.0\") FROM \"$measurement_name\" WHERE (\"application\" =~ /^$application$/) AND $timeFilter GROUP BY \"transaction\", time($__interval) fill(null)",
"rawQuery": true,
"refId": "B",
"resultFormat": "time_series",
"select": [
[
{
"params": [
"pct95.0"
],
"type": "field"
}
]
],
"tags": [
{
"key": "statut",
"operator": "=",
"value": "ok"
},
{
"condition": "AND",
"key": "application",
"operator": "=~",
"value": "/^$application$/"
}
]
}
],
"thresholds": [
{
"colorMode": "ok",
"fill": true,
"line": true,
"op": "lt",
"value": 500
},
{
"colorMode": "warning",
"fill": false,
"line": true,
"op": "gt",
"value": 1500
},
{
"colorMode": "critical",
"fill": true,
"line": true,
"op": "gt",
"value": 5000
}
],
"timeFrom": null,
"timeShift": null,
"title": "Transactions Response Times (95th pct)",
"tooltip": {
"msResolution": false,
"shared": true,
"sort": 0,
"value_type": "individual"
},
"transparent": false,
"type": "graph",
"xaxis": {
"buckets": null,
"mode": "time",
"name": null,
"show": true,
"values": []
},
"yaxes": [
{
"format": "ms",
"label": null,
"logBase": 1,
"max": null,
"min": null,
"show": true
},
{
"format": "short",
"label": null,
"logBase": 1,
"max": null,
"min": null,
"show": false
}
]
},
{
"aliasColors": {
"banner": "#508642"
},
"bars": false,
"dashLength": 10,
"dashes": false,
"datasource": "$data_source",
"decimals": 2,
"editable": true,
"error": false,
"fill": 1,
"gridPos": {
"h": 7,
"w": 24,
"x": 0,
"y": 22
},
"height": "",
"id": 36,
"interval": "[[send_interval]]s",
"legend": {
"alignAsTable": true,
"avg": true,
"current": false,
"hideEmpty": false,
"hideZero": false,
"max": true,
"min": false,
"rightSide": true,
"show": true,
"total": false,
"values": true
},
"lines": true,
"linewidth": 1,
"links": [],
"nullPointMode": "null",
"percentage": false,
"pointradius": 1,
"points": false,
"renderer": "flot",
"seriesOverrides": [],
"spaceLength": 10,
"stack": false,
"steppedLine": false,
"targets": [
{
"alias": "$tag_transaction",
"groupBy": [
{
"params": [
"$__interval"
],
"type": "time"
},
{
"params": [
"null"
],
"type": "fill"
}
],
"orderByTime": "ASC",
"policy": "default",
"query": "SELECT mean(\"sb\") FROM \"$measurement_name\" WHERE (\"application\" =~ /^$application$/) AND $timeFilter GROUP BY \"transaction\", time($__interval) fill(null)",
"rawQuery": true,
"refId": "A",
"resultFormat": "time_series",
"select": [
[
{
"params": [
"sb"
],
"type": "field"
},
{
"params": [],
"type": "mean"
}
]
],
"tags": []
},
{
"alias": "$tag_transaction",
"groupBy": [
{
"params": [
"$__interval"
],
"type": "time"
},
{
"params": [
"null"
],
"type": "fill"
}
],
"orderByTime": "ASC",
"policy": "default",
"query": "SELECT mean(\"rb\") FROM \"$measurement_name\" WHERE (\"application\" =~ /^$application$/) AND $timeFilter GROUP BY \"transaction\", time($__interval) fill(null)",
"rawQuery": true,
"refId": "B",
"resultFormat": "time_series",
"select": [
[
{
"params": [
"value"
],
"type": "field"
},
{
"params": [],
"type": "mean"
}
]
],
"tags": []
}
],
"thresholds": [
{
"colorMode": "ok",
"fill": true,
"line": true,
"op": "lt",
"value": 500
},
{
"colorMode": "warning",
"fill": false,
"line": true,
"op": "gt",
"value": 1500
},
{
"colorMode": "critical",
"fill": true,
"line": true,
"op": "gt",
"value": 5000
}
],
"timeFrom": null,
"timeShift": null,
"title": "Network Traffic",
"tooltip": {
"msResolution": false,
"shared": true,
"sort": 0,
"value_type": "individual"
},
"transparent": false,
"type": "graph",
"xaxis": {
"buckets": null,
"mode": "time",
"name": null,
"show": true,
"values": []
},
"yaxes": [
{
"format": "bytes",
"label": null,
"logBase": 1,
"max": null,
"min": null,
"show": true
},
{
"format": "short",
"label": null,
"logBase": 1,
"max": null,
"min": null,
"show": false
}
]
},
{
"collapsed": true,
"gridPos": {
"h": 1,
"w": 24,
"x": 0,
"y": 29
},
"id": 34,
"panels": [
{
"columns": [],
"datasource": "$data_source",
"fontSize": "100%",
"gridPos": {
"h": 7,
"w": 8,
"x": 0,
"y": 2
},
"height": "",
"id": 25,
"interval": "[[send_interval]]s",
"links": [],
"pageSize": null,
"scroll": true,
"showHeader": true,
"sort": {
"col": 2,
"desc": true
},
"styles": [
{
"alias": "Time",
"dateFormat": "YYYY-MM-DD HH:mm:ss",
"pattern": "Time",
"type": "hidden"
},
{
"alias": "",
"colorMode": null,
"colors": [
"rgba(245, 54, 54, 0.9)",
"rgba(237, 129, 40, 0.89)",
"rgba(50, 172, 45, 0.97)"
],
"decimals": 0,
"pattern": "/.*/",
"thresholds": [],
"type": "number",
"unit": "short"
}
],
"targets": [
{
"alias": "$tag_transaction",
"dsType": "influxdb",
"groupBy": [
{
"params": [
"transaction"
],
"type": "tag"
}
],
"measurement": "jmeter",
"orderByTime": "ASC",
"policy": "default",
"query": "SELECT sum(\"count\") FROM \"$measurement_name\" WHERE (\"application\" =~ /^$application$/ AND \"statut\" = 'ko') AND $timeFilter GROUP BY \"transaction\"",
"rawQuery": true,
"refId": "A",
"resultFormat": "table",
"select": [
[
{
"params": [
"count"
],
"type": "field"
},
{
"params": [],
"type": "sum"
}
]
],
"tags": [
{
"key": "application",
"operator": "=~",
"value": "/^$application$/"
},
{
"condition": "AND",
"key": "statut",
"operator": "=",
"value": "ko"
}
]
}
],
"title": "Errors per Transaction",
"transform": "table",
"type": "table"
},
{
"columns": [],
"datasource": "$data_source",
"fontSize": "100%",
"gridPos": {
"h": 7,
"w": 16,
"x": 8,
"y": 2
},
"id": 27,
"interval": "[[send_interval]]s",
"links": [],
"pageSize": null,
"scroll": true,
"showHeader": true,
"sort": {
"col": 0,
"desc": true
},
"styles": [
{
"alias": "Time",
"dateFormat": "YYYY-MM-DD HH:mm:ss",
"pattern": "Time",
"type": "hidden"
},
{
"alias": "",
"colorMode": null,
"colors": [
"rgba(245, 54, 54, 0.9)",
"rgba(237, 129, 40, 0.89)",
"rgba(50, 172, 45, 0.97)"
],
"decimals": 0,
"pattern": "/.*/",
"thresholds": [],
"type": "number",
"unit": "short"
}
],
"targets": [
{
"alias": "$tag_responseCode",
"dsType": "influxdb",
"groupBy": [
{
"params": [
"responseCode"
],
"type": "tag"
}
],
"measurement": "jmeter",
"orderByTime": "ASC",
"policy": "default",
"query": "SELECT sum(\"count\") FROM \"$measurement_name\" WHERE (\"application\" =~ /^$application$/ AND \"responseCode\" !~ /^$/) AND $timeFilter GROUP BY \"responseCode\",\"responseMessage\"",
"rawQuery": true,
"refId": "A",
"resultFormat": "table",
"select": [
[
{
"params": [
"count"
],
"type": "field"
}
],
[
{
"params": [
"responseMessage"
],
"type": "field"
}
]
],
"tags": [
{
"key": "application",
"operator": "=~",
"value": "/^$application$/"
},
{
"condition": "AND",
"key": "responseCode",
"operator": "!~",
"value": "/^$/"
}
]
}
],
"title": "Error Info",
"transform": "table",
"type": "table"
}
],
"repeat": null,
"title": "Errors",
"type": "row"
},
{
"collapsed": false,
"gridPos": {
"h": 1,
"w": 24,
"x": 0,
"y": 30
},
"id": 35,
"panels": [],
"repeat": null,
"title": "Individual Transaction - $transaction",
"type": "row"
},
{
"cacheTimeout": null,
"colorBackground": false,
"colorValue": true,
"colors": [
"rgba(245, 54, 54, 0.9)",
"#e5ac0e",
"rgba(50, 172, 45, 0.97)"
],
"datasource": "$data_source",
"decimals": 0,
"editable": true,
"error": false,
"format": "none",
"gauge": {
"maxValue": 100,
"minValue": 0,
"show": false,
"thresholdLabels": false,
"thresholdMarkers": true
},
"gridPos": {
"h": 7,
"w": 8,
"x": 0,
"y": 31
},
"id": 9,
"interval": "[[send_interval]]s",
"links": [],
"mappingType": 1,
"mappingTypes": [
{
"name": "value to text",
"value": 1
},
{
"name": "range to text",
"value": 2
}
],
"maxDataPoints": 100,
"nullPointMode": "connected",
"nullText": null,
"postfix": " Requests",
"postfixFontSize": "50%",
"prefix": "",
"prefixFontSize": "50%",
"rangeMaps": [
{
"from": "null",
"text": "N/A",
"to": "null"
}
],
"sparkline": {
"fillColor": "rgba(31, 118, 189, 0.18)",
"full": false,
"lineColor": "#e5ac0e",
"show": false
},
"tableColumn": "",
"targets": [
{
"dsType": "influxdb",
"groupBy": [
{
"params": [
"$__interval"
],
"type": "time"
},
{
"params": [
"null"
],
"type": "fill"
}
],
"measurement": "jmeter",
"orderByTime": "ASC",
"policy": "default",
"query": "SELECT sum(\"count\") FROM \"$measurement_name\" WHERE (\"application\" =~ /^$application$/ AND \"transaction\" =~ /^$transaction$/ AND \"statut\" = 'all') AND $timeFilter GROUP BY time($__interval) fill(null)",
"rawQuery": true,
"refId": "A",
"resultFormat": "time_series",
"select": [
[
{
"params": [
"count"
],
"type": "field"
},
{
"params": [],
"type": "sum"
}
]
],
"tags": [
{
"key": "transaction",
"operator": "=~",
"value": "/^$transaction$/"
},
{
"condition": "AND",
"key": "statut",
"operator": "=",
"value": "all"
}
]
}
],
"thresholds": "",
"title": "Total Requests - $transaction",
"type": "singlestat",
"valueFontSize": "80%",
"valueMaps": [
{
"op": "=",
"text": "0",
"value": "null"
}
],
"valueName": "total"
},
{
"cacheTimeout": null,
"colorBackground": false,
"colorValue": true,
"colors": [
"rgba(245, 54, 54, 0.9)",
"#e24d42",
"rgba(50, 172, 45, 0.97)"
],
"datasource": "$data_source",
"decimals": 0,
"editable": true,
"error": false,
"format": "none",
"gauge": {
"maxValue": 100,
"minValue": 0,
"show": false,
"thresholdLabels": false,
"thresholdMarkers": true
},
"gridPos": {
"h": 7,
"w": 8,
"x": 8,
"y": 31
},
"id": 6,
"interval": "[[send_interval]]s",
"links": [],
"mappingType": 1,
"mappingTypes": [
{
"name": "value to text",
"value": 1
},
{
"name": "range to text",
"value": 2
}
],
"maxDataPoints": 100,
"nullPointMode": "connected",
"nullText": null,
"postfix": " Failed",
"postfixFontSize": "50%",
"prefix": "",
"prefixFontSize": "50%",
"rangeMaps": [
{
"from": "null",
"text": "N/A",
"to": "null"
}
],
"sparkline": {
"fillColor": "rgba(31, 118, 189, 0.18)",
"full": false,
"lineColor": "#e24d42",
"show": false
},
"tableColumn": "",
"targets": [
{
"dsType": "influxdb",
"groupBy": [
{
"params": [
"$__interval"
],
"type": "time"
},
{
"params": [
"null"
],
"type": "fill"
}
],
"measurement": "jmeter",
"orderByTime": "ASC",
"policy": "default",
"query": "SELECT sum(\"count\") FROM \"$measurement_name\" WHERE (\"application\" =~ /^$application$/ AND \"transaction\" =~ /^$transaction$/ AND \"statut\" = 'ko') AND $timeFilter GROUP BY time($__interval) fill(null)",
"rawQuery": true,
"refId": "A",
"resultFormat": "time_series",
"select": [
[
{
"params": [
"count"
],
"type": "field"
},
{
"params": [],
"type": "sum"
}
]
],
"tags": [
{
"key": "transaction",
"operator": "=~",
"value": "/^$transaction$/"
},
{
"condition": "AND",
"key": "statut",
"operator": "=",
"value": "ko"
}
]
}
],
"thresholds": "",
"title": "Failed Requests - $transaction",
"type": "singlestat",
"valueFontSize": "80%",
"valueMaps": [
{
"op": "=",
"text": "0",
"value": "null"
}
],
"valueName": "total"
},
{
"cacheTimeout": null,
"colorBackground": false,
"colorValue": true,
"colors": [
"rgba(50, 172, 45, 0.97)",
"#e5ac0e",
"#e24d42"
],
"datasource": "$data_source",
"decimals": 2,
"editable": true,
"error": false,
"format": "percentunit",
"gauge": {
"maxValue": 1,
"minValue": 0,
"show": true,
"thresholdLabels": false,
"thresholdMarkers": true
},
"gridPos": {
"h": 7,
"w": 8,
"x": 16,
"y": 31
},
"id": 8,
"interval": "[[send_interval]]s",
"links": [],
"mappingType": 1,
"mappingTypes": [
{
"name": "value to text",
"value": 1
},
{
"name": "range to text",
"value": 2
}
],
"maxDataPoints": 100,
"nullPointMode": "connected",
"nullText": null,
"postfix": "",
"postfixFontSize": "50%",
"prefix": "",
"prefixFontSize": "50%",
"rangeMaps": [
{
"from": "null",
"text": "N/A",
"to": "null"
}
],
"sparkline": {
"fillColor": "rgba(31, 118, 189, 0.18)",
"full": false,
"lineColor": "rgb(14, 237, 45)",
"show": false
},
"tableColumn": "",
"targets": [
{
"dsType": "influxdb",
"groupBy": [
{
"params": [
"$__interval"
],
"type": "time"
},
{
"params": [
"null"
],
"type": "fill"
}
],
"measurement": "jmeter",
"orderByTime": "ASC",
"policy": "default",
"query": "SELECT sum(\"error\") / sum(\"all\") FROM (SELECT sum(\"count\") AS \"all\" FROM \"$measurement_name\" WHERE \"transaction\" =~ /^$transaction$/ AND \"statut\" = 'all' AND \"application\" =~ /^$application$/ AND $timeFilter GROUP BY time($__interval) fill(null)), (SELECT sum(\"count\") AS \"error\" FROM \"$measurement_name\" WHERE \"transaction\" =~ /^$transaction$/ AND \"statut\" = 'ko' AND \"application\" =~ /^$application$/ AND $timeFilter GROUP BY time($__interval) fill(null))",
"rawQuery": true,
"refId": "A",
"resultFormat": "time_series",
"select": [
[
{
"params": [
"count"
],
"type": "field"
},
{
"params": [],
"type": "sum"
}
]
],
"tags": [
{
"key": "transaction",
"operator": "=~",
"value": "/^$transaction$/"
},
{
"condition": "AND",
"key": "statut",
"operator": "=",
"value": "ok"
}
]
}
],
"thresholds": "0,0.01",
"title": "Error Rate % - $transaction",
"type": "singlestat",
"valueFontSize": "50%",
"valueMaps": [
{
"op": "=",
"text": "0",
"value": "null"
}
],
"valueName": "total"
},
{
"aliasColors": {
"90th Percentage": "#EAB839",
"95th Percentage": "#EF843C",
"99th Percentage": "#99440A",
"Average": "#3F6833",
"Max": "#58140C",
"Req / s": "#6ed0e0"
},
"bars": false,
"dashLength": 10,
"dashes": false,
"datasource": "$data_source",
"decimals": 2,
"editable": true,
"error": false,
"fill": 7,
"gridPos": {
"h": 7,
"w": 12,
"x": 0,
"y": 38
},
"height": "",
"id": 10,
"interval": "[[send_interval]]s",
"legend": {
"alignAsTable": true,
"avg": true,
"current": false,
"max": true,
"min": true,
"rightSide": false,
"show": true,
"total": false,
"values": true
},
"lines": true,
"linewidth": 1,
"links": [],
"nullPointMode": "null",
"percentage": false,
"pointradius": 1,
"points": false,
"renderer": "flot",
"seriesOverrides": [
{
"alias": "Average",
"yaxis": 1
}
],
"spaceLength": 10,
"stack": false,
"steppedLine": false,
"targets": [
{
"alias": "Req / s",
"dsType": "influxdb",
"groupBy": [
{
"params": [
"$__interval"
],
"type": "time"
}
],
"measurement": "jmeter",
"orderByTime": "ASC",
"policy": "default",
"query": "SELECT last(\"count\") / $send_interval FROM \"$measurement_name\" WHERE (\"transaction\" =~ /^$transaction$/ AND \"statut\" = 'ok') AND $timeFilter GROUP BY time($__interval)",
"rawQuery": true,
"refId": "B",
"resultFormat": "time_series",
"select": [
[
{
"params": [
"count"
],
"type": "field"
},
{
"params": [],
"type": "sum"
},
{
"params": [
"5s"
],
"type": "non_negative_derivative"
}
]
],
"tags": [
{
"key": "transaction",
"operator": "=~",
"value": "/^$transaction$/"
},
{
"condition": "AND",
"key": "statut",
"operator": "=",
"value": "ok"
}
]
}
],
"thresholds": [],
"timeFrom": null,
"timeShift": null,
"title": "Throughput - $transaction",
"tooltip": {
"msResolution": false,
"shared": true,
"sort": 0,
"value_type": "individual"
},
"type": "graph",
"xaxis": {
"buckets": null,
"mode": "time",
"name": null,
"show": true,
"values": []
},
"yaxes": [
{
"format": "short",
"label": null,
"logBase": 1,
"max": null,
"min": null,
"show": true
},
{
"format": "short",
"label": null,
"logBase": 1,
"max": null,
"min": null,
"show": false
}
]
},
{
"aliasColors": {
"Num of Errors": "#bf1b00",
"num of errors": "#bf1b00"
},
"bars": false,
"dashLength": 10,
"dashes": false,
"datasource": "$data_source",
"decimals": 0,
"fill": 7,
"gridPos": {
"h": 7,
"w": 12,
"x": 12,
"y": 38
},
"id": 32,
"interval": "[[send_interval]]s",
"legend": {
"alignAsTable": true,
"avg": false,
"current": false,
"max": false,
"min": false,
"rightSide": false,
"show": true,
"total": true,
"values": true
},
"lines": true,
"linewidth": 1,
"links": [],
"nullPointMode": "null",
"percentage": false,
"pointradius": 1,
"points": true,
"renderer": "flot",
"seriesOverrides": [],
"spaceLength": 10,
"stack": false,
"steppedLine": false,
"targets": [
{
"alias": "Num of Errors",
"dsType": "influxdb",
"groupBy": [
{
"params": [
"$__interval"
],
"type": "time"
},
{
"params": [
"null"
],
"type": "fill"
}
],
"orderByTime": "ASC",
"policy": "default",
"query": "SELECT sum(\"count\") FROM \"$measurement_name\" WHERE \"application\" =~ /^$application$/ AND \"transaction\" =~ /^$transaction$/ AND \"statut\" = 'ko' AND $timeFilter GROUP BY time($__interval) fill(null)",
"rawQuery": true,
"refId": "A",
"resultFormat": "time_series",
"select": [
[
{
"params": [
"value"
],
"type": "field"
},
{
"params": [],
"type": "mean"
}
]
],
"tags": []
}
],
"thresholds": [],
"timeFrom": null,
"timeShift": null,
"title": "Errors",
"tooltip": {
"shared": true,
"sort": 0,
"value_type": "individual"
},
"type": "graph",
"xaxis": {
"buckets": 1,
"mode": "time",
"name": null,
"show": true,
"values": []
},
"yaxes": [
{
"decimals": 0,
"format": "short",
"label": null,
"logBase": 1,
"max": null,
"min": null,
"show": true
},
{
"format": "short",
"label": null,
"logBase": 1,
"max": null,
"min": null,
"show": true
}
]
},
{
"aliasColors": {
"90th Percentage": "#f2c96d",
"95th Percentage": "#EF843C",
"99th Percentage": "#bf1b00",
"Average": "#7eb26d",
"Max": "#584477",
"Median": "#6ed0e0",
"median": "#6ed0e0"
},
"bars": false,
"dashLength": 10,
"dashes": false,
"datasource": "$data_source",
"decimals": 2,
"editable": true,
"error": false,
"fill": 1,
"gridPos": {
"h": 7,
"w": 24,
"x": 0,
"y": 45
},
"height": "",
"id": 5,
"interval": "[[send_interval]]s",
"legend": {
"alignAsTable": true,
"avg": true,
"current": false,
"hideEmpty": true,
"max": true,
"min": false,
"rightSide": true,
"show": true,
"sortDesc": true,
"total": false,
"values": true
},
"lines": true,
"linewidth": 1,
"links": [],
"nullPointMode": "null",
"percentage": false,
"pointradius": 1,
"points": false,
"renderer": "flot",
"seriesOverrides": [
{
"alias": "Average",
"yaxis": 1
}
],
"spaceLength": 10,
"stack": false,
"steppedLine": false,
"targets": [
{
"alias": "Average",
"dsType": "influxdb",
"groupBy": [
{
"params": [
"$aggregation"
],
"type": "time"
},
{
"params": [
"null"
],
"type": "fill"
}
],
"measurement": "jmeter",
"orderByTime": "ASC",
"policy": "default",
"query": "SELECT last(\"avg\") FROM \"$measurement_name\" WHERE (\"transaction\" =~ /^$transaction$/ AND \"statut\" = 'ok') AND $timeFilter GROUP BY time($__interval)",
"rawQuery": true,
"refId": "A",
"resultFormat": "time_series",
"select": [
[
{
"params": [
"avg"
],
"type": "field"
},
{
"params": [],
"type": "last"
}
]
],
"tags": [
{
"key": "transaction",
"operator": "=~",
"value": "/^$request$/"
},
{
"condition": "AND",
"key": "statut",
"operator": "=",
"value": "ok"
}
]
},
{
"alias": "Median",
"dsType": "influxdb",
"groupBy": [
{
"params": [
"$aggregation"
],
"type": "time"
},
{
"params": [
"null"
],
"type": "fill"
}
],
"hide": false,
"measurement": "jmeter",
"orderByTime": "ASC",
"policy": "default",
"query": "SELECT last(\"pct50.0\") FROM \"$measurement_name\" WHERE (\"transaction\" =~ /^$transaction$/ AND \"statut\" = 'ok') AND $timeFilter GROUP BY time($__interval)",
"rawQuery": true,
"refId": "F",
"resultFormat": "time_series",
"select": [
[
{
"params": [
"pct50.0"
],
"type": "field"
},
{
"params": [],
"type": "last"
}
]
],
"tags": [
{
"key": "transaction",
"operator": "=~",
"value": "/^$request$/"
},
{
"condition": "AND",
"key": "statut",
"operator": "=",
"value": "all"
}
]
},
{
"alias": "90th Percentile",
"dsType": "influxdb",
"groupBy": [
{
"params": [
"$aggregation"
],
"type": "time"
},
{
"params": [
"null"
],
"type": "fill"
}
],
"measurement": "jmeter",
"orderByTime": "ASC",
"policy": "default",
"query": "SELECT last(\"pct90.0\") FROM \"$measurement_name\" WHERE (\"transaction\" =~ /^$transaction$/ AND \"statut\" = 'ok') AND $timeFilter GROUP BY time($__interval) fill(null)",
"rawQuery": true,
"refId": "B",
"resultFormat": "time_series",
"select": [
[
{
"params": [
"pct90.0"
],
"type": "field"
},
{
"params": [],
"type": "last"
}
]
],
"tags": [
{
"key": "transaction",
"operator": "=~",
"value": "/^$request$/"
},
{
"condition": "AND",
"key": "statut",
"operator": "=",
"value": "all"
}
]
},
{
"alias": "95th Percentile",
"dsType": "influxdb",
"groupBy": [
{
"params": [
"$aggregation"
],
"type": "time"
},
{
"params": [
"null"
],
"type": "fill"
}
],
"hide": false,
"measurement": "jmeter",
"orderByTime": "ASC",
"policy": "default",
"query": "SELECT last(\"pct95.0\") FROM \"$measurement_name\" WHERE (\"transaction\" =~ /^$transaction$/ AND \"statut\" = 'ok') AND $timeFilter GROUP BY time($__interval) fill(null)",
"rawQuery": true,
"refId": "C",
"resultFormat": "time_series",
"select": [
[
{
"params": [
"pct95.0"
],
"type": "field"
},
{
"params": [],
"type": "last"
}
]
],
"tags": [
{
"key": "transaction",
"operator": "=~",
"value": "/^$request$/"
}
]
},
{
"alias": "99th Percentile",
"dsType": "influxdb",
"groupBy": [
{
"params": [
"$aggregation"
],
"type": "time"
},
{
"params": [
"null"
],
"type": "fill"
}
],
"hide": false,
"measurement": "jmeter",
"orderByTime": "ASC",
"policy": "default",
"query": "SELECT last(\"pct99.0\") FROM \"$measurement_name\" WHERE (\"transaction\" =~ /^$transaction$/ AND \"statut\" = 'ok') AND $timeFilter GROUP BY time($__interval) fill(null)",
"rawQuery": true,
"refId": "D",
"resultFormat": "time_series",
"select": [
[
{
"params": [
"pct99.0"
],
"type": "field"
},
{
"params": [],
"type": "last"
}
]
],
"tags": [
{
"key": "transaction",
"operator": "=~",
"value": "/^$request$/"
}
]
},
{
"alias": "Max",
"dsType": "influxdb",
"groupBy": [
{
"params": [
"$aggregation"
],
"type": "time"
},
{
"params": [
"null"
],
"type": "fill"
}
],
"measurement": "jmeter",
"orderByTime": "ASC",
"policy": "default",
"query": "SELECT last(\"max\") FROM \"$measurement_name\" WHERE (\"transaction\" =~ /^$transaction$/ AND \"statut\" = 'ok') AND $timeFilter GROUP BY time($__interval) fill(null)",
"rawQuery": true,
"refId": "E",
"resultFormat": "time_series",
"select": [
[
{
"params": [
"max"
],
"type": "field"
},
{
"params": [],
"type": "last"
}
]
],
"tags": [
{
"key": "transaction",
"operator": "=~",
"value": "/^$request$/"
},
{
"condition": "AND",
"key": "statut",
"operator": "=",
"value": "ok"
}
]
}
],
"thresholds": [
{
"colorMode": "ok",
"fill": true,
"line": true,
"op": "lt",
"value": 500
},
{
"colorMode": "warning",
"fill": false,
"line": true,
"op": "gt",
"value": 1500
},
{
"colorMode": "critical",
"fill": true,
"line": true,
"op": "gt",
"value": 5000
}
],
"timeFrom": null,
"timeShift": null,
"title": "Response Times - $transaction",
"tooltip": {
"msResolution": false,
"shared": true,
"sort": 0,
"value_type": "individual"
},
"type": "graph",
"xaxis": {
"buckets": null,
"mode": "time",
"name": null,
"show": true,
"values": []
},
"yaxes": [
{
"format": "ms",
"label": null,
"logBase": 1,
"max": null,
"min": null,
"show": true
},
{
"format": "short",
"label": null,
"logBase": 1,
"max": null,
"min": null,
"show": false
}
]
}
],
"refresh": false,
"schemaVersion": 16,
"style": "dark",
"tags": [
"load_test"
],
"templating": {
"list": [
{
"current": {
"text": "jmeter_influx",
"value": "jmeter_influx"
},
"hide": 0,
"label": "",
"name": "data_source",
"options": [],
"query": "influxdb",
"refresh": 1,
"regex": "",
"type": "datasource"
},
{
"allValue": null,
"current": {
"text": "JMeter_demo",
"value": "JMeter_demo"
},
"datasource": "$data_source",
"hide": 0,
"includeAll": false,
"label": "",
"multi": false,
"name": "application",
"options": [],
"query": "SHOW TAG VALUES FROM \"jmeter\" WITH KEY = \"application\"",
"refresh": 1,
"regex": "",
"sort": 0,
"tagValuesQuery": null,
"tags": [],
"tagsQuery": null,
"type": "query",
"useTags": false
},
{
"allValue": null,
"current": {
"text": "JR_OK",
"value": "JR_OK"
},
"datasource": "$data_source",
"hide": 0,
"includeAll": false,
"label": "",
"multi": false,
"name": "transaction",
"options": [],
"query": "SHOW TAG VALUES FROM \"jmeter\" WITH KEY = \"transaction\" WHERE \"application\" =~ /^$application$/ AND \"transaction\" != 'internal' AND \"transaction\" != 'all'",
"refresh": 1,
"regex": "",
"sort": 0,
"tagValuesQuery": null,
"tags": [],
"tagsQuery": null,
"type": "query",
"useTags": false
},
{
"current": {
"text": "jmeter",
"value": "jmeter"
},
"hide": 2,
"label": "Measurement name",
"name": "measurement_name",
"options": [
{
"text": "jmeter",
"value": "jmeter"
}
],
"query": "jmeter",
"type": "constant"
},
{
"current": {
"text": "5",
"value": "5"
},
"hide": 2,
"label": "Backend send interval in second",
"name": "send_interval",
"options": [
{
"text": "5",
"value": "5"
}
],
"query": "5",
"type": "constant"
}
]
},
"time": {
"from": "now-5m",
"to": "now"
},
"timepicker": {
"refresh_intervals": [
"5s",
"10s",
"30s",
"1m",
"5m",
"15m",
"30m",
"1h",
"2h",
"1d"
],
"time_options": [
"5m",
"15m",
"1h",
"6h",
"12h",
"24h",
"2d",
"7d",
"30d"
]
},
"timezone": "browser",
"title": "Apache JMeter Dashboard using Core InfluxdbBackendListenerClient",
"version": 4
}