<!DOCTYPE html>
<html>
<head>
<title>气温图表</title>
<script src="https://cdn.jsdelivr.net/npm/chart.js"></script>
<style>
#myChart{
width:800px;
height: 400px;
}
</style>
</head>
<body>
<canvas id="myChart"></canvas>
<script>
var tempData = {
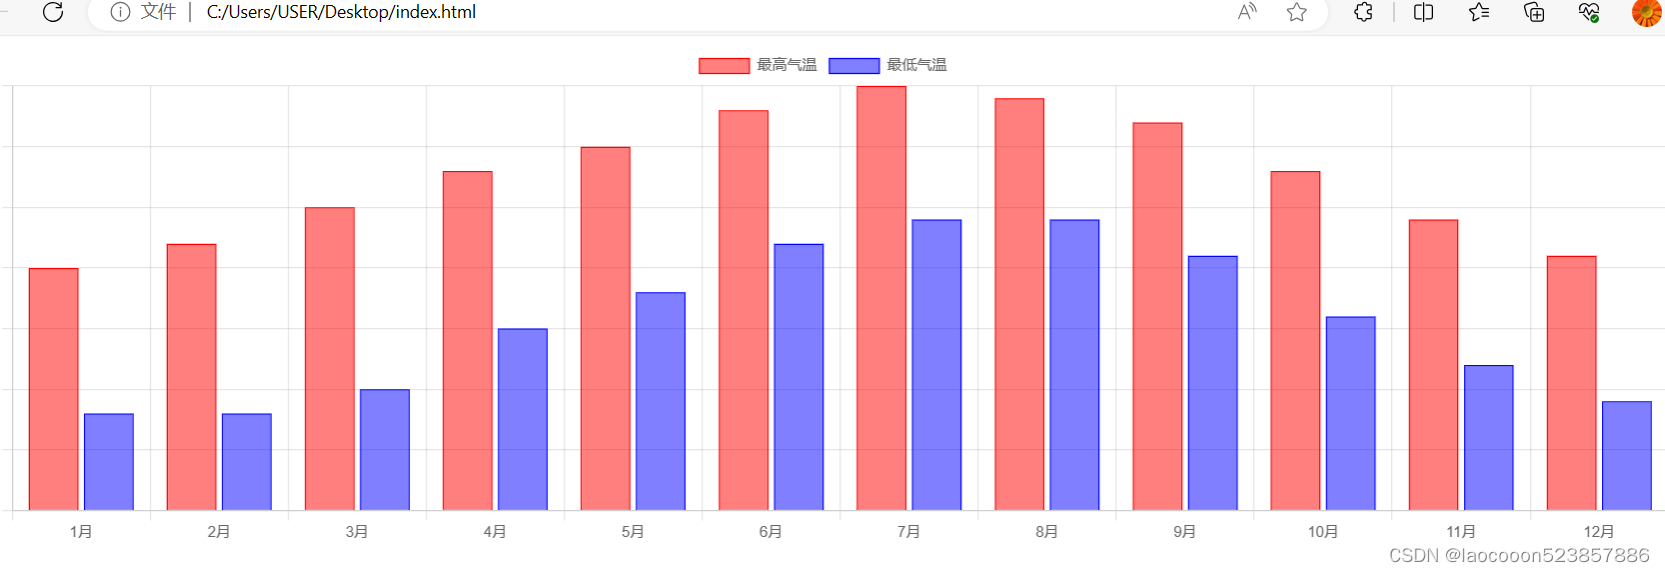
labels: ["1月", "2月", "3月", "4月", "5月", "6月", "7月", "8月", "9月", "10月", "11月", "12月"],
datasets: [
{
label: "最高气温",
backgroundColor: "rgba(255,0,0,0.5)",
borderColor: "red",
borderWidth: 1,
data: [20, 22, 25, 28, 30, 33, 35, 34, 32, 28, 24, 21]
},
{
label: "最低气温",
backgroundColor: "rgba(0,0,255,0.5)",
borderColor: "blue",
borderWidth: 1,
data: [8, 8, 10, 15, 18, 22, 24, 24, 21, 16, 12, 9]
}
]
};
var tempOptions = {
responsive: true,
maintainAspectRatio: false,
scales: {
yAxes: [{
ticks: {
beginAtZero: true
}
}]
}
};
var ctx = document.getElementById("myChart").getContext("2d");
var myChart = new Chart(ctx, {
type: "bar",
data: tempData,
options: tempOptions
});
</script>
</body>
</html>
使用char.js 柱形方式显示 一年12个月的最高气温与最低气温
news2026/5/24 13:48:00
本文来自互联网用户投稿,该文观点仅代表作者本人,不代表本站立场。本站仅提供信息存储空间服务,不拥有所有权,不承担相关法律责任。如若转载,请注明出处:http://www.coloradmin.cn/o/1261367.html
如若内容造成侵权/违法违规/事实不符,请联系多彩编程网进行投诉反馈,一经查实,立即删除!相关文章
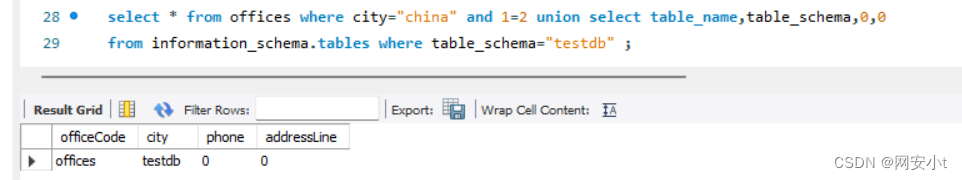
SQL注入-数据库基础/SQL语法
目录 一,数据库概述
1.1 数据库
1.2 了解 ACID 理论
1.3 识别数据库
二,SQL 语法基础
三,SQL语句实例
3.1 SQL基础语句
3.2 SQL高级语句
四,基于SQL注入理解语法/函数
4.1 语法
4.2 函数
五,目录数据库info…
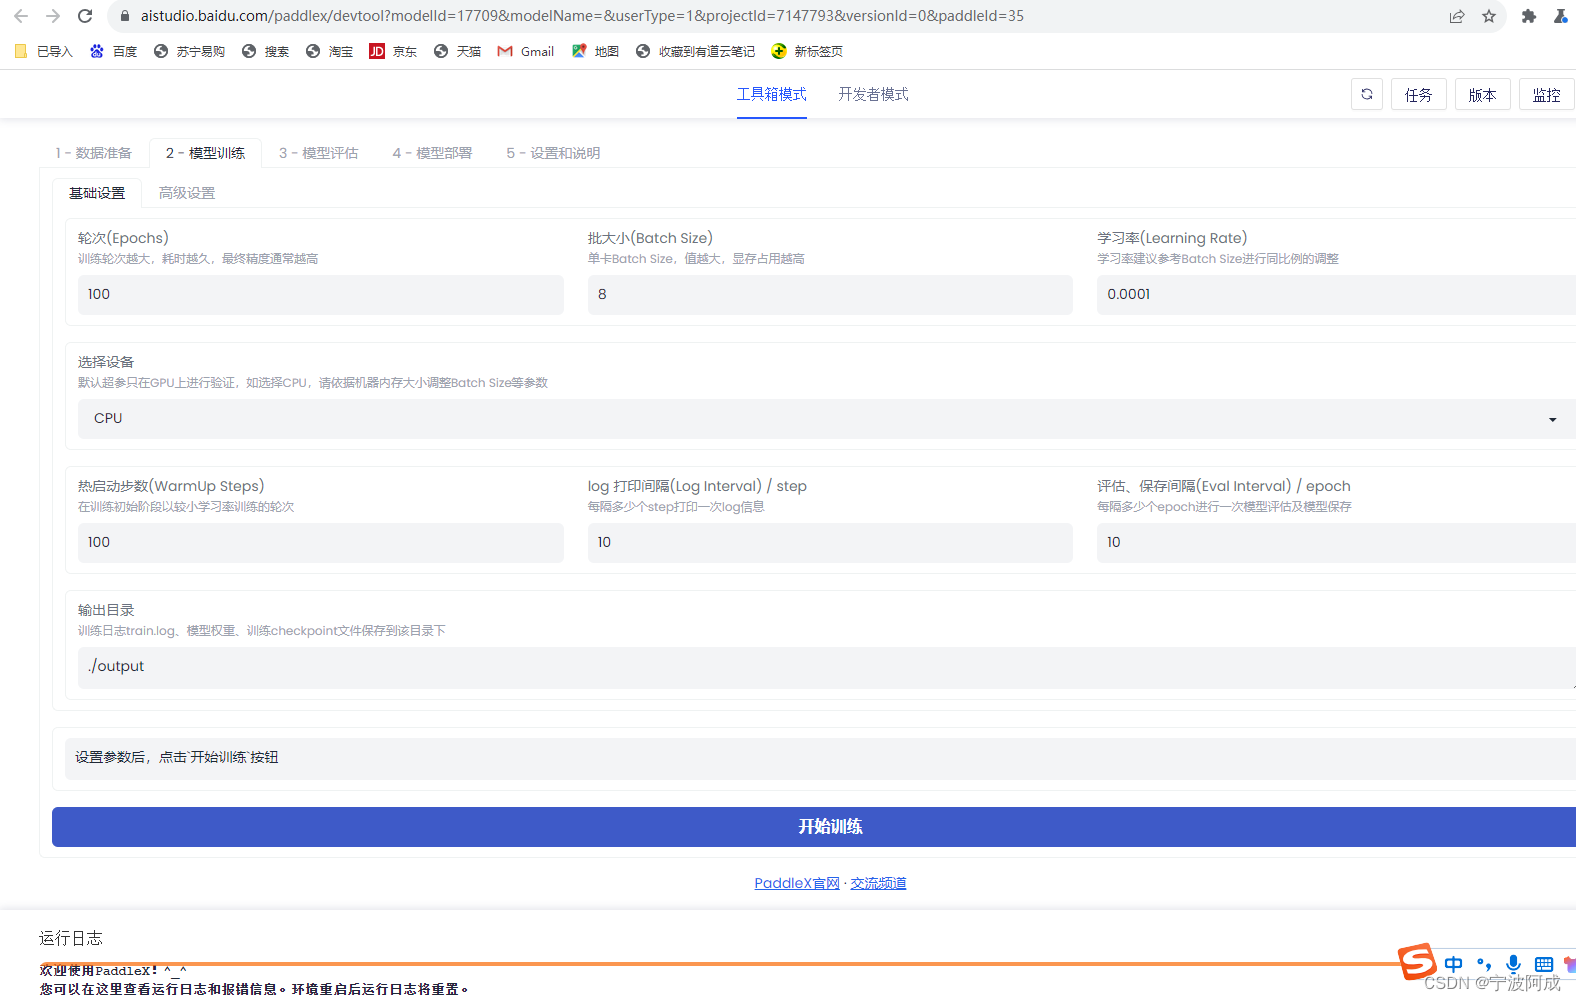
百度人工智能培训第一天笔记
参加了百度人工智能初步培训,主要是了解一下现在人工智能的基本情况,以便后续看可以参与一些啥? 下面就有关培训做一些记录,以便后续可以继续学习。
一、理论基础部分 二、实际操作部分
主要学习的百度人工智能平台如下…
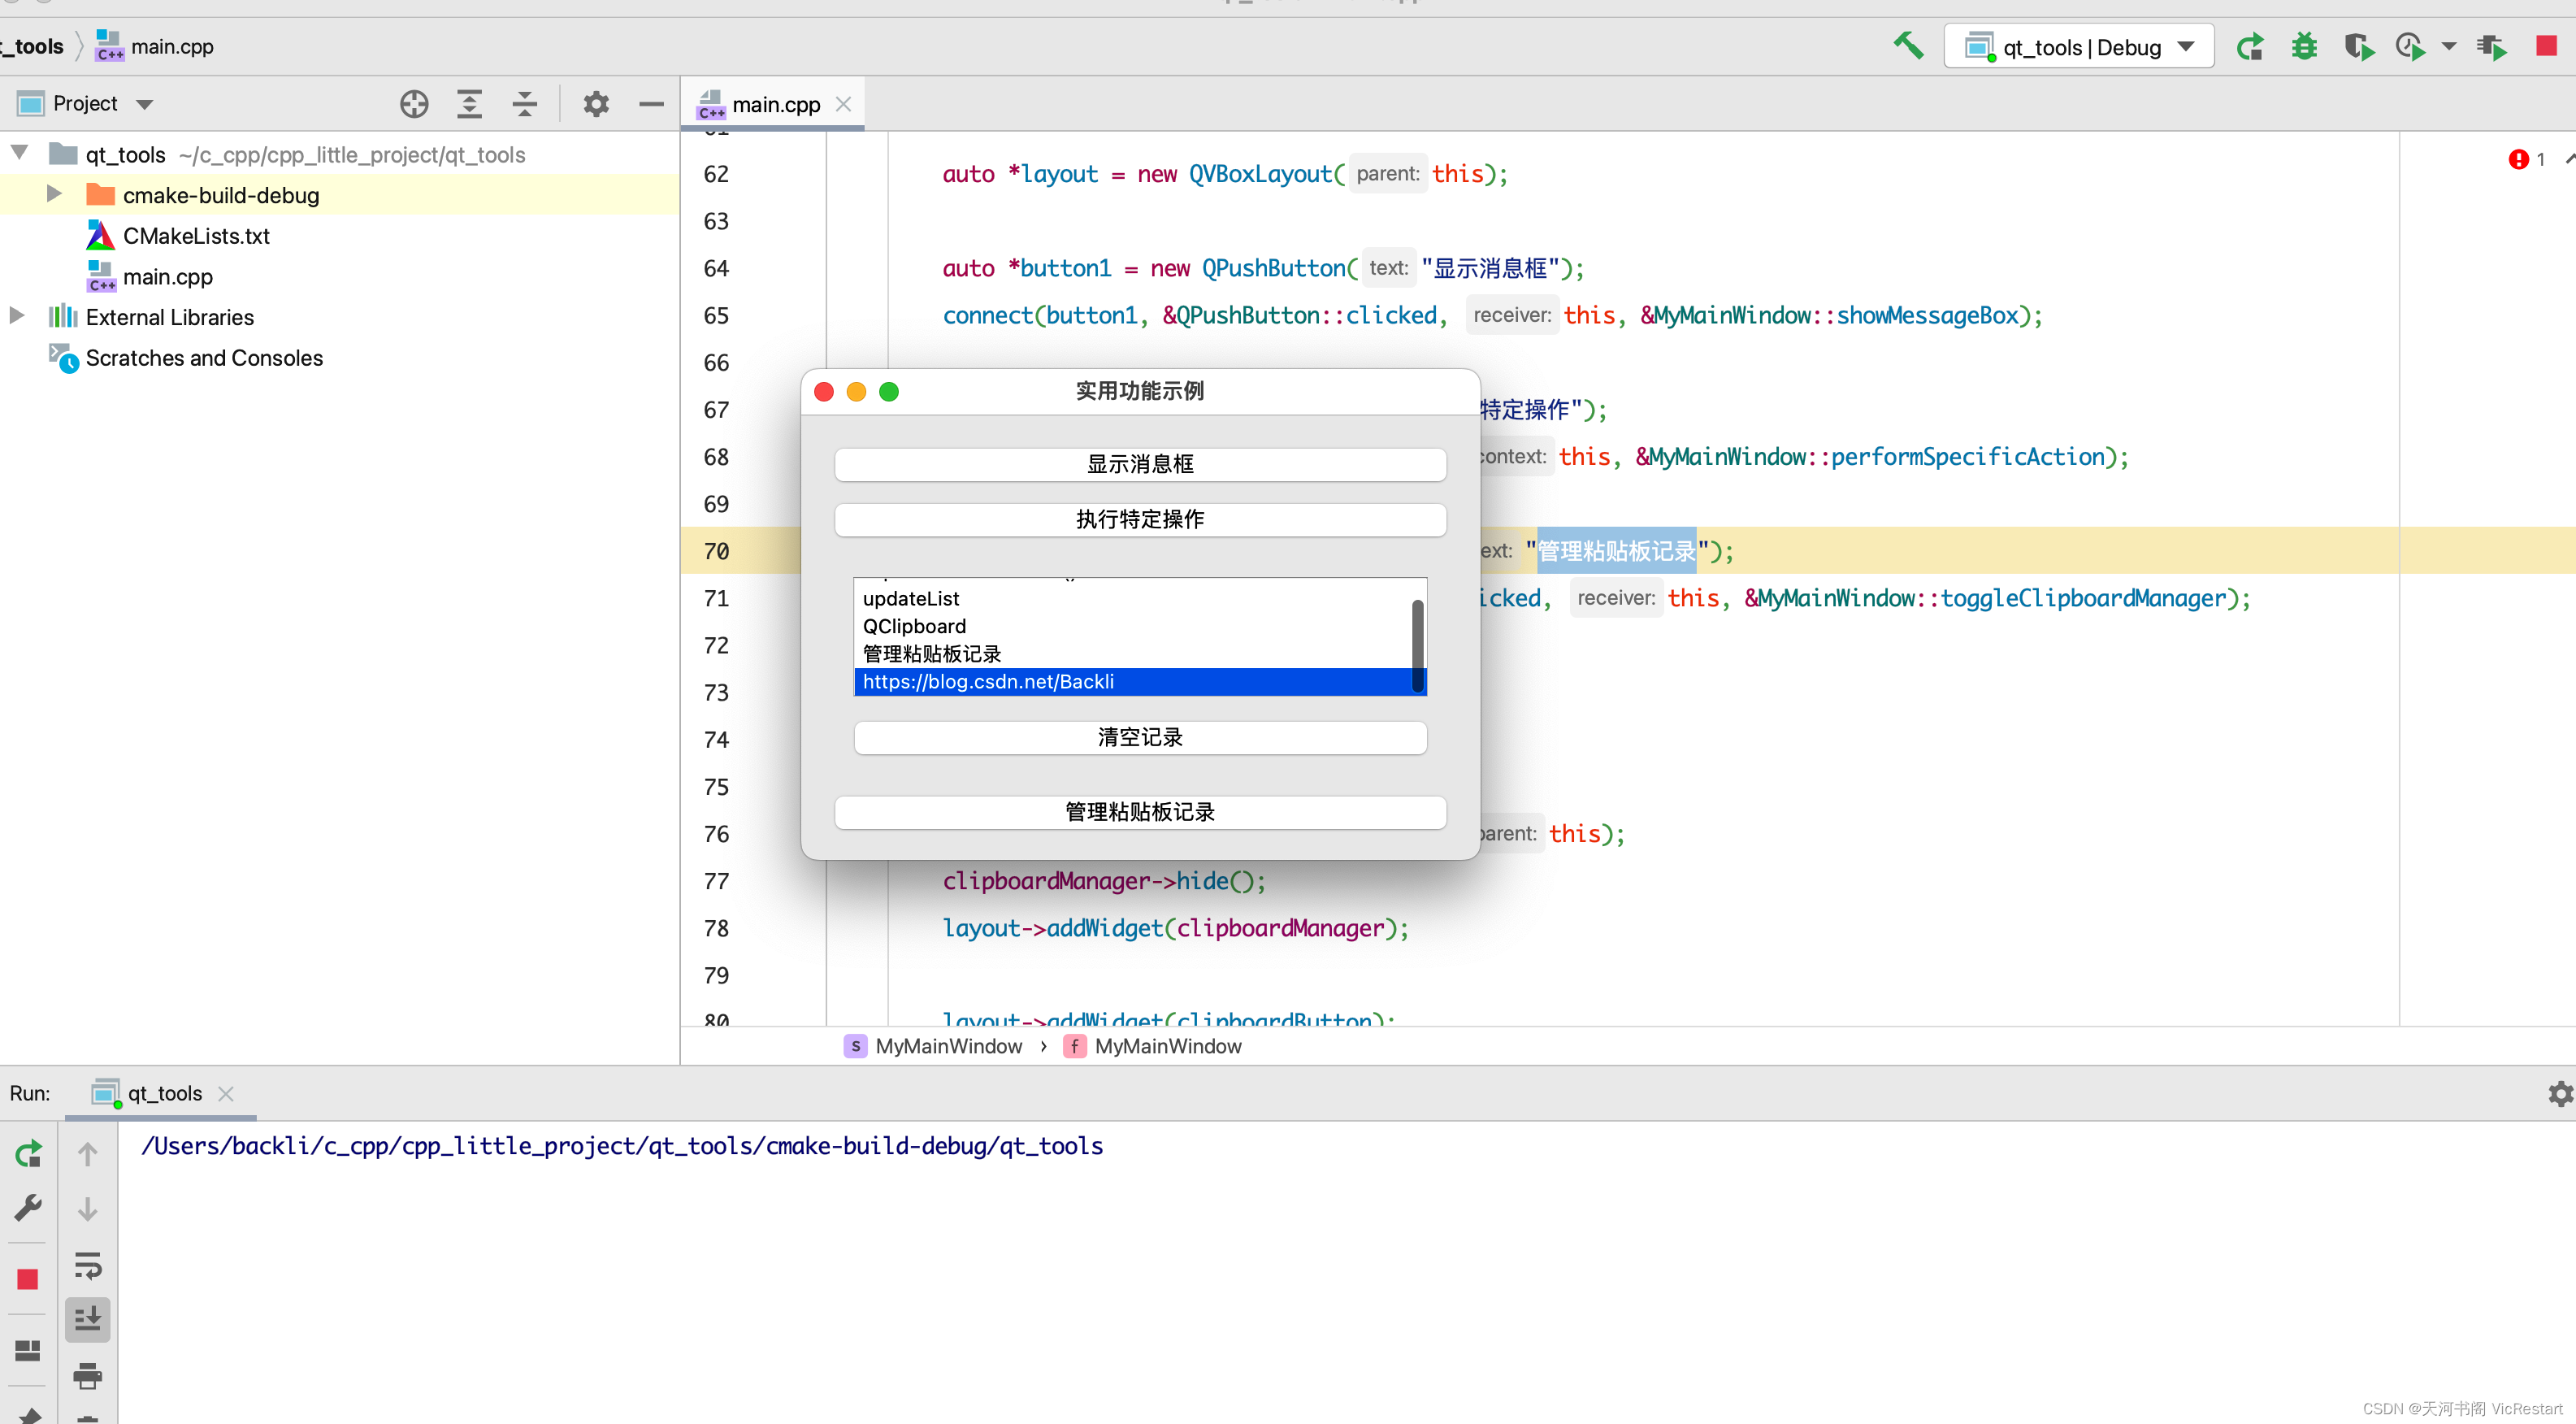
C++学习之路(八)C++ 用Qt5实现一个工具箱(增加一个粘贴板记录管理功能)- 示例代码拆分讲解
昨天,我们用 Qt5 实现了一个小工具箱的雏形《C 实现简单的Qt界面(消息弹框、按钮点击事件监听)》,但是没什么实用价值。为了增加点作用,我们今天就为这个小工具箱增加第一个小功能 「 粘贴板记录管理功能 」࿰…
如何正确选择爬虫采集接口和API?区别在哪里?
在信息时代,数据已经成为了一个国家、一个企业、一个个人最宝贵的资源。而爬虫采集接口则是获取这些数据的重要手段之一。本文将从以下八个方面进行详细讨论:
1.什么是爬虫采集接口?
2.爬虫采集接口的作用和意义是什么?
3.爬虫…
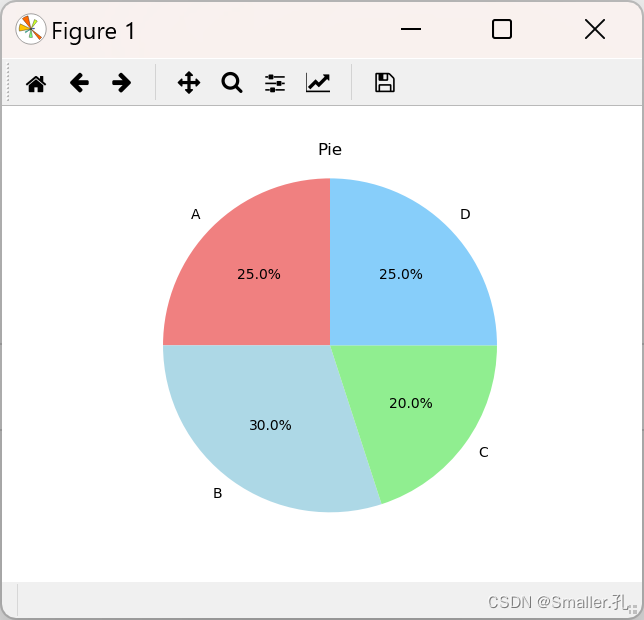
数据可视化:在Jupyter中使用Matplotlib绘制常用图表
Matplotlib是一个强大的数据可视化库,用于创建各种图表。
在Jupyter中使用Matplotlib可以轻松实现折线图、柱状图、散点图和饼图等常用图表。
本篇文章将为你详细讲解用matlpotlib绘制常用图表的方法。
1、折线图
折线图是展示数据趋势和变化的常见图表类型。
…
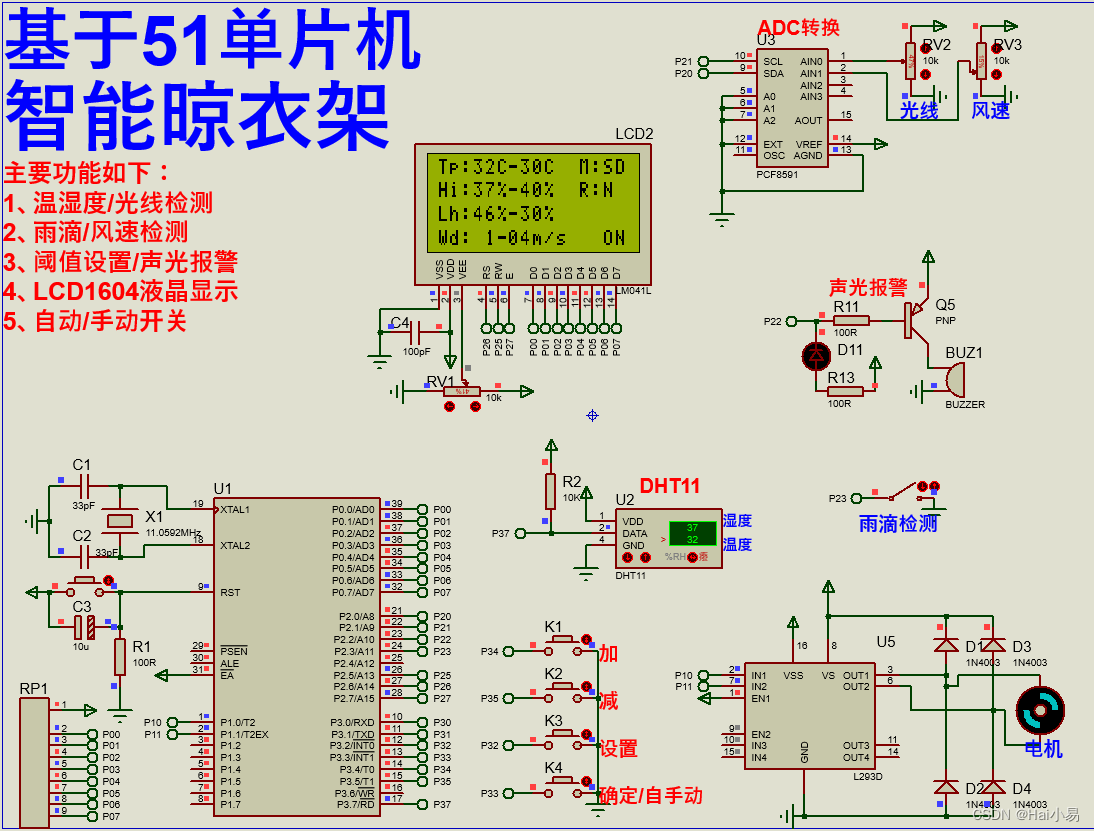
【Proteus仿真】【51单片机】智能晾衣架设计
文章目录 一、功能简介二、软件设计三、实验现象联系作者 一、功能简介
本项目使用Proteus8仿真51单片机控制器,使用LCD1604液晶、按键、蜂鸣器、L298N电机、PCF8591 ADC模块、DHT11温湿度传感器、雨滴传感器、风速、光线传感器等。 主要功能: 系统运行…

负公差智能测径仪 升级体验智能仪器
负公差轧制离不开智能测径仪 受自动化控制程度限制,一些工艺流程的操作还是依靠工人经验来完成,由于个人工作技能水平限制,尺寸控制极不稳定,因此控制台就需要及时准确的了解成品钢的尺寸及重量。现在信息的沟通主要依靠电话。取样…
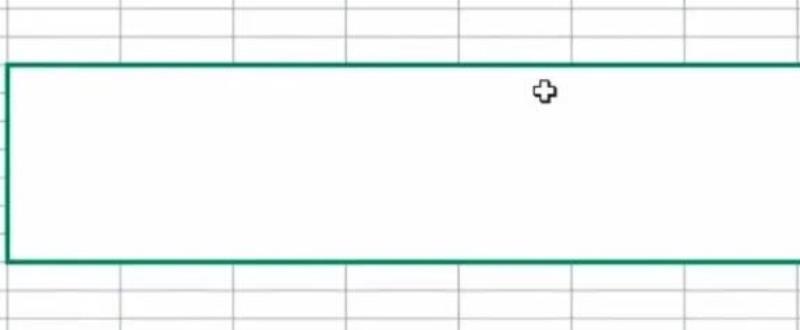
excel合并单元格教程
在表格里,总是会遇到一级表格、二级表格的区别,这时候一级表格会需要合并成一个大格子,那么excel如何合并单元格呢,其实使用快捷键或者功能键就可以了。
excel如何合并单元格:
1、首先我们用鼠标选中所有要合并的单元…
geemap学习笔记015:下载哨兵2号(Sentinel-2)数据
前言
使用GEE下载数据应该是最常见的功能了,今天就介绍一下如何使用geemap下载哨兵2号(Sentinel-2)数据,分别包括自己画感兴趣,以及利用Assets中的shp文件进行下载。
1 自己画感兴趣下载哨兵2号影像
import geemap
import eeMap geemap.M…

北美区域性确定性预测系统平均温度数据
区域确定性预测系统(RDPS)
区域确定性预测系统 (RDPS) 进行物理计算,以 10.0 公里网格(1/11 度)空间分辨率对当天到未来 48 小时内的大气元素进行确定性预测。平均温度数据覆盖北美,由加拿大气象局 (MSC) …
Python语言学习笔记之四(Python文档化)
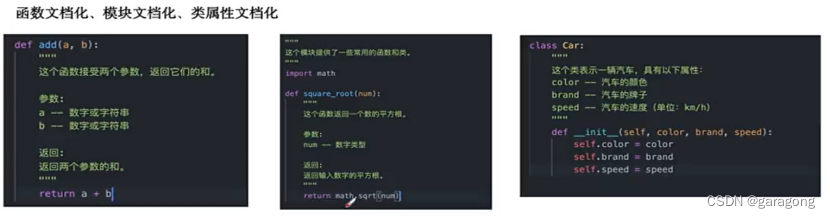
本课程对于有其它语言基础的开发人员可以参考和学习,同时也是记录下来,为个人学习使用,文档中有此不当之处,请谅解。
Python文档化是指在Python代码中添加注释和文档字符串,以提供有关代码的详细信息和说明。
文档的…

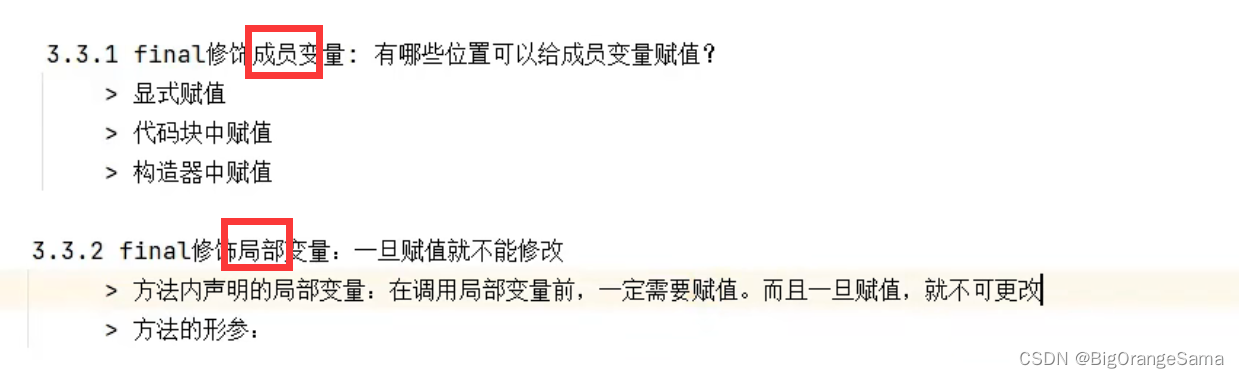
java学习part17final
110-面向对象(高级)-关键字final的使用及真题_哔哩哔哩_bilibili 1.概念 tips:java里有const关键字,但是用于保留字,不会使用,目前没有意义。
final变量没有默认赋值,只能在以下三个地方赋值,且只能赋值一…
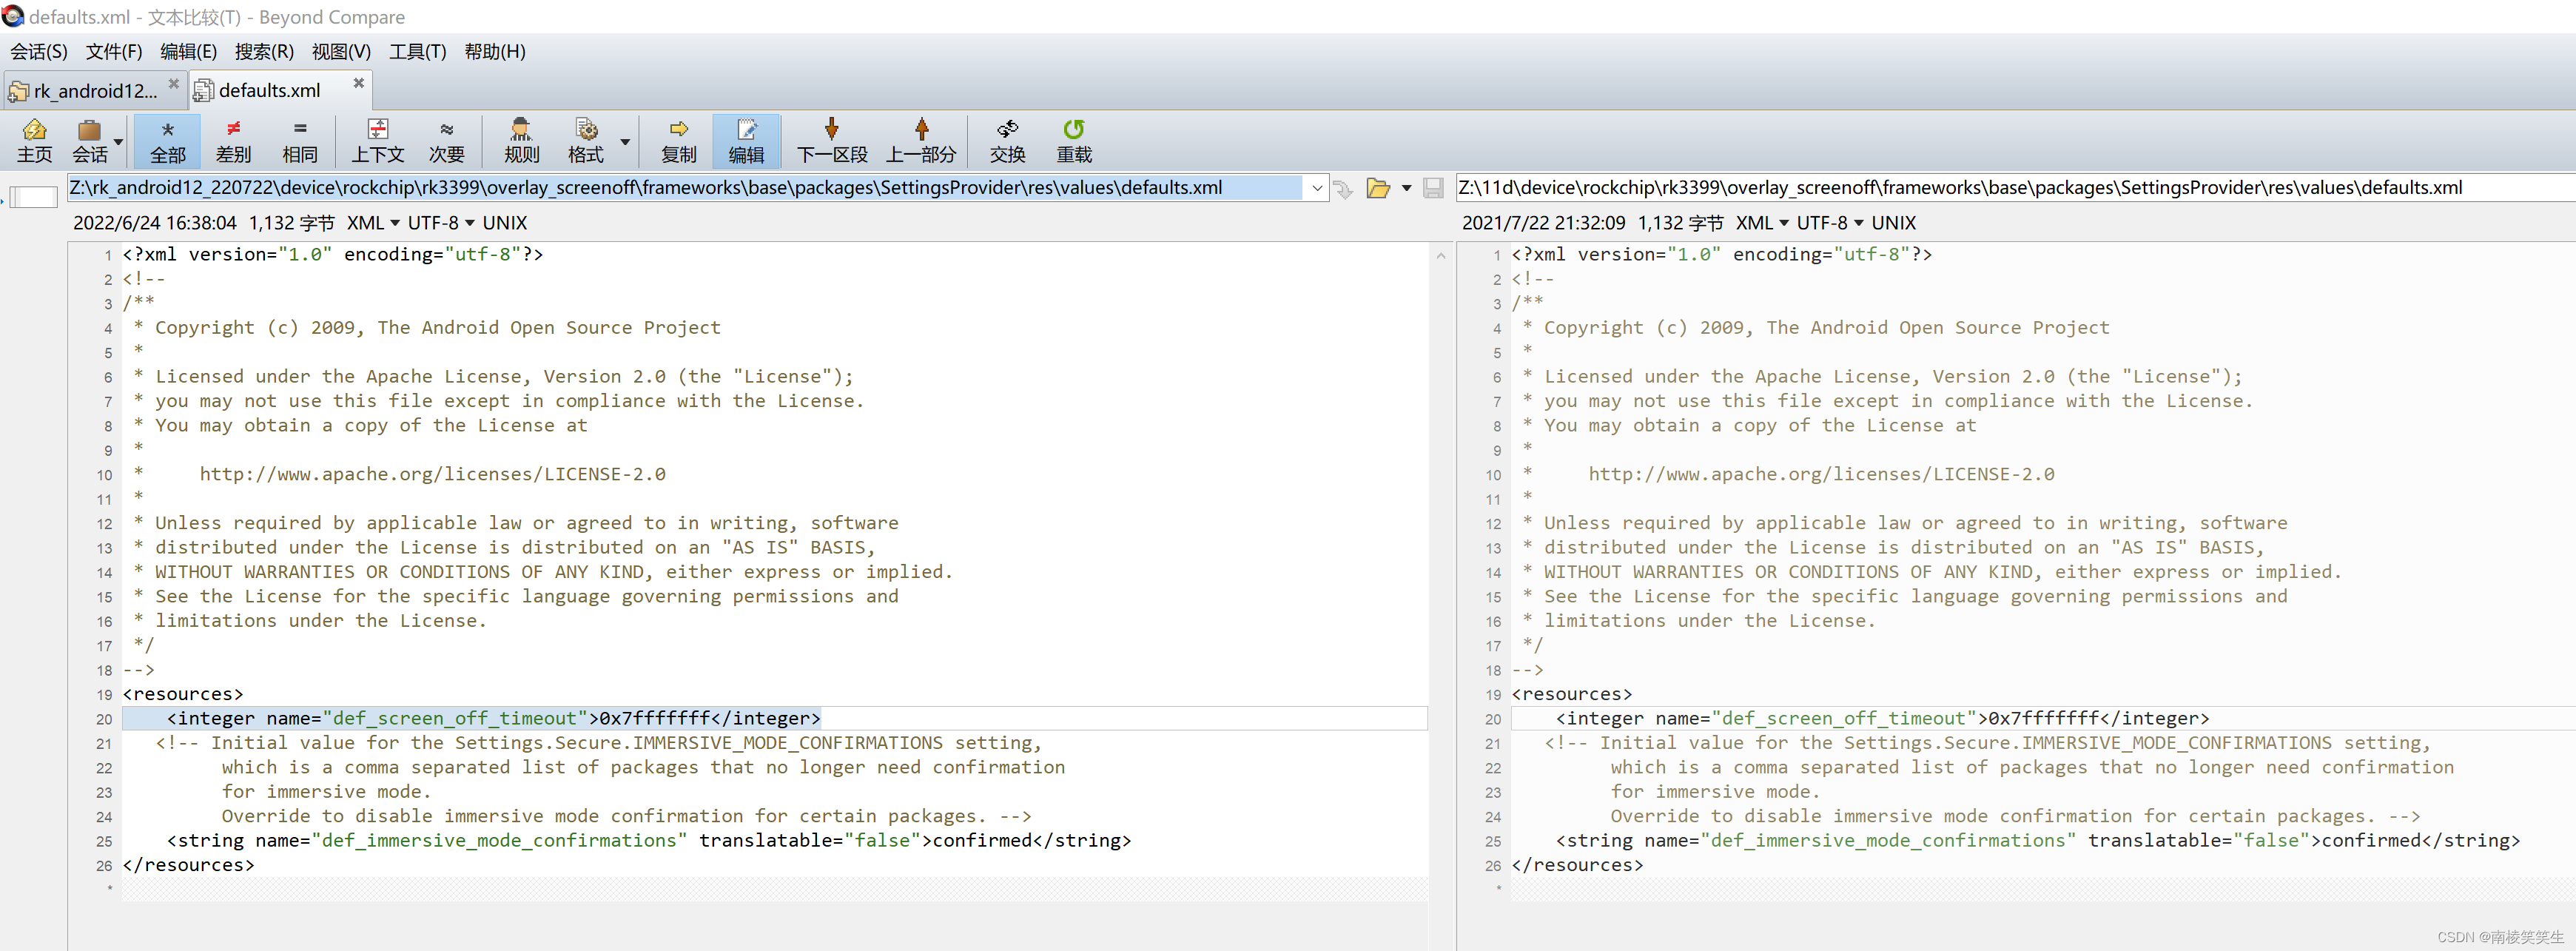
20231128让RK3399的挖掘机开发板在Andorid12系统下永不休眠
20231128让RK3399的挖掘机开发板在Andorid12系统下永不休眠 2023/11/28 7:56 适用于SOC以及系统版本: RK3399:Android10/11/12 RK3568:Android11/12 RK3588:Android12 缘起,调试的时候,RK3399的挖掘机开发板…
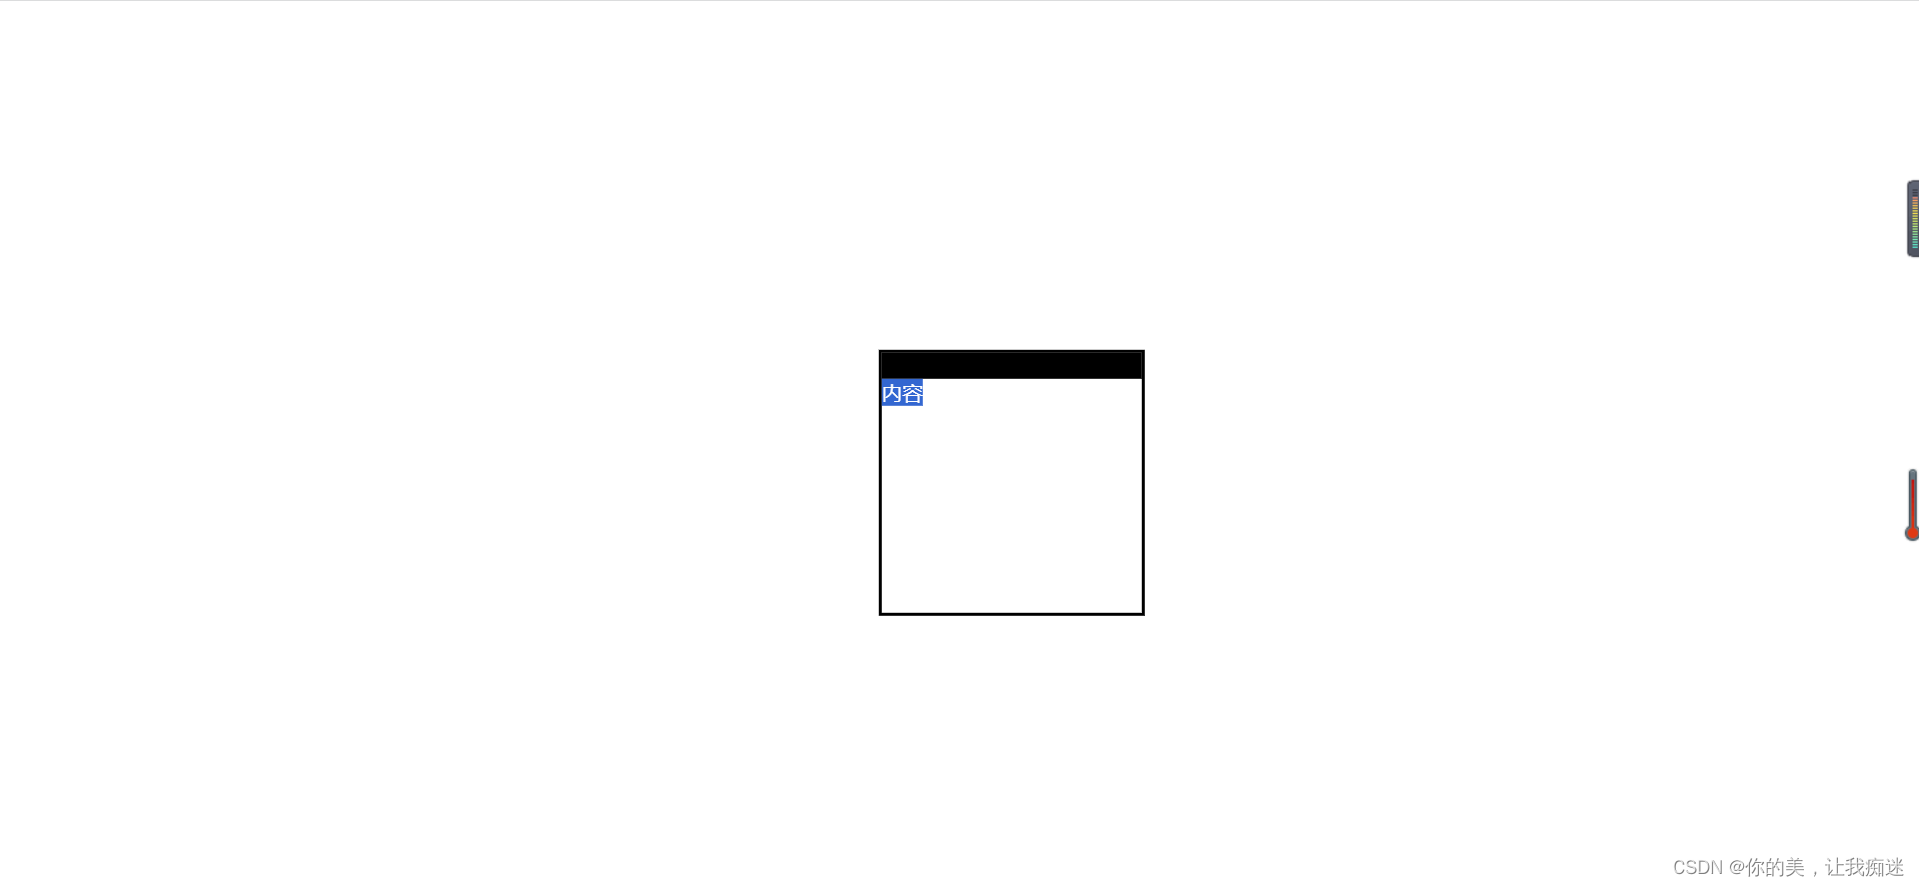
vue3+ts 指令拖拽案例
<template><div class"box" v-move><div class"header"></div><div>内容</div></div>
</template><script setup lang"ts">
import { ref, Directive, DirectiveBinding } from "vu…
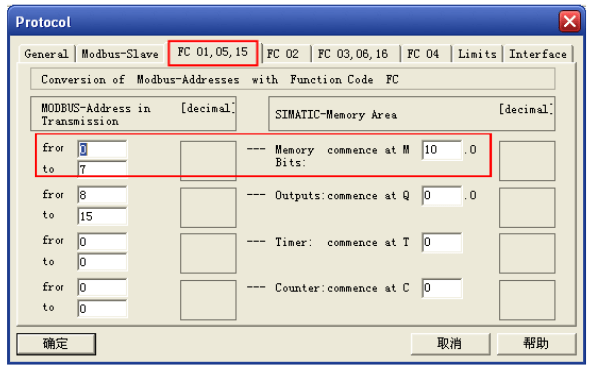
PLC与组态王之间Modbus无线通讯的从站设置
本方案主要详述了在多台西门子300PLC与组态王之间Modbus无线通讯中如何设置从站。方案中所用到的无线通讯终端是DTD434MC——欧美系PLC专用无线通讯终端。
一、方案概述
无线Modbus网络组成如下: 二、测试背景
● PC端组态软件版本:组态王6.55
● 默…
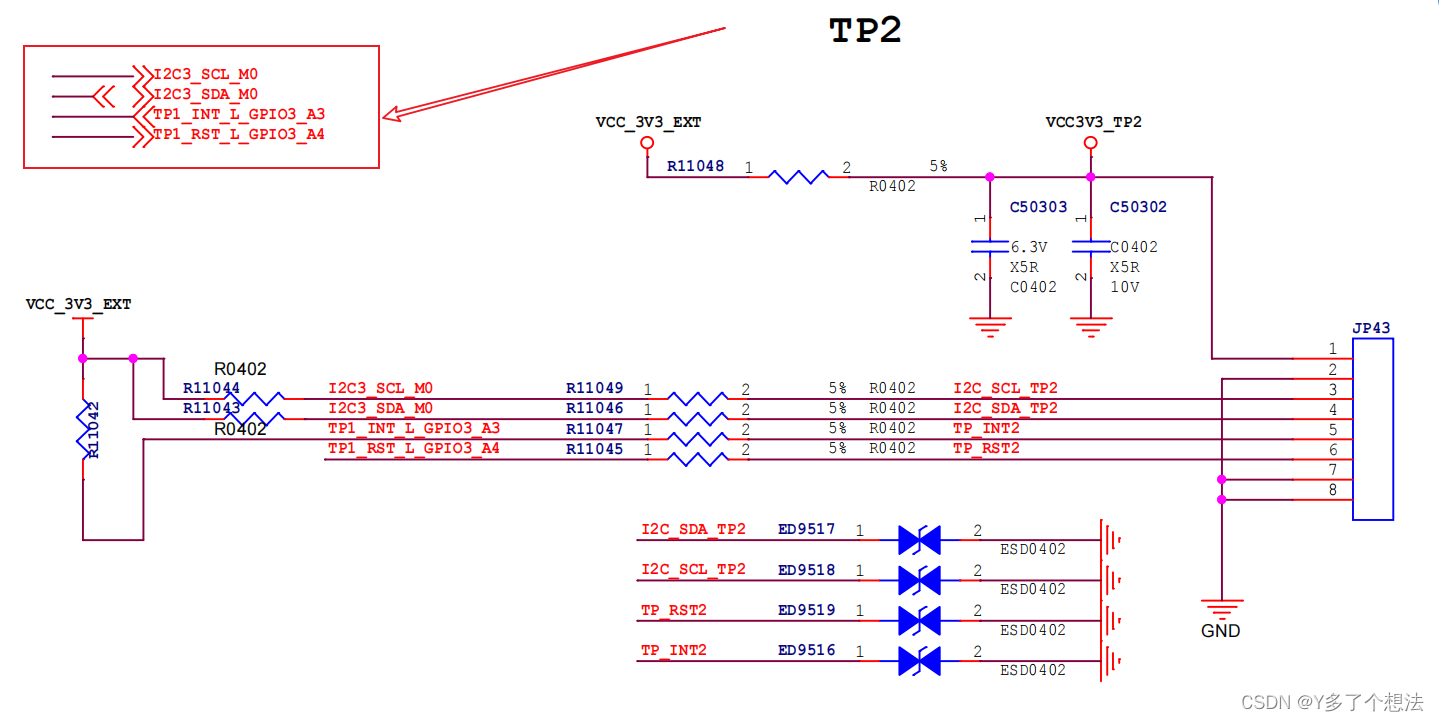
RK3568 android11 实现双路I2C触摸 --gt9xx
一,GT911 触摸屏简介
它的接口类型为 I2C ,供电电压和通讯电压均为 3.3V 。这款电容触摸屏内置了上拉电阻,这意味着我们的开发板上与该触摸屏的接口处不需要设置上拉电阻。关于线序,同样是 GT911 ,不同批次的器件都有…