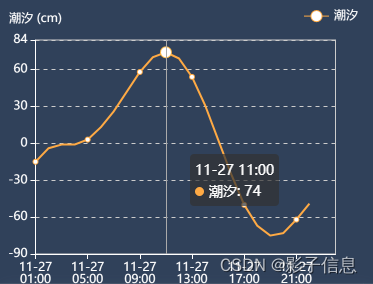
效果展示:
option参数:
let option = {
            backgroundColor: "rgba(48, 65, 90, 1)",
            title: {
                // text: obj.stnm,
                // subtext: obj.datasource,
                textStyle: {
                    color: "#ffffff"
                },
                right: 10
                // left: 'center',
                // itemGap: 4
            },
            tooltip: {
                trigger: 'axis',
                axisPointer: {
                    animation: false
                },
                // formatter: function (param) {
                //    console.log(param)
                // }
            },
            legend: {
                data: [shuiweitxt],
                textStyle: {
                    color: "#ffffff"
                },
                right: 10,
                top: 5
            },
            grid: {
                show: true,
                top: 40,
                bottom: 80,
                // left: 60,
                // right: 20
            },
            toolbox: {

            },
            xAxis: [{
                type: 'category',
                boundaryGap: false,
                axisLine: {
                    onZero: false,
                    show: true,
                    lineStyle: {
                        color: "#ffffff"
                    },
                    symbol: ['none', 'arrow']
                },
                nameTextStyle: {
                    color: "#ffffff"
                },
                axisLabel: {
                    color: "#ffffff"
                },
                data: timeData.map(function (str) {
                    return str.substring(5, 16).replace(/ /, "\n");
                })
            }],
            yAxis: [{
                nameTextStyle: {
                    color: "#ffffff"
                },
                axisLine: {
                    show: true,
                    lineStyle: {
                        color: "#ffffff"
                    },
                    symbol: ['none', 'arrow']
                },
                axisLabel: {
                    color: "#ffffff"
                },
                splitLine: {
                    lineStyle: {
                        type: 'dashed'
                    }
                },
                name: `${shuiweitxt} (${paramData?.unit})`,
                type: 'value',
                max: Math.ceil(Math.max.apply(null, shuiwei) + 10),
            }, ],
            series: [{
                name: shuiweitxt,
                type: 'line',
                symbolSize: 5,
                animation: true,
                areaStyle: {},
                itemStyle: {
                    normal: {
                        color: "#FFAA44",
                    }
                },
                lineStyle: {
                    width: 1,
                },
                markArea: {
                    silent: true,

                },
                data: shuiwei
            }, ]
        };
封装代码:
/**
     * 绘制24小时数据的曲线图
     * @param {object}
     */
    drawGXHydroEcharts: function (shuiwei, timeData, paramData) {
        // let shuiweitxt = jQuery.i18n.prop("sw_shuiwei");
        if (shuiwei.length == 0) return
        let shuiweitxt = paramData.name;
        let option = {
            backgroundColor: "rgba(48, 65, 90, 1)",
            title: {
                // text: obj.stnm,
                // subtext: obj.datasource,
                textStyle: {
                    color: "#ffffff"
                },
                right: 10
                // left: 'center',
                // itemGap: 4
            },
            tooltip: {
                trigger: 'axis',
                axisPointer: {
                    animation: false
                },
                // formatter: function (param) {
                //    console.log(param)
                // }
            },
            legend: {
                data: [shuiweitxt],
                textStyle: {
                    color: "#ffffff"
                },
                right: 10,
                top: 5
            },
            grid: {
                show: true,
                top: 40,
                bottom: 80,
                // left: 60,
                // right: 20
            },
            toolbox: {

            },
            xAxis: [{
                type: 'category',
                boundaryGap: false,
                axisLine: {
                    onZero: false,
                    show: true,
                    lineStyle: {
                        color: "#ffffff"
                    },
                    symbol: ['none', 'arrow']
                },
                nameTextStyle: {
                    color: "#ffffff"
                },
                axisLabel: {
                    color: "#ffffff"
                },
                data: timeData.map(function (str) {
                    return str.substring(5, 16).replace(/ /, "\n");
                })
            }],
            yAxis: [{
                nameTextStyle: {
                    color: "#ffffff"
                },
                axisLine: {
                    show: true,
                    lineStyle: {
                        color: "#ffffff"
                    },
                    symbol: ['none', 'arrow']
                },
                axisLabel: {
                    color: "#ffffff"
                },
                splitLine: {
                    lineStyle: {
                        type: 'dashed'
                    }
                },
                name: `${shuiweitxt} (${paramData?.unit})`,
                type: 'value',
                max: Math.ceil(Math.max.apply(null, shuiwei) + 10),
            }, ],
            series: [{
                name: shuiweitxt,
                type: 'line',
                symbolSize: 5,
                animation: true,
                areaStyle: {},
                itemStyle: {
                    normal: {
                        color: "#FFAA44",
                    }
                },
                lineStyle: {
                    width: 1,
                },
                markArea: {
                    silent: true,

                },
                data: shuiwei
            }, ]
        };
        let mainContainer = document.getElementById(paramData.echartId); //'guangxiHydro4'
        //用于使chart自适应高度和宽度,通过窗体高宽计算容器高宽
        const resizeMainContainer = function () {
            mainContainer.style.width = window.innerWidth + 'px';
            mainContainer.style.height = window.innerHeight * 0.5 + 'px';
        };
        //设置div容器高宽
        resizeMainContainer();
        // 初始化图表
        let myChart = echarts.getInstanceByDom(mainContainer); //有的话就获取已有echarts实例的DOM节点。
        if (myChart == null) { // 如果不存在,就进行初始化。
            myChart = echarts.init(mainContainer);
        }
        $(window).on('resize', function () { //
            //屏幕大小自适应,重置容器高宽
            resizeMainContainer();
            myChart.resize();
        });
        myChart.setOption(option);
    },
备注:
数据传参,格式如下:
//传参1:
[-15, -4, -1, -1, 3, 13, 26, 42, 58, 70, 74, 69, 54, 31, 3, -25, -50, -67, -75, -73, -62, -49]
//传参2:
['2023-11-27 01:00:00', '2023-11-27 02:00:00', '2023-11-27 03:00:00', '2023-11-27 04:00:00', '2023-11-27 05:00:00', '2023-11-27 06:00:00', '2023-11-27 07:00:00', '2023-11-27 08:00:00', '2023-11-27 09:00:00', '2023-11-27 10:00:00', '2023-11-27 11:00:00', '2023-11-27 12:00:00', '2023-11-27 13:00:00', '2023-11-27 14:00:00', '2023-11-27 15:00:00', '2023-11-27 16:00:00', '2023-11-27 17:00:00', '2023-11-27 18:00:00', '2023-11-27 19:00:00', '2023-11-27 20:00:00', '2023-11-27 21:00:00', '2023-11-27 22:00:00', '2023-11-27 23:00:00', '2023-11-28 00:00:00']
//传参3:
{nodeId: 'swiper-1', name: '温度', iconUrl: 'icon_caoxi', unit: 'cm', echartId: 'guangxiHydro1'}