部署Elasticsearch集群详细步骤参考本人:
https://blog.csdn.net/m0_59933574/article/details/134605073?spm=1001.2014.3001.5502 https://blog.csdn.net/m0_59933574/article/details/134605073?spm=1001.2014.3001.5502
kibana部署
es集群设备
| 安装软件 | 主机名 | IP地址 | 系统版本 | 配置 |
|---|---|---|---|---|
| Elasticsearch | elk-1 | 192.168.231.245 | centos7.5.1804 | 3核4G |
| Elasticsearch | es1 | 192.168.231.246 | centos7.5.1804 | 2核4G |
| Elasticsearch | es2 | 192.168.231.247 | centos7.5.1804 | 2核4G |
软件版本:kibana-7.13.2-linux-x86_64.tar.gz
三台机器都启动Elasticsearch,elk-1还启动head
1. 安装配置Kibana
只在elk-1上安装
安装,解压
有包直接上传到/root
rz

解压
[root@elk-1 ~]# tar zxf kibana-7.13.2-linux-x86_64.tar.gz -C /usr/local/
2.配置
[root@elk-1 ~]# cat /usr/local/kibana-7.13.2-linux-x86_64/config/kibana.yml

server.port: 5601
server.host: "192.168.231.245"
elasticsearch.hosts: ["http://192.168.231.245:9200"]
kibana.index: ".kibana"
i18n.locale: "zh-CN"
server.port 监听端口 5601
server.host 本机的IP
elasticsearch.hosts : 查询es节点的URL
3. 配置项含义
server.port kibana服务端口,默认5601
server.host kibana主机IP地址,默认localhost
elasticsearch.url   用来做查询的ES节点的URL,默认http://localhost:9200
kibana.index        kibana在Elasticsearch中使用索引来存储保存的searches, visualizations和dashboards,默认.kibana
4.启动
[root@elk-1 ~]# cd /usr/local/kibana-7.13.2-linux-x86_64/kibana不能使用root用户启动

正确启动
![]()
5.观察kibana
http://192.168.231.245:5601
如果出现Kibana server is not ready yet

将es集群全部启动即可
6.再次访问web端

安装配置nginx反向代理
还是在elk-1那台服务器做实验
1. 配置yum源
[root@elk-1 ~]# rpm -ivh http://nginx.org/packages/centos/7/noarch/RPMS/nginx-release-centos-7-0.el7.ngx.noarch.rpm2. 下载nginx
[root@elk-1 ~]# yum -y install nginx 3.安装httpd-tools
用于生成nginx认证访问的用户密码文件
[root@elk-1 ~]# yum install -y nginx httpd-tools4. 配置反向代理
[root@elk-1 ~]# cat /etc/nginx/nginx.conf
user  nginx;
worker_processes  auto;
error_log  /var/log/nginx/error.log;
pid        /var/run/nginx.pid;
worker_rlimit_nofile 65535;

events {
    worker_connections  65535;
    use epoll;
}

http {
    include       mime.types;
    default_type  application/octet-stream;

    log_format  main  '$remote_addr - $remote_user [$time_local] "$request" '
                      '$status $body_bytes_sent "$http_referer" '
                      '"$http_user_agent" "$http_x_forwarded_for"';

    access_log  /var/log/nginx/access.log  main;
    server_names_hash_bucket_size 128;
    autoindex on;

    sendfile        on;
    tcp_nopush     on;
    tcp_nodelay on;

    keepalive_timeout  120;
    fastcgi_connect_timeout 300;
    fastcgi_send_timeout 300;
    fastcgi_read_timeout 300;
    fastcgi_buffer_size 64k;
    fastcgi_buffers 4 64k;
    fastcgi_busy_buffers_size 128k;
    fastcgi_temp_file_write_size 128k;

    #gzip模块设置
    gzip on; #开启gzip压缩输出
    gzip_min_length 1k;    #最小压缩文件大小
    gzip_buffers 4 16k;    #压缩缓冲区
    gzip_http_version 1.0;    #压缩版本(默认1.1,前端如果是squid2.5请使用1.0)
    gzip_comp_level 2;    #压缩等级
    gzip_types text/plain application/x-javascript text/css application/xml;    #压缩类型,默认就已经包含textml,所以下面就不用再写了,写上去也不会有问题,但是会有一个warn。
    gzip_vary on;
    #开启限制IP连接数的时候需要使用
    #limit_zone crawler $binary_remote_addr 10m;
    #tips:
    #upstream bakend{#定义负载均衡设备的Ip及设备状态}{
    #    ip_hash;
    #    server 127.0.0.1:9090 down;
    #    server 127.0.0.1:8080 weight=2;
    #    server 127.0.0.1:6060;
    #    server 127.0.0.1:7070 backup;
    #}
    #在需要使用负载均衡的server中增加 proxy_pass http://bakend/;
    server {
        listen       80;
        server_name  192.168.231.245;

        #charset koi8-r;

       # access_log  /var/log/nginx/host.access.log  main;
        access_log off;

         location / {
             auth_basic "Kibana";   #可以是string或off,任意string表示开启认证,off表示关闭认证。
             auth_basic_user_file /etc/nginx/passwd.db;   #指定存储用户名和密码的认证文件。
             proxy_pass http://192.168.231.245:5601;
             proxy_set_header Host $host:5601;
             proxy_set_header X-Real-IP $remote_addr;
             proxy_set_header X-Forwarded-For $proxy_add_x_forwarded_for;
             proxy_set_header Via "nginx";
                     }
         location /status {
             stub_status on; #开启网站监控状态
             access_log /var/log/nginx/kibana_status.log; #监控日志
             auth_basic "NginxStatus"; }

         location /head/ {
             auth_basic "head";
             auth_basic_user_file /etc/nginx/passwd.db;
             proxy_pass http://192.168.231.245:9100/;
             proxy_set_header Host $host:9100;
             proxy_set_header X-Real-IP $remote_addr;
             proxy_set_header X-Forwarded-For $proxy_add_x_forwarded_for;
             proxy_set_header Via "nginx";
                         }

        # redirect server error pages to the static page /50x.html
        error_page   500 502 503 504  /50x.html;
        location = /50x.html {
            root   html;
        }
    }
}
修改事项:
将worker_processes改成auto
将server_name改成本机IP
location内的所有proxy_pass 改成本机的IP
5. 配置授权用户和密码
[root@elk-1 ~]# htpasswd -cm /etc/nginx/passwd.db kibana

[root@elk-1 ~]# htpasswd -m /etc/nginx/passwd.db head
第一次加c,第二次不加c。如果第二次也+c,会将第一次添加的覆盖掉
6. 启动nginx
[root@elk-1 ~]# systemctl start nginx访问,只访问http://192.168.231.245 那么会跳转到kibana


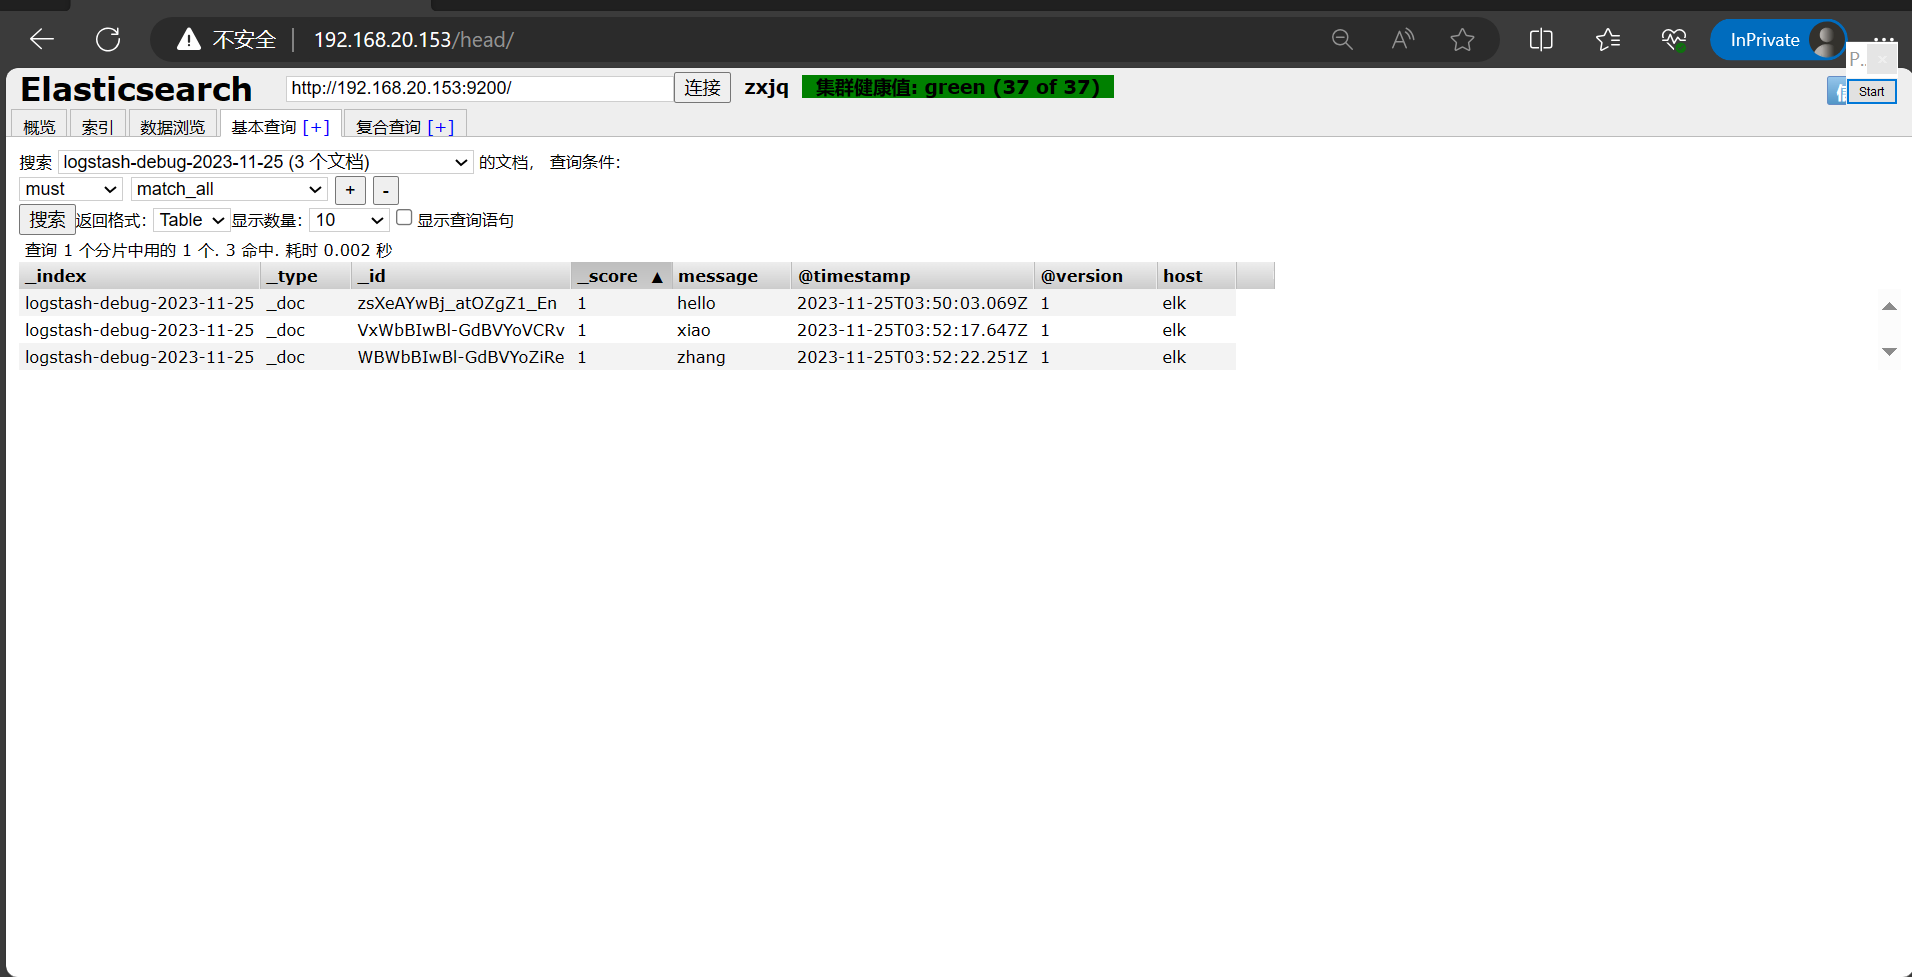
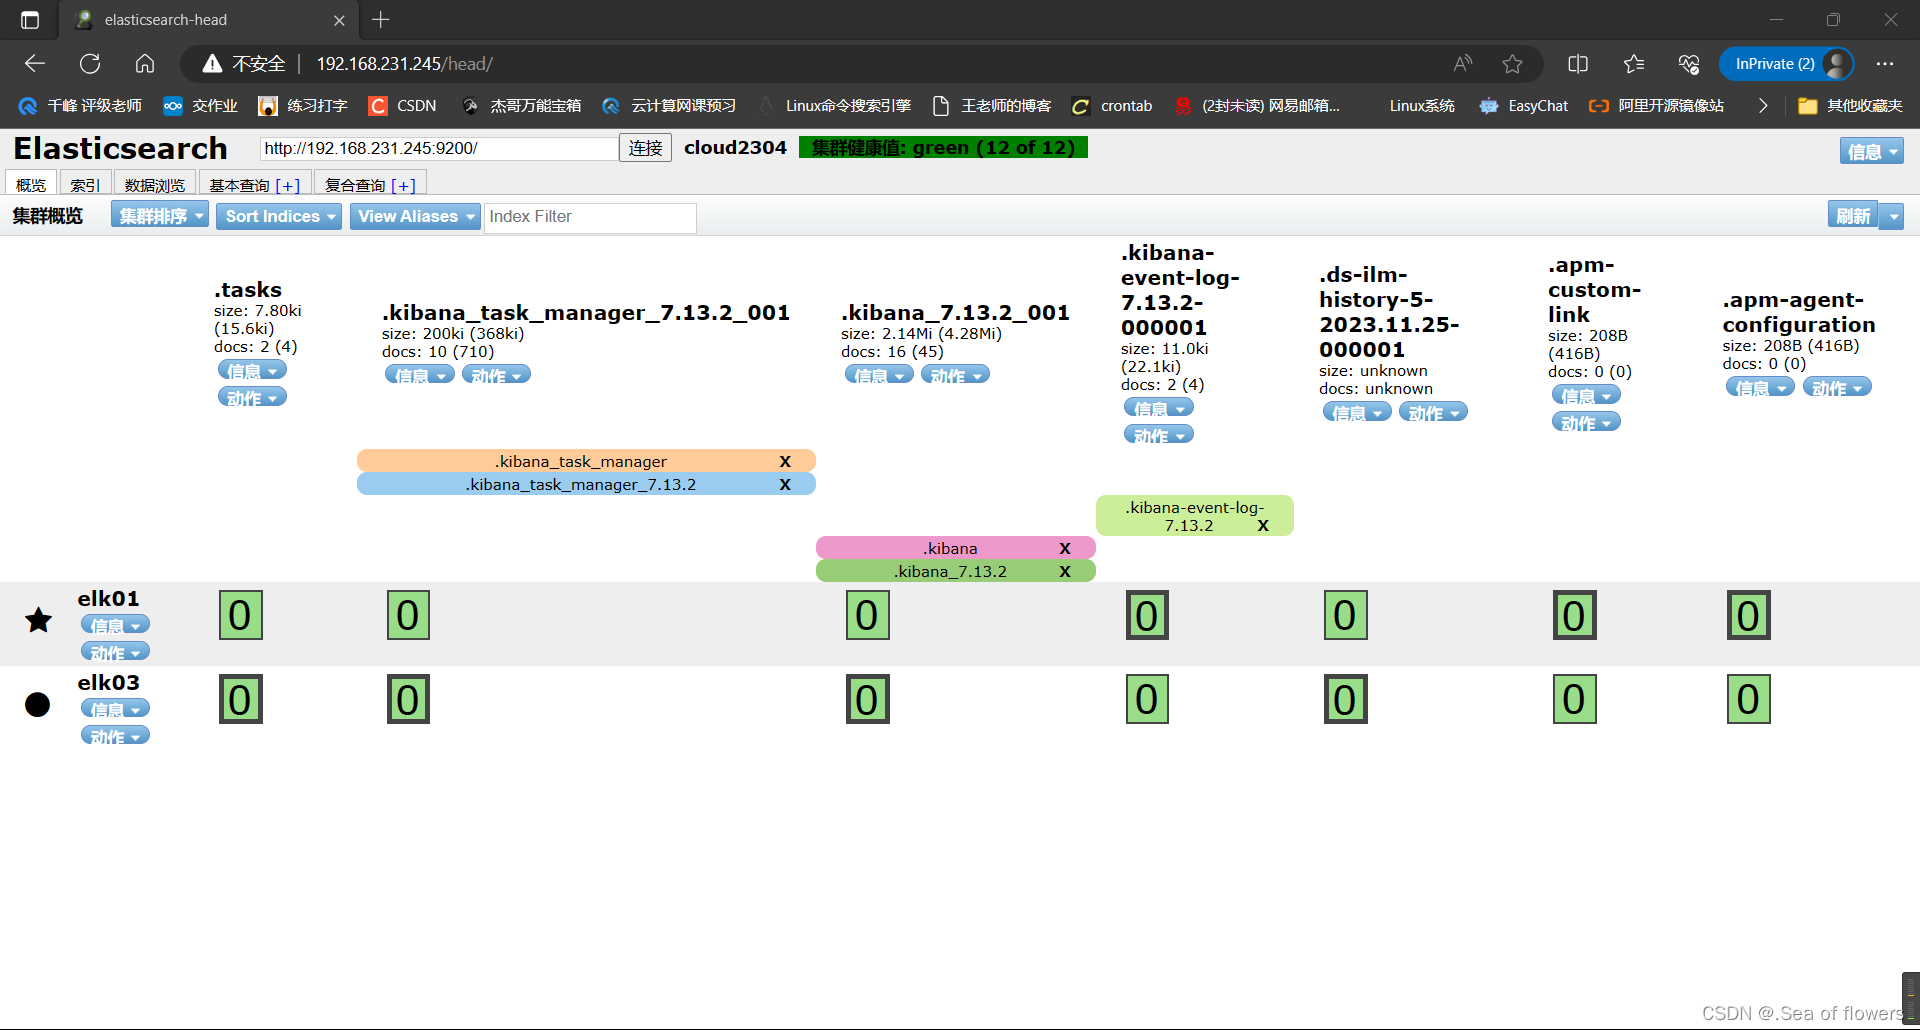
访问head,输入http://192.168.231.245/head
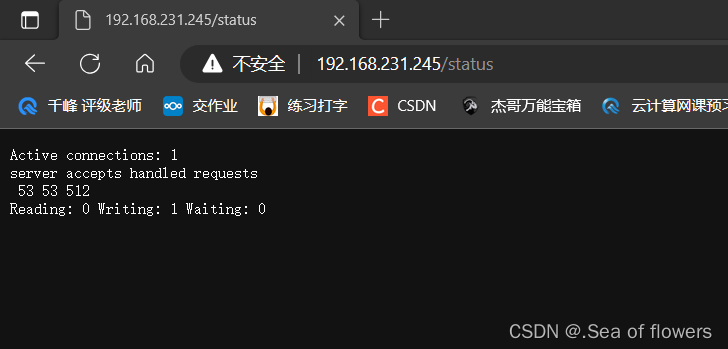
访问status,访问http://192.168.231.245/status
介绍:
Kibana是一个开源的数据可视化和分析平台,它是弹性搜索栈(Elastic Stack)的一部分,旨在帮助用户以更直观和交互式的方式分析和查询数据。Kibana提供了丰富的可视化选项,包括图表、地图和仪表板,可以对弹性搜索集群中的数据进行实时分析和可视化。Kibana还提供强大的查询工具和聚合框架,可以针对大规模的数据集进行高效的查询和分析。Kibana还支持实时协作和数据共享,可以获取团队内共享的仪表板和可视化项目。