文章目录
- 前言
- 环境
- 代码
- 接口
- 使用
- 效果
- 后言
前言
hello world欢迎来到前端的新世界
😜当前文章系列专栏:react.js
🐱👓博主在前端领域还有很多知识和技术需要掌握,正在不断努力填补技术短板。(如果出现错误,感谢大家指出)🌹
💖感谢大家支持!您的观看就是作者创作的动力
环境
react版本:^18.2.0
echarts版本:^5.4.3
ts版本:^6.0.0
代码
import * as echarts from 'echarts';

import {useEffect} from "react";
interface ChildProps {
    data: Option;
}
const View = (props:ChildProps)=>{
    useEffect(()=>{
        const myChart = echarts.init(document.getElementById("echarts"))
        // eslint-disable-next-line @typescript-eslint/ban-ts-comment
        // @ts-ignore
        myChart.setOption(props.data)
    },[])
    window.addEventListener("resize",()=>{
        const myChart = echarts.init(document.getElementById("echarts"))
        myChart.resize()
    })
    return (
        <div id="echarts" style={{width:"80vw",height:"50vh "}}>

        </div>
    )
}

export default View;
接口
interface Option{
    xAxis: {
        type: string;
        data: string[];
    };
    yAxis: {
        type: string;
    };
    series: {
        data: number[];
        type: string;
    }[];
    [key: string]: unknown;
}
使用
// 导入
import Graph from "@/components/Graph"
const View = ()=>{
    const option = {
            tooltip: {
                trigger: 'axis',
                axisPointer: {
                    // Use axis to trigger tooltip
                    type: 'shadow' // 'shadow' as default; can also be 'line' or 'shadow'
                }
            },
            legend: {},
            grid: {
                left: '3%',
                right: '4%',
                bottom: '3%',
                containLabel: true
            },
            xAxis: {
                type: 'value'
            },
            yAxis: {
                type: 'category',
                data: ['Mon', 'Tue', 'Wed', 'Thu', 'Fri', 'Sat', 'Sun']
            },
            series: [
                {
                    name: 'Direct',
                    type: 'bar',
                    stack: 'total',
                    label: {
                        show: true
                    },
                    emphasis: {
                        focus: 'series'
                    },
                    data: [320, 302, 301, 334, 390, 330, 320]
                },
                {
                    name: 'Mail Ad',
                    type: 'bar',
                    stack: 'total',
                    label: {
                        show: true
                    },
                    emphasis: {
                        focus: 'series'
                    },
                    data: [120, 132, 101, 134, 90, 230, 210]
                },
                {
                    name: 'Affiliate Ad',
                    type: 'bar',
                    stack: 'total',
                    label: {
                        show: true
                    },
                    emphasis: {
                        focus: 'series'
                    },
                    data: [220, 182, 191, 234, 290, 330, 310]
                },
                {
                    name: 'Video Ad',
                    type: 'bar',
                    stack: 'total',
                    label: {
                        show: true
                    },
                    emphasis: {
                        focus: 'series'
                    },
                    data: [150, 212, 201, 154, 190, 330, 410]
                },
                {
                    name: 'Search Engine',
                    type: 'bar',
                    stack: 'total',
                    label: {
                        show: true
                    },
                    emphasis: {
                        focus: 'series'
                    },
                    data: [820, 832, 901, 934, 1290, 1330, 1320]
                }
            ]
        }

    return(
        <div className="sonPage1">
            <Graph data={option}></Graph>

        </div>
    )
}

export default View;
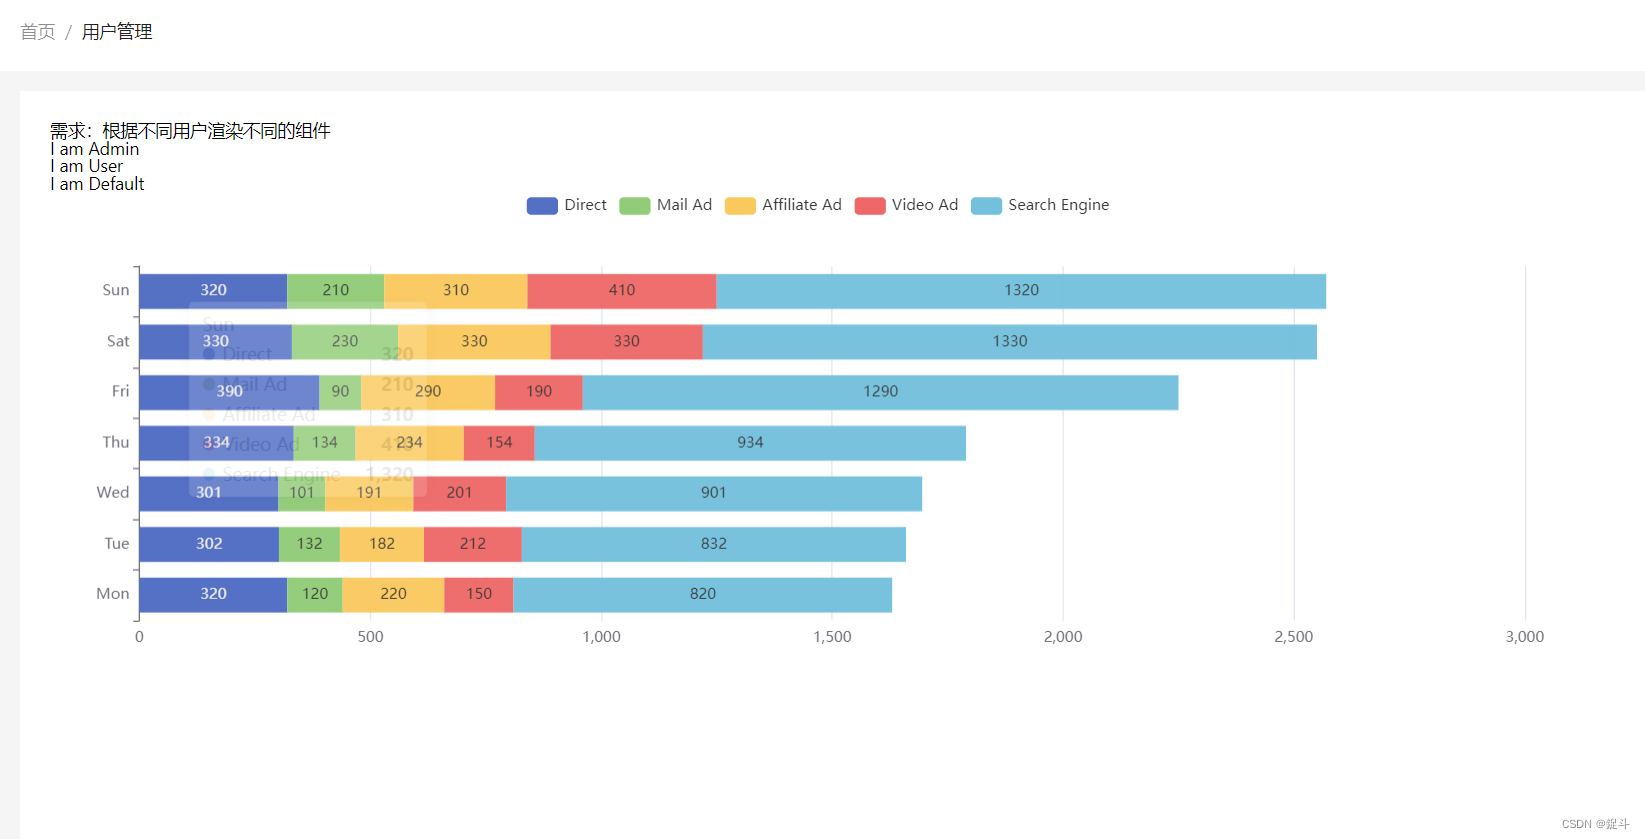
效果
后言
创作不易,要是本文章对广大读者有那么一点点帮助 不妨三连支持一下,您的鼓励就是博主创作的动力