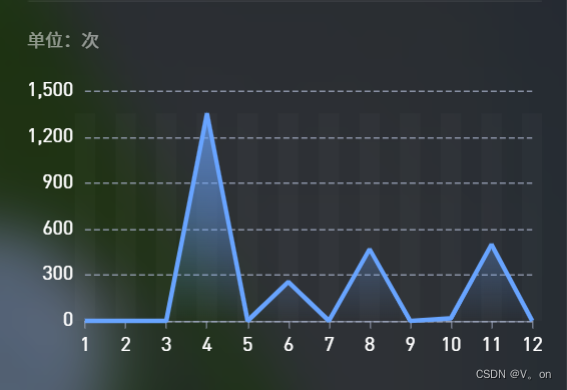
vue3之echarts区域折线图
效果:
核心代码:
<template>
    <div class="abnormal">
        <div class="per">单位:{{ obj.data?.unit }}</div>
        <div class="chart" ref="chartsRef"></div>
    </div>
</template>

<script setup>
import * as echarts from 'echarts';
import { reactive, onMounted } from 'vue';

const obj = reactive({
    data: {
        xdata: ['1', '2', '3', '4', '5', '6', '7', '8', '9', '10', '11', '12'],
        ydata: [ 0, 0, 0, 1354, 0, 254, 0, 468, 0, 16, 498, 0],
        unit: '次'
    },
    op: {
        tooltip: {},
        grid: {
            top: '5%',
            left: '0%',
            right: '2%',
            bottom: '0%',
            containLabel: true,
        },
        xAxis: null,
        yAxis: [
            {
                type: 'value',
                nameLocation: 'end',
                axisTick: {
                    show: false,
                },
                axisLine: {
                    show: false,
                },
                axisLabel: {
                    textStyle: {
                        fontSize: 13,
                        color: '#ffffff',
                        fontFamily: 'DINPro-Regular',
                    },
                    padding: [0, 0, 0, -10],
                },
                splitLine: {
                    lineStyle: {
                        type: 'dashed',
                        color: 'rgba(160, 169, 192, 0.8)',
                    },
                },
            },
        ],
        series: [],
    },
})
let myCharts = null;
let chartsRef = ref(null)

const flushChart = () => {
    obj.op.xAxis = {};
    obj.op.series = [];
    obj.op.tooltip = {};

    obj.op.tooltip = {
        trigger: 'axis',
        axisPointer: {
            type: 'shadow',
            lineStyle: {
                color: 'rgba(135, 140, 147, 0.6)',
            },
        },
        formatter(params) {
            return `${params[0].name}月 : ${params[1].value}`;
        },
        backgroundColor: 'rgba(45, 105, 133, 0.8)',
        borderWidth: 0,
        textStyle: {
            color: '#DAE3E7',
            fontFamily: 'DINPro-Regular',
        },
    };
    obj.op.xAxis = {
        type: 'category',
        boundaryGap: false, // 坐标轴两边留白
        data: obj.data.xdata,
        axisLabel: {
            margin: 10,
            textStyle: {
                color: '#ffffff',
                fontSize: 13,
                fontFamily: 'DINPro-Regular',
            },

        },
        axisLine: {
            lineStyle: {
                color: 'rgba(160, 169, 192, 0.6)',
            },
        },
        axisTick: {
            show: true,
        },
    };
    obj.op.series.push(
        {
            name: 'bg',
            type: 'bar',
            data: [...Array(obj.data.ydata.length).fill(Math.max(...obj.data.ydata) === 0 ? 10 : Math.max(...obj.data.ydata))],
            barWidth: '50%',
            itemStyle: {
                color: 'rgba(255, 255, 255, 0.02)',
            },
        },
    );
    obj.op.series.push(
        {
            type: 'line',
            symbol: 'none',
            itemStyle: {
                normal: {
                    color: '#68A4FF',
                    lineStyle: {
                        color: '#68A4FF',
                        width: 3,
                    },
                    areaStyle: {
                        // 区域填充样式
                        color: new echarts.graphic.LinearGradient(0, 1, 0, 0, [
                            {
                                offset: 0,
                                color: 'rgba(104,164,255,0)',
                            }, {
                                offset: 0.5,
                                color: 'rgba(104,164,255,0.6)',
                            },
                            {
                                offset: 1,
                                color: 'rgba(104,164,255,1)',
                            },
                        ]),
                    },
                },
            },
            toolbox: {
                show: false,
            },
            data: obj.data.ydata,
        },
    );
    myCharts.setOption(obj.op);
}

const initChart = () => {
    myCharts = echarts.init(chartsRef.value);
    flushChart();
}

onMounted(() => {
    initChart();
})

const destroyChart = () => {
    if (!myCharts) {
        return;
    }
    myCharts.dispose();
    myCharts = null;
}

onBeforeMount(() => {
    destroyChart();
})
</script>

<style lang="scss" scoped>
.abnormal {
    position: relative;
    width: 100%;
    height: 276px;
    margin-top: 19px;
    display: inline-block;

    .per {
        font-size: 12px;
        color: rgba(255, 255, 255, 0.5);
        margin-bottom: 19px;
    }

    .chart {
        display: inline-block;
        width: 100%;
        height: 185px;
        zoom: 1;
    }
}
</style>