配置文件路径
/etc/grafana/grafana.ini
一、Grafana
安装
https://grafana.com/grafana/download?edition=oss&pg=get&plcmt=selfmanaged-box1-cta1
以centos为例
#安装
sudo yum install -y https://dl.grafana.com/oss/release/grafana-10.2.0-1.x86_64.rpm

#修改端口号
#/etc/grafana/grafana.ini 中找到http_port 默认端口为3000

#启动
sudo systemctl start grafana-server

#开机自启
sudo systemctl enable grafana-server

#访问
#http://localhost:3000
#默认用户密码admin/admin 可在配置文件 Security 节点下修改
仪表盘模板
https://grafana.com/grafana/dashboards/13919-microsoft-sql-server/
二、数据存储 influxdata
https://docs.influxdata.com/influxdb/v2/install/?t=Linux
安装完成后 访问localhost:8086 ,生成telegraf配置
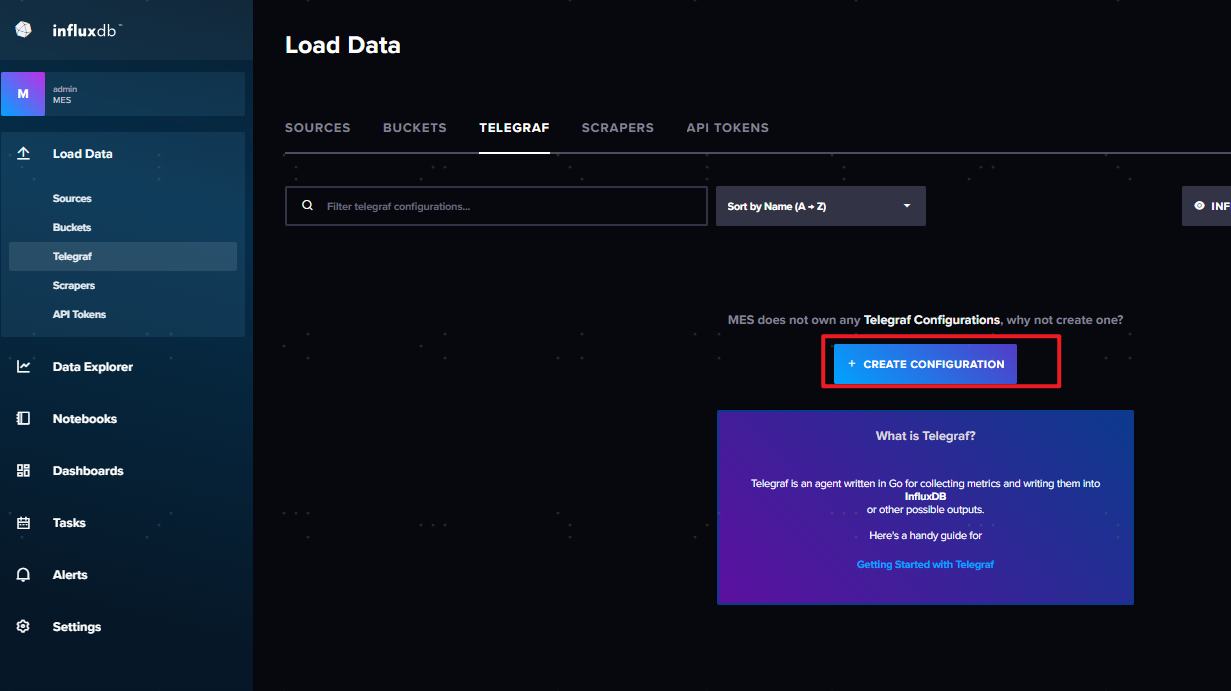
三、数据采集器 telegraf
https://www.influxdata.com/time-series-platform/telegraf/#
插件
https://githubfast.com/influxdata/telegraf/tree/master/plugins
配置输出
配置输出为 influxdb
###############################################################################
#                            OUTPUT PLUGINS                                   #
###############################################################################


# # Configuration for sending metrics to InfluxDB 2.0
  [[outputs.influxdb_v2]]
#   ## The URLs of the InfluxDB cluster nodes.
#   ##
#   ## Multiple URLs can be specified for a single cluster, only ONE of the
#   ## urls will be written to each interval.
#   ##   ex: urls = ["https://us-west-2-1.aws.cloud2.influxdata.com"]
    urls = ["http://127.0.0.1:8086"]
#
#   ## Token for authentication.
    token = ""
#
#   ## Organization is the name of the organization you wish to write to.
    organization = ""
#
#   ## Destination bucket to write into.
    bucket = ""
#
#   ## The value of this tag will be used to determine the bucket.  If this
#   ## tag is not set the 'bucket' option is used as the default.
#   # bucket_tag = ""