在之前的文章中,分享了很多Matlab气泡图的绘制模板:
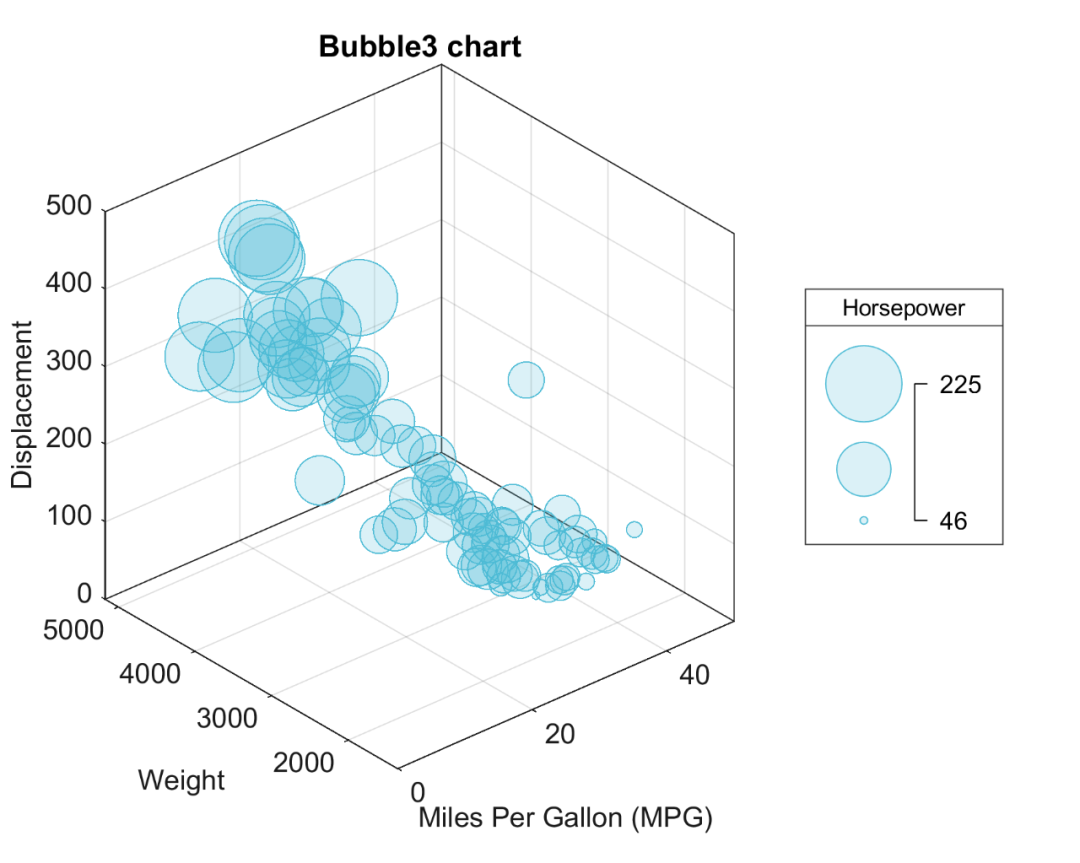
进一步,再来分享一下三维气泡图。
先来看一下成品效果:
特别提示:本期内容『数据+代码』已上传资源群中,加群的朋友请自行下载。有需要的朋友可以关注同名公号【阿昆的科研日常】,后台回复关键词【绘图桶】查看加入方式。
模板中最关键的部分内容:
1. 数据准备
此部分主要是读取原始数据。
% 读取数据load carsmall.mat
2. 颜色定义
作图不配色就好比做菜不放盐,总让人感觉少些味道。
但颜色搭配比较考验个人审美,需要多加尝试。
这里直接使用TheColor配色工具中的SCI权威配色库:
%% 颜色定义map = TheColor('sci',500);C = map(2,1:3);
3. 三维气泡图绘制
通过调用‘bubblechart3’命令,绘制初始三维气泡图。
b1 = bubblechart3(MPG,Weight,Displacement,Horsepower,...'MarkerFaceAlpha',0.2,...'MarkerEdgeColor',C,...'MarkerFaceColor',C);bubblesize([3 30])view(-41,30)hTitle = title('Bubble3 chart');hXLabel = xlabel('Miles Per Gallon (MPG)');hYLabel = ylabel('Weight');hZLabel = zlabel('Displacement');
4. 细节优化
为了插图的美观,对坐标轴细节等进行美化:
% 坐标区调整set(gca, 'Box', 'on', ... % 边框'XGrid', 'on', 'YGrid', 'on', 'ZGrid', 'on',... % 网格'TickDir', 'out', 'TickLength', [.01 .01], ... % 刻度'XColor', [.1 .1 .1], 'YColor', [.1 .1 .1],'ZColor', [.1 .1 .1]) % 坐标轴颜色set(gca, 'xlim',[0 50],...'zlim',[0 500])% legendblgd = bubblelegend('Horsepower');blgd.Location = 'eastoutside';bt = get(blgd,'Title');bt.FontWeight = 'normal';bt.FontName = 'Arial';bt.FontSize = 9;% 字体和字号set(gca, 'FontName', 'Arial', 'FontSize', 11)set([hXLabel,hYLabel,hZLabel], 'FontName', 'Arial', 'FontSize', 11)set(hTitle, 'FontSize', 12, 'FontWeight' , 'bold')% 背景颜色set(gcf,'Color',[1 1 1])
设置完毕后,以期刊所需分辨率、格式输出图片。
%% 图片输出figW = figureWidth;figH = figureHeight;set(figureHandle,'PaperUnits',figureUnits);set(figureHandle,'PaperPosition',[0 0 figW figH]);fileout = 'test';print(figureHandle,[fileout,'.png'],'-r300','-dpng');
以上。

![[架构之路-244]:目标系统 - 设计方法 - 软件工程 - 软件开发方法与软件开发模型](https://img-blog.csdnimg.cn/b79e10d096be430f8ecf74298095e95a.png)


![Java快速排序算法、三路快排(Java算法和数据结构总结笔记)[7/20]](https://img-blog.csdnimg.cn/8c4e8bd2f7f642858db799aabd4cd295.png)