import pandas as pd
import warnings
warnings. filterwarnings( "ignore" )
df = pd. read_csv( 'data/data.csv' ) . dropna( )
features = df. columns[ : - 1 ]
X, y = df[ features] , df[ 'label' ]
from sklearn. preprocessing import MinMaxScaler
scaler = MinMaxScaler( )
X = scaler. fit_transform( X)
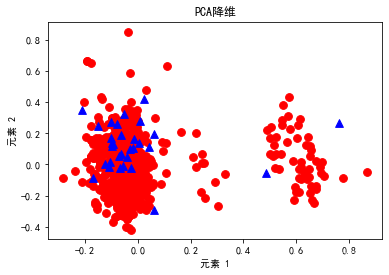
from sklearn. decomposition import PCA
pca = PCA( n_components= 2 )
X_pca = pca. fit_transform( X)
label = y
pos_mask = label == 0
neg_mask = label == 1
pos = X_pca[ pos_mask]
neg = X_pca[ neg_mask]
import matplotlib. pyplot as plt
plt. rcParams[ "font.sans-serif" ] = [ "SimHei" ]
plt. rcParams[ "axes.unicode_minus" ] = False
plt. scatter( pos[ : , 0 ] , pos[ : , 1 ] , s= 60 , marker= 'o' , c= 'r' )
plt. scatter( neg[ : , 0 ] , neg[ : , 1 ] , s= 60 , marker= '^' , c= 'b' )
plt. title( u'PCA降维' )
plt. xlabel( u'元素 1' )
plt. ylabel( u'元素 2' )
plt. show( )
import pandas as pd
import warnings
warnings. filterwarnings( "ignore" )
df = pd. read_csv( 'data/data.csv' ) . dropna( )
features = df. columns[ : - 1 ]
X, y = df[ features] , df[ 'label' ]
from sklearn. preprocessing import MinMaxScaler
scaler = MinMaxScaler( )
X = scaler. fit_transform( X)
from sklearn. decomposition import PCA
import matplotlib. pyplot as plt
plt. rcParams[ "font.sans-serif" ] = [ "SimHei" ]
plt. rcParams[ "axes.unicode_minus" ] = False
from mpl_toolkits. mplot3d import Axes3D
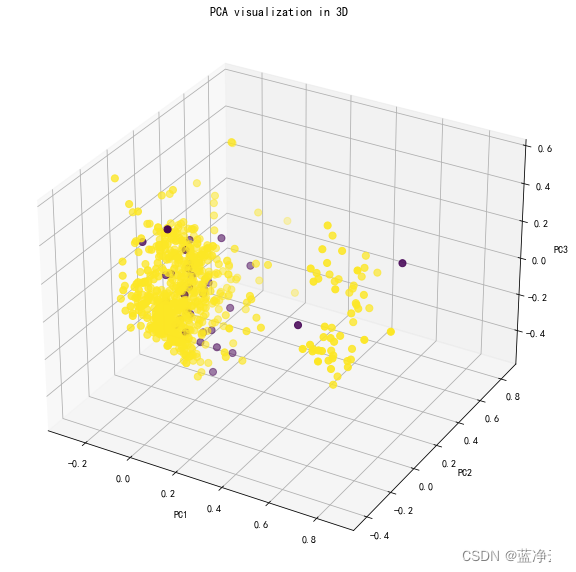
pca = PCA( n_components= 3 )
pca. fit( X)
X_pca = pca. transform( X)
fig = plt. figure( )
ax = fig. add_subplot( 111 , projection= '3d' )
fig. set_size_inches( 10 , 10 )
ax. scatter( X_pca[ : , 0 ] , X_pca[ : , 1 ] , X_pca[ : , 2 ] , c= - y, cmap= 'viridis' , s= 50 )
ax. set_xlabel( 'PC1' )
ax. set_ylabel( 'PC2' )
ax. set_zlabel( 'PC3' )
ax. set_title( 'PCA visualization in 3D' )
plt. show( )