const weatherIcons = [
{
lable: ‘寿险’,
id: 2,
img: require(@/assets/images/customerModule/title-action.png)
},
{
lable: ‘重疾’,
id: 3,
img: require(@/assets/images/customerModule/title-action.png)
},
{
lable: ‘医疗’,
id: 4,
img: require(@/assets/images/customerModule/title-action.png)
},
{
lable: ‘年金’,
id: 5,
img: require(@/assets/images/customerModule/title-action.png)
},
{
lable: ‘意外’,
id: 6,
img: require(@/assets/images/customerModule/title-action.png)
}
]
let chartData = [10,10,0,0,0]
option = {
grid: {
top: 20,
right: 0,
left: 0,
bottom: 50
},
xAxis: [
{
type: ‘category’,
data: [‘1’, ‘2’, ‘3’, ‘4’, ‘5’],
axisTick: {
show: false
},
axisLine: {
show: true,
lineStyle: {
color: ‘#F2F2F2’
}
},
axisLabel: {
show: true,
fontSize: 13,
lineHeight: 20,
color: ‘#999’,
formatter: function(value) {
return ‘{’ + value + ‘| }’ + ‘\n’ + weatherIcons[value - 1].lable
},
rich: {
1: {
width: 17,
height: 17,
backgroundColor: {
image: weatherIcons[0].img
}
},
2: {
width: 17,
height: 17,
backgroundColor: {
image: weatherIcons[1].img
}
},
3: {
width: 17,
height: 17,
backgroundColor: {
image: weatherIcons[2].img
}
},
4: {
width: 17,
height: 17,
backgroundColor: {
image: weatherIcons[3].img
}
},
5: {
width: 17,
height: 17,
backgroundColor: {
image: weatherIcons[4].img
}
}
}
}
}
],
yAxis: [
{
show: false
}
],
series: [
{
name: ‘Placeholder’, // 控制柱子距离X轴有点距离
type: ‘bar’,
stack: ‘Total’,
itemStyle: {
borderColor: ‘transparent’,
color: ‘transparent’
},
emphasis: {
itemStyle: {
borderColor: ‘transparent’,
color: ‘transparent’
}
},
data: [max0.04,max0.04,max0.04,max0.04,max*0.04] // 此处自己配置 我这是需要高出 chartData 最大值的0.04就行
},
      {
        // 真实数据
        data: chartData,
        name: '顶部圆片 (柱形图顶部)',
        //symbol标记类型包括 'circle', 'rect', 'roundRect', 'triangle', 'diamond','pin','arrow', 'none' (默认为圆形)
        type: 'pictorialBar', //指定类型
        symbolSize: [29, 6], //指定大小,[宽,高]
        symbolOffset: [0, -8], //位置偏移 [右,下] 负数反方向
        z: 18, // 层级(优先级展示)
        itemStyle: {
          normal: {
            //柱体的颜色
            //右,下,左,上(1,0,0,0)表示从正右开始向左渐变
            color: function(params) {
              var colorList = [
                ['#7BB0FF', '#4488FF'],
                ['#FB7C8C', '#F44E62'],
                ['#AD95FF', '#8762FD'],
                ['#58DCFF', '#18C1EE'],
                ['#FFD56E', '#FF9B33']
              ]
              var colorItem = colorList[params.dataIndex]
              return new echarts.graphic.LinearGradient(
                0,
                0,
                0,
                1,
                [
                  {
                    offset: 0,
                    color: colorItem[0]
                  },
                  {
                    offset: 1,
                    color: colorItem[1]
                  }
                ],
                false
              )
            }
          }
        },
        symbolPosition: 'end'
      },
      {
        name: '底部圆片(柱形图底部)',
        type: 'pictorialBar',
        symbolSize: [29, 6],
        symbolOffset: [0, -2],
        z: 18,
        itemStyle: {
          normal: {
            //柱体的颜色
            //右,下,左,上(1,0,0,0)表示从正右开始向左渐变
            color: function(params) {
              var colorList = ['#2370EC', '#F04156', '#6B3BFD', '#21C1EC', '#EB7313']
              var colorItem = colorList[params.dataIndex]
              return colorItem
            }
          }
        },
        // 真实数据
        data: chartData
      },
      {
        name: '真实数据柱形图',
        type: 'bar',
        stack: 'Total',
        label: {
          show: true,
          position: 'top'
        },
        itemStyle: {
          normal: {
            //柱体的颜色
            //右,下,左,上(1,0,0,0)表示从正右开始向左渐变
            color: function(params) {
              console.log(params)
              var colorList = [
                ['#93C2FF', '#2E78FF'],
                ['#FF99A5', '#F44E62'],
                ['#C6B7FF', '#7144FD'],
                ['#95E9FF', '#18C1EE'],
                ['#FFE881', '#FF6C03']
              ]
              var colorItem = colorList[params.dataIndex]
              return new echarts.graphic.LinearGradient(
                0,
                0,
                0,
                1,
                [
                  {
                    offset: 0,
                    color: colorItem[0]
                  },
                  {
                    offset: 1,
                    color: colorItem[1]
                  }
                ],
                false
              )
            }
          }
        },
        z: 16,
        silent: true,
        barWidth: 29,
        // barGap: '10%',
        showBackground: true,
        backgroundStyle: {
          color: '#f8f8f8'
        },
        // 真实数据
        data: chartData
      }
    ]
  }
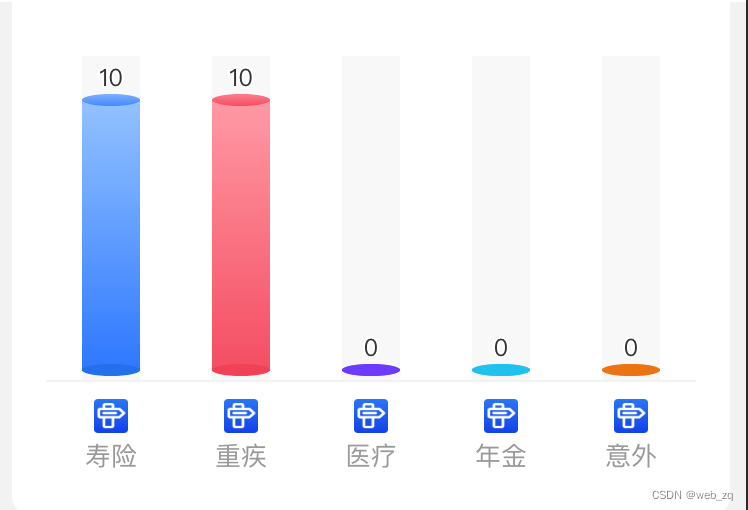
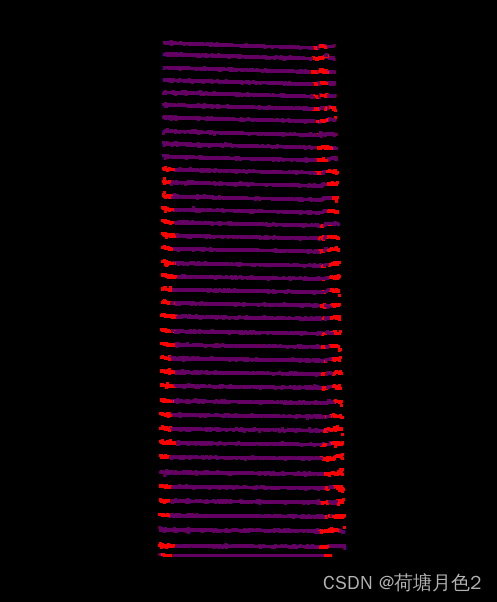
实现效果图