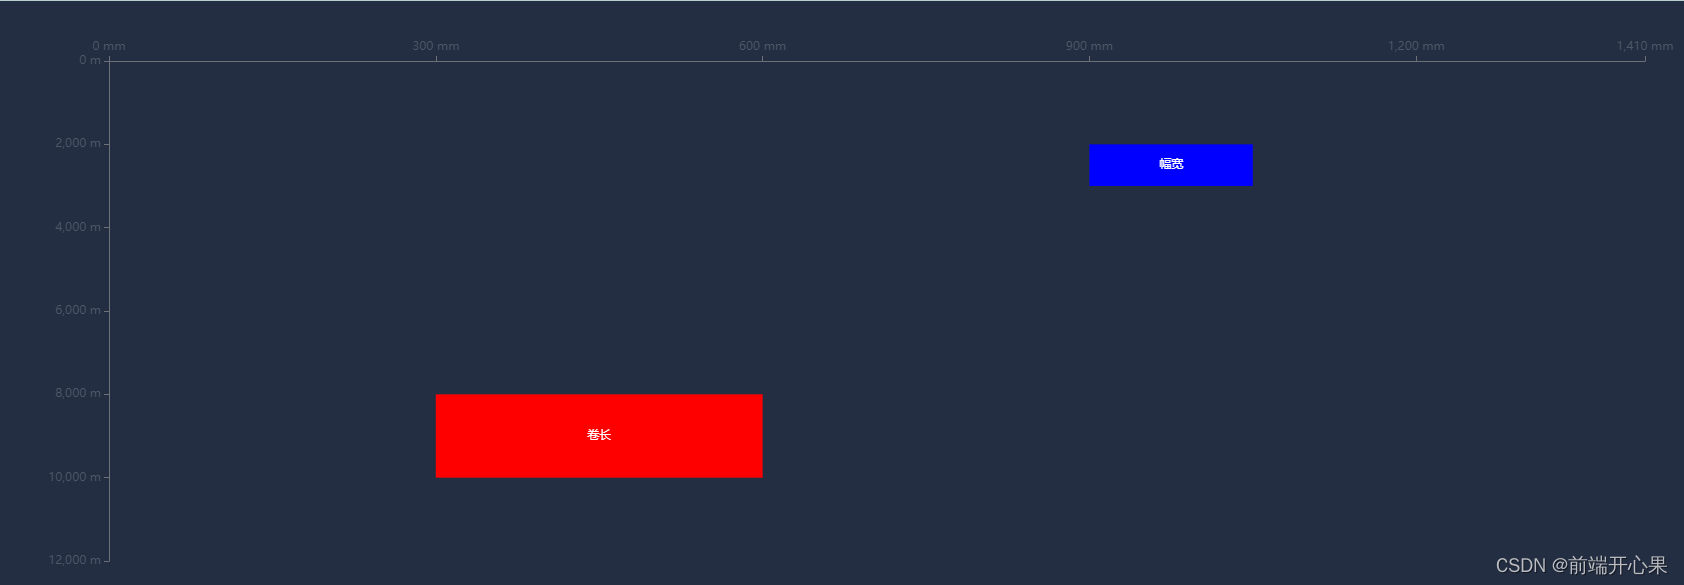
echarts中根据坐标点和点的宽高绘制不同大小的矩形
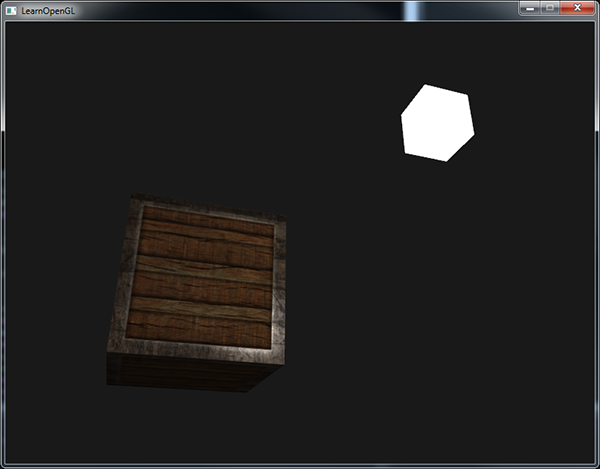
效果图
<template>
  <div style="height: 100%; width: 100%">
    <BaseChart @emitChart="emitChart" :option="option1" />
  </div>
</template>

<script>
export default {
  data() {
    return {
      echarts: null,
      option1: {},
    };
  },
  mounted() {
    this.setOption1();
  },
  methods: {
    setOption1() {
      const rectangles = [
        {
          x: 300,
          y: 8000,
          width: 300,
          height: 2000,
          name: "卷长",
          itemStyle: {
            borderColor: "red",
            normal: {
              color: "red",
            },
          },
        },
        {
          x: 900,
          y: 2000,
          width: 150,
          height: 1000,
          name: "幅宽",
          itemStyle: {
            borderColor: "green",
            normal: {
              color: "blue",
            },
          },
        },
        // 可以添加更多的矩形...
      ];
      let data = rectangles.map((i) => {
        // 数组里面的值分别代表维度0, 1, 2, 3
        return {
          value: [i.x, i.y, i.width, i.height],
          name: i.name,
          itemStyle: i.itemStyle,
        };
        // 数组里面的值分别代表维度0, 1, 2, 3,这种数据结构没有针对样式颜色
        // return [i.x, i.y, i.width, i.height];
      });

      const option = {
        grid: {
          height: 500,
          // left: "2%",
          // right: "2%",
          // bottom: "2%",
          // containLabel: true,
        },
        xAxis: [
          {
            splitLine: {
              show: false,
            },
            position: "top",
            min: 0,
            max: 1410,
            axisLabel: {
              show: true,
              formatter: "{value} mm",
              textStyle: {
                color: "#4E5969",
              },
            },
          },
        ],
        yAxis: [
          {
            splitLine: {
              show: false,
            },
            inverse: true,
            min: 0,
            max: 12000,
            axisLabel: {
              show: true,
              formatter: "{value} m",
              textStyle: {
                color: "#4E5969",
              },
            },
          },
        ],
        tooltip: {
          formatter: function (params) {
            return (
              params.marker +
              params.name +
              ": " +
              params.value[0] +
              "~" +
              params.value[1] +
              "<br/>" +
              params.marker +
              `name:${params.data.name}`
            );
          },
        },
        series: [
          {
            type: "custom",
            coordinateSystem: "cartesian2d",
            renderItem: (params, api) => {
              // api.coord()将数据组映射到坐标系上,api.value(n),获取第n维度的值
              let start = api.coord([api.value(0), api.value(1)]);
              // api.size()给定数据范围,映射到坐标系上后的像素长度。比如api.size([1, 1])和坐标轴的刻度一样,长度都是1
              // 如果矩形超出了当前坐标系的包围盒,则剪裁这个矩形。
              let rectShape = this.$echarts.graphic.clipRectByRect(
                {
                  x: start[0],
                  y: start[1],
                  width: api.size([1, 1])[0] * api.value(2),
                  height: api.size([1, 1])[1] * api.value(3),
                },
                {
                  x: params.coordSys.x,
                  y: params.coordSys.y,
                  width: params.coordSys.width,
                  height: params.coordSys.height,
                }
              );
              return (
                rectShape && {
                  type: "rect", // 矩形,还可以circle等
                  shape: rectShape,
                  style: api.style({
                    text: `${data[params.dataIndex].name}`, // 文字内容
                  }),
                }
              );
            },
            itemStyle: {
              normal: {
                opacity: 1,
              },
            },
            encode: {
              x: [0, 2], // data 中『维度0』和『维度2』对应到 X 轴
              y: 1, // data 中『维度1』对应到 Y 轴
            },
            data, // data是一个二维数组
          },
        ],
      };

      this.option1 = option;
    },
    emitChart(echarts) {
      this.echarts = echarts;
    },
  },
};
</script>


![[watevrCTF-2019]Cookie Store](https://img-blog.csdnimg.cn/287bf3066daf400b861ee5d068ad25d8.png)