Python函数绘图与高等代数互融实例(一):正弦函数与余弦函数
Python函数绘图与高等代数互融实例(二):闪点函数
Python函数绘图与高等代数互融实例(三):设置X|Y轴|网格线
Python函数绘图与高等代数互融实例(四):设置X|Y轴参考线|参考区域
Python函数绘图与高等代数互融实例(五): 则线图综合案例
Python函数绘图与高等代数互融实例(六): 条形图|直方图|饼状图
Python函数绘图与高等代数互融实例(七): 极限图|散点气泡图
Python函数绘图与高等代数互融实例(八):箱线图|误差棒图
一:极限图绘制
# -*- coding: utf-8 -*-
import matplotlib as mpl
import matplotlib.pyplot as plt
import numpy as np

'''
  函数功能:在坐标轴上绘制极限图
  调用签名:plt.polar(theta)
  参数说明:
     theta:每个标记所在射线与极限的夹角
     r:每个标记到原点的距离
'''

# 设置中文显示字体
mpl.rcParams["font.sans-serif"] = ["SimHei"]

# 设置正常显示符号
mpl.rcParams["axes.unicode_minus"] = False
#  五角星的个数
barSlices = 26

theta = np.linspace(0.0, 2 * np.pi, barSlices, endpoint=False)

r = 30 * np.random.rand(barSlices)

plt.polar(theta, r,
          color="chartreuse",
          linewidth=1,
          marker="*",
          mfc="b",
          ms=20)  # ms=20 五角星的大小

plt.title("极限图绘制实例")

plt.show()
二:极限图绘制运行效果

三: 气泡图绘制
# -*- coding: utf-8 -*-
import matplotlib as mpl
import matplotlib.pyplot as plt
import numpy as np
'''
函数功能: 二维数据借助气泡大小展示三维数据
调用签名: plt.scatter(x, y)
参数说明:
x:x轴上的数据
y:y轴上的数据
s:散点标记的大小
c:散点标记的颜色
cmap:将浮点数映射成颜色的颜色映射表
'''
# 设置中文显示字体
mpl.rcParams["font.sans-serif"] = ["SimHei"]
# 设置正常显示符号
mpl.rcParams["axes.unicode_minus"] = False
# 随机种子密度
a = np.random.randn(200)
# 随机种子密度
b = np.random.randn(200)
plt.scatter(a, b, s=np.power(10 * a + 20 * b, 2),
c=np.random.rand(200),
cmap='twilight_shifted', # twilight_shifted
marker="o") # marker="o" 气泡的形状
'''
cmap 支持下面的值,不同值有不同效果
'Accent', 'Accent_r', 'Blues', 'Blues_r', 'BrBG', 'BrBG_r', 'BuGn', 'BuGn_r',
'BuPu', 'BuPu_r', 'CMRmap', 'CMRmap_r', 'Dark2', 'Dark2_r', 'GnBu', 'GnBu_r',
'Greens', 'Greens_r', 'Greys', 'Greys_r', 'OrRd', 'OrRd_r', 'Oranges',
'Oranges_r', 'PRGn', 'PRGn_r', 'Paired', 'Paired_r', 'Pastel1', 'Pastel1_r',
'Pastel2', 'Pastel2_r', 'PiYG', 'PiYG_r', 'PuBu', 'PuBuGn', 'PuBuGn_r',
'PuBu_r', 'PuOr', 'PuOr_r', 'PuRd', 'PuRd_r', 'Purples', 'Purples_r', 'RdBu', 'RdBu_r',
'RdGy', 'RdGy_r', 'RdPu', 'RdPu_r', 'RdYlBu', 'RdYlBu_r', 'RdYlGn', 'RdYlGn_r', 'Reds',
'Reds_r', 'Set1', 'Set1_r', 'Set2', 'Set2_r', 'Set3', 'Set3_r', 'Spectral', 'Spectral_r', 'Wistia',
'Wistia_r', 'YlGn', 'YlGnBu', 'YlGnBu_r', 'YlGn_r', 'YlOrBr', 'YlOrBr_r', 'YlOrRd', 'YlOrRd_r', 'afmhot', 'afmhot_r',
'autumn', 'autumn_r', 'binary', 'binary_r', 'bone', 'bone_r', 'brg', 'brg_r', 'bwr', 'bwr_r', 'cividis',
'cividis_r', 'cool', 'cool_r', 'coolwarm', 'coolwarm_r', 'copper', 'copper_r', 'cubehelix', 'cubehelix_r',
'flag', 'flag_r', 'gist_earth', 'gist_earth_r', 'gist_gray', 'gist_gray_r', 'gist_heat', 'gist_heat_r', 'gist_ncar',
'gist_ncar_r', 'gist_rainbow', 'gist_rainbow_r', 'gist_stern', 'gist_stern_r', 'gist_yarg', 'gist_yarg_r',
'gnuplot', 'gnuplot2', 'gnuplot2_r', 'gnuplot_r', 'gray', 'gray_r', 'hot', 'hot_r', 'hsv', 'hsv_r', 'inferno',
'inferno_r', 'jet', 'jet_r', 'magma', 'magma_r', 'nipy_spectral', 'nipy_spectral_r', 'ocean', 'ocean_r',
'pink', 'pink_r', 'plasma', 'plasma_r', 'prism', 'prism_r', 'rainbow', 'rainbow_r', 'seismic', 'seismic_r',
'spring', 'spring_r', 'summer', 'summer_r', 'tab10', 'tab10_r', 'tab20', 'tab20_r', 'tab20b', 'tab20b_r',
'tab20c', 'tab20c_r', 'terrain',
'terrain_r', 'turbo', 'turbo_r', 'twilight', 'twilight_r', 'twilight_shifted',
'twilight_shifted_r', 'viridis', 'viridis_r', 'winter', 'winter_r'
'''
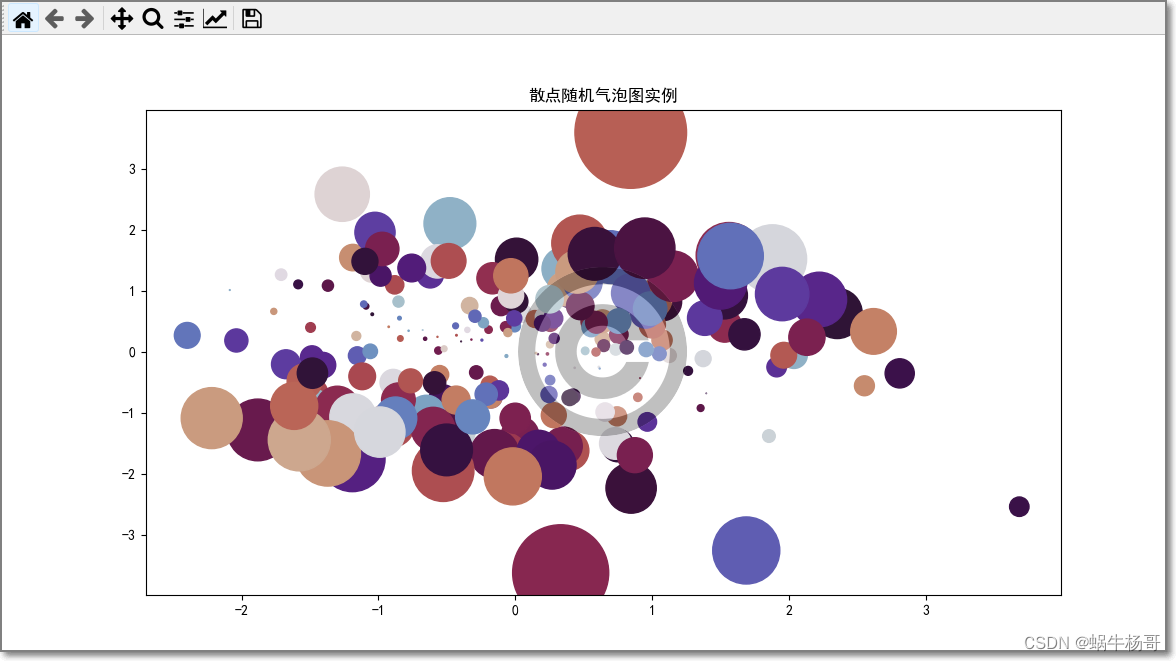
plt.title("散点随机气泡图实例")
plt.show()
四: 气泡图绘制运行效果
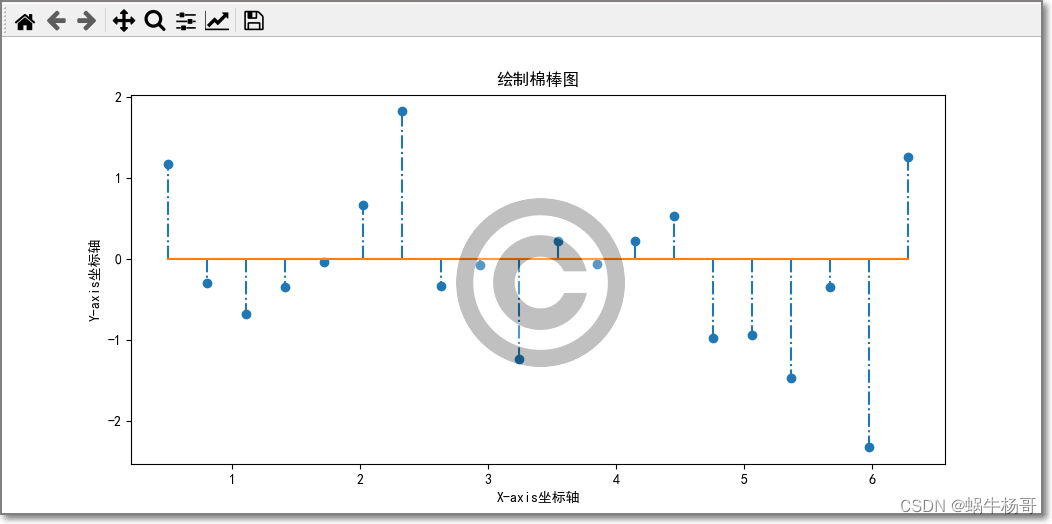
五: 棉棒图绘制
# -*- coding: utf-8 -*-
import matplotlib as mpl
import matplotlib.pyplot as plt
import numpy as np

'''
  函数功能: 绘制离散有序数据
  调用签名: plt.stem(x, y)
  参数说明:
     x:指定棉棒的x轴基线上的位置
     y:绘制棉棒的长度
     linefmt: 棉棒的样式
     markerfmt: 棉棒末端的样式
     basefmt:指定基线的样式
'''
# 设置中文显示字体
mpl.rcParams["font.sans-serif"] = ["SimHei"]

# 设置正常显示符号
mpl.rcParams["axes.unicode_minus"] = False

x = np.linspace(0.5, 2 * np.pi, 20)
y = np.random.randn(20)

plt.stem(x, y, linefmt="-.", markerfmt="o", basefmt="-")

plt.title("绘制棉棒图")

plt.xlabel("X-axis坐标轴")

plt.ylabel("Y-axis坐标轴")

plt.show()
六: 棉棒图绘制运行效果