SpringBoot配置Prometheus
- pom.xml 引入监控以及prometheus依赖
	 <dependency>
            <groupId>io.micrometer</groupId>
            <artifactId>micrometer-registry-prometheus</artifactId>
        </dependency>

        <dependency>
            <groupId>org.springframework.boot</groupId>
            <artifactId>spring-boot-starter-actuator</artifactId>
        </dependency>
- 自定义指标
引入上面两个依赖之后,SpringBoot的/actuator/prometheus路径会默认暴露一些指标。
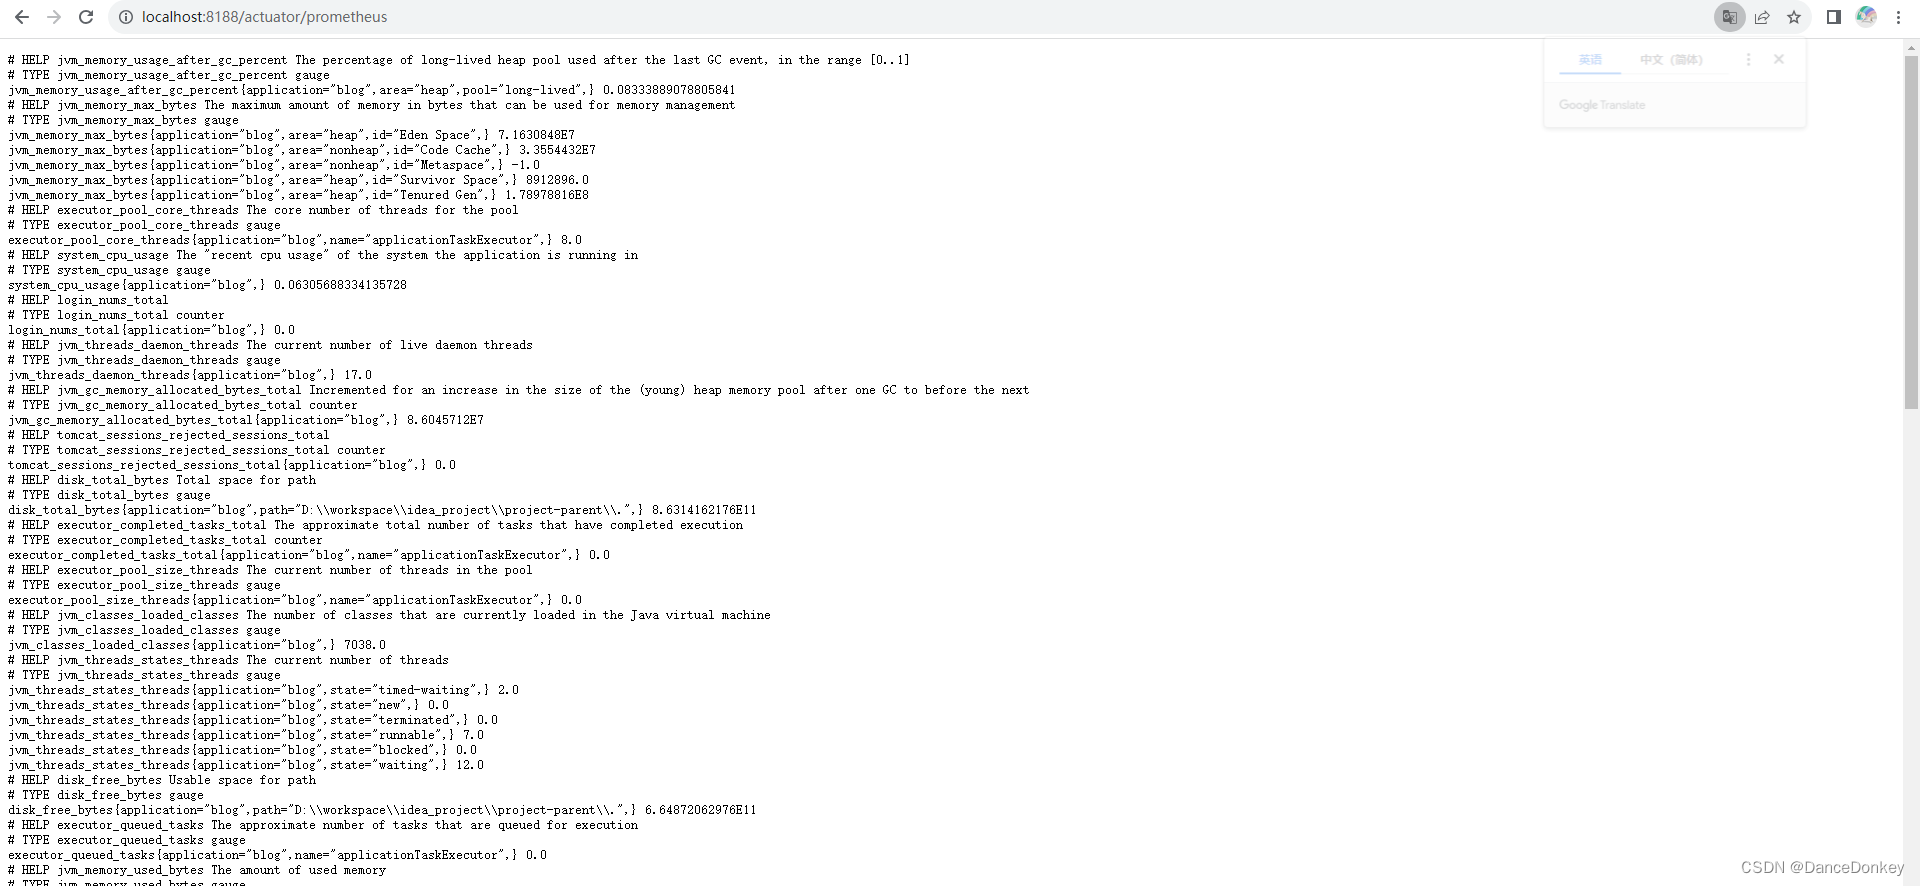
prometheus通过Http协议拉取的指标数据格式为
指标名 {标签} 值
如 jvm_memory_max_bytes{application=“blog”,area=“heap”,id=“Eden Space”,} 7.1630848E7
这个指标的指标名是jvm_memory_max_bytes,标签是 {application=“blog”,area=“heap”,id=“Eden Space”,},而指标值是 7.1630848E7,将来使用PromQL查询时,标签可以起到筛选条件的作用。
除了引入依赖所提供的指标外,还可以自定义指标。
@SuppressWarnings("all")
@Component
public class MetricsCounter {

    private static Counter loginCounter = null;
    private static Counter registerCounter = null;

    private static AtomicInteger atomicInteger;

    public MetricsCounter(MeterRegistry registry) {
        loginCounter = registry.counter("login_nums");
        registerCounter = registry.counter("register_nums");
        atomicInteger = registry.gauge("ssl_expire_days", new AtomicInteger(10));
    }

    /**
     * 此方法可能会被多线程执行,需要考虑线程安全问题
     */
    public synchronized static void incrLogin() {
        loginCounter.increment();
    }

    public synchronized static void incrRegister() {
        registerCounter.increment();
    }

    public static void updateSslExpireDays(){
        atomicInteger.set(new Random().nextInt(100));
    }

}
通过拿到MeterRegistry 自定义指标,这里定义了两种类型的指标,一种是Counter 计数器,值只增不减,一种是gauge,gauge类型可以随意修改。
- 编写一个接口,改变指标
@RestController
public class TestRest {

    @GetMapping("t1")
    public String t1(){
        MetricsCounter.incrLogin();
        MetricsCounter.incrRegister();
        MetricsCounter.updateSslExpireDays();
        return "t1";
    }

}
- 访问路径
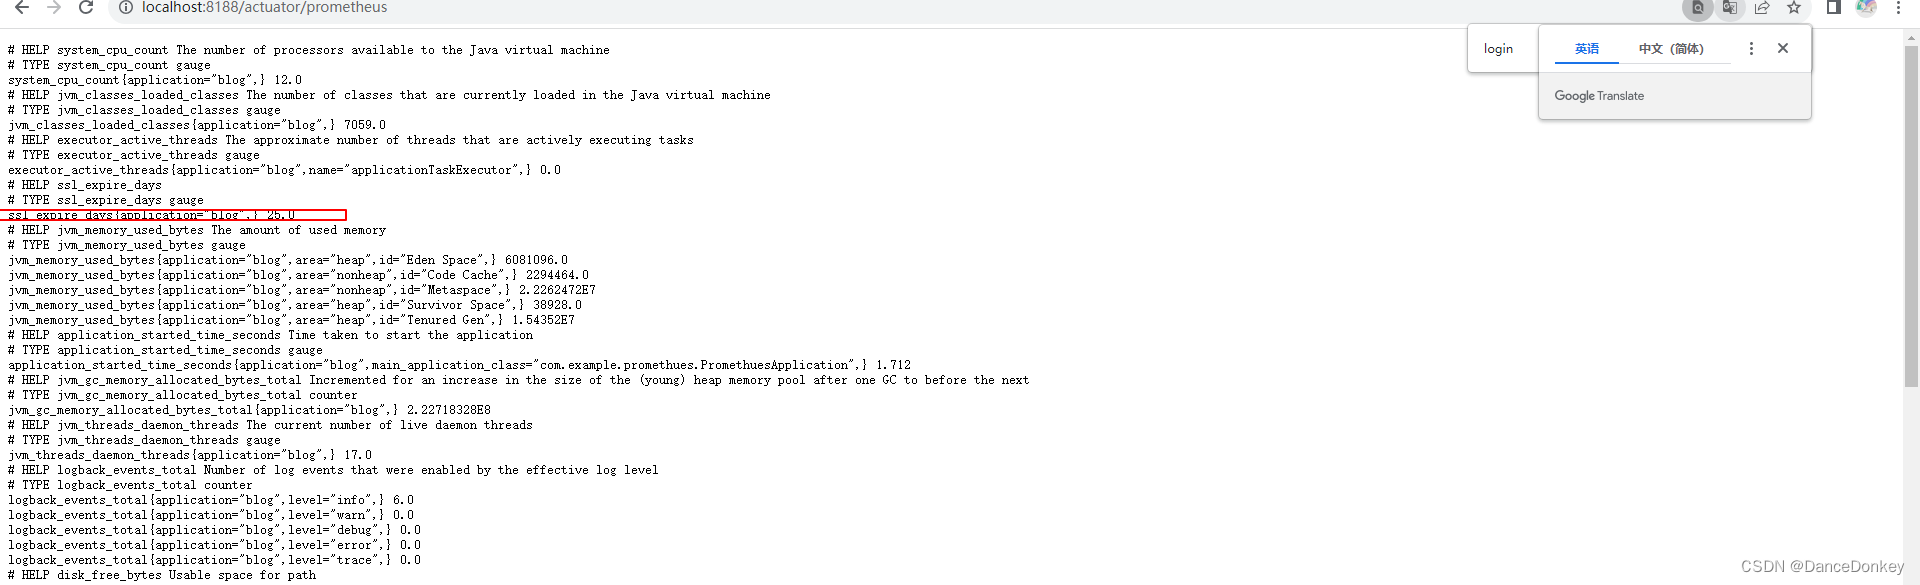
可以看到最新的指标值。
二 、 Prometheus 端配置
SpringBoot将指标暴露出去后,还需要配置Prometheus 的配置文件,让Prometheus 定时去访问路径拉取到指标。
# my global config
global:
  scrape_interval: 15s # Set the scrape interval to every 15 seconds. Default is every 1 minute.
  evaluation_interval: 15s # Evaluate rules every 15 seconds. The default is every 1 minute.
  # scrape_timeout is set to the global default (10s).

# Alertmanager configuration
alerting:
  alertmanagers:
    - static_configs:
        - targets:
          # - alertmanager:9093

# Load rules once and periodically evaluate them according to the global 'evaluation_interval'.
rule_files:
  # - "first_rules.yml"
  # - "second_rules.yml"

# A scrape configuration containing exactly one endpoint to scrape:
# Here it's Prometheus itself.
scrape_configs:
  # The job name is added as a label `job=<job_name>` to any timeseries scraped from this config.
  - job_name: "nodeExporter"

    # metrics_path defaults to '/metrics'
    # scheme defaults to 'http'.

    static_configs:
      - targets: ["192.168.240.130:9100"] #监控自己主机上的端口
  - job_name: "springboot"
    scrape_interval: 3s                                                # 多久采集一次数据
    scrape_timeout: 3s                                                 # 采集时的超时时间
    metrics_path: '/actuator/prometheus'                # 采集的路径
    static_configs:                                     # 采集服务的地址,设置成Springboot应用所在服务器的具体地址
      - targets: ["192.168.1.103:8188"]
alerting : 配置告警管理器地址
rule_files : 配置告警 规则
scrape_configs : 配置指标抓取规则,在这个配置项下配置SpringBoot的指标路径。
- 启动promteus
nohup ./prometheus --config.file=./prometheus.yml &
启动后的端口默认是 9090
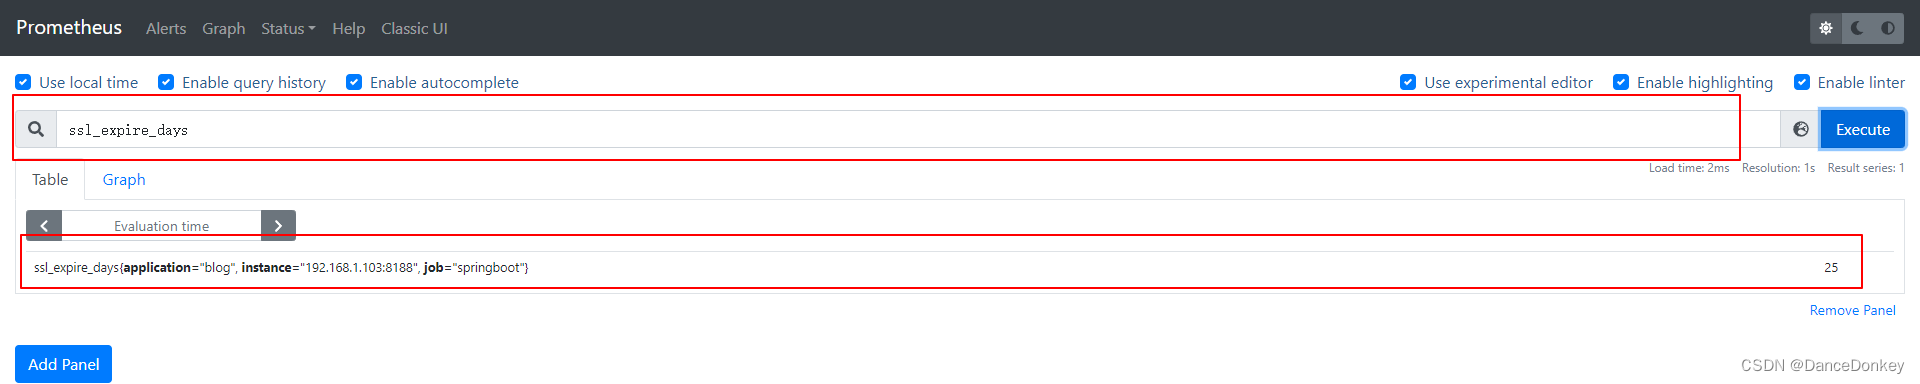
可以在上述的input输入框中输入PromQL进行对指标的查询。
具体的算术运算符、关系运算符以及内置函数等 可参考 Prometheus官网。
到此SpringBoot已完成与Prometheus的整合。