-
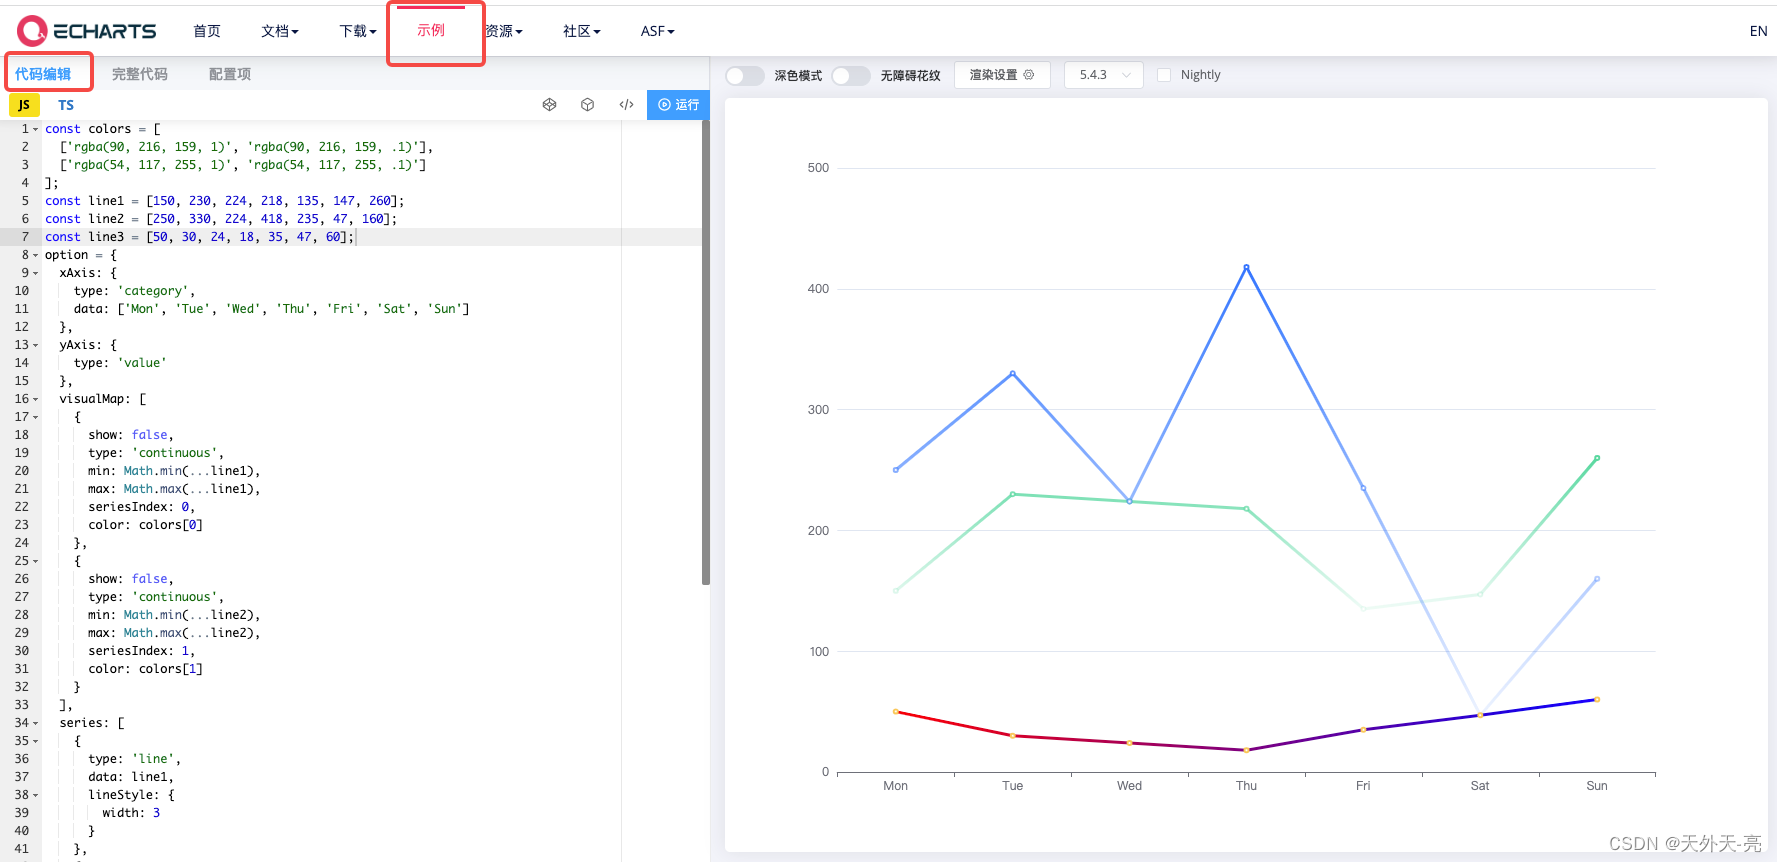
有时候布局太小,使用echarts,x轴y轴文字容易被遮挡,怎么解决这个问题呢,或者是未能铺满整个容器。

方法1: 直接设置 containLabel 字段
options: {
grid: {
containLabel:true,
},}
方法2: 间接设置,但是不那么准确,自适应的页面会有问题
options: {
grid: {
left:'1%',
right:'1%',
bottom:'10%',
},}
方法3:同时调整4个方向 grid{} 与显示数值label同时配置 containLabel
<template>
 <view class="seven">
      <view class="chart-title">趋势</view>
      <view class="charts-box" v-if="chart">
        <qiun-data-charts
            type="column"
            :eopts="eopts"
            :chartData="chartData"
            :echartsH5="true"
            padding="0"
            margin="0"/>
      </view>
    </view>
</template>
//...

eopts:{
 grid: {
              top: '8%',
              left: '-10%',
              right: '0%',
              bottom: '5%',
              containLabel: true
            },
}
问题二:当前数据值比较多位时,也会导致图表偏移。
解决:
此问题解法:
方法5:与方法4结合,再动态调整。
grid{}, containLabel ,再加动态判断数值label长度,动态调整。判断是左的数据长度了微调left的位置。增加watch观察api请求回来的数据,然后判断最左右数据值长度是多少?
todayCount(newValue) {
console.log(">>|------------- todayCount", this.todayCount.money7)
if (this.todayCount.money7) {
let len = this.todayCount.money7[1].toString().length
console.log(`-[${this.todayCount.money7[1].toString()}]`, len)// 1
if (len < 2) {
this.eopts.grid.left = '-10%'
} else if (len >= 2 && len <= 5) {
this.eopts.grid.left = '-10%'
} else {
this.eopts.grid.left = '-13%'
}
console.log(">>|-----------eopts", this.todayCount.money7, this.eopts.grid)
}
}
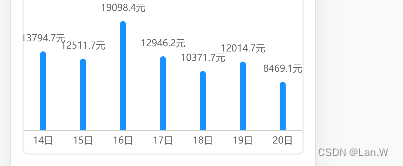
}运行效果
数值为0:

数值长度为5位以上


![nginx 报错[emerg]: unknown directive “锘? in E:\nginx-1.18.0/conf/nginx.conf:3](https://img-blog.csdnimg.cn/b5c6cbba5b6b41729990c58aa77c56d5.png)