直接调用这个类即可,需要下载个GnuPlot安装下。
// Author: Leonardo Tazzini

using System;
using System.Diagnostics;
using System.Drawing;
using System.IO;
using System.Windows.Forms;

/// <summary>
/// Tested with Gnuplot 5.2
/// </summary>
public class GnuPlot
{
    public GnuPlot()
    {
        // Default path for gnuplot
        this.Path = System.IO.Path.Combine(Environment.GetFolderPath(Environment.SpecialFolder.ProgramFiles), "gnuplot\\bin\\gnuplot.exe");
        // TODO: Check if path is valid
    }

    public GnuPlot(string path)
    {
        this.Path = path;
    }

    /// <summary>
    /// Path of gnuplot.exe
    /// </summary>
    public string Path { get; set; }

    /// <summary>
    /// Graph input CSV with GnuPlot. NumWaves is the number of channels to draw. If imageOut a PNG image is saved into out.png and displayed.
    /// </summary>
    public void DrawGraph(string csvFileName, int numWaves, bool generatePngImage = true)
    {
        // gnuplot.exe not found
        if(!File.Exists(Path))
        {
            MessageBox.Show("gnuplot.exe not found. Please check the path.");
            return;
        }

        var gnuPlot = new Process();
        gnuPlot.StartInfo.FileName = Path;
        gnuPlot.StartInfo.CreateNoWindow = true;
        gnuPlot.StartInfo.UseShellExecute = false;
        gnuPlot.StartInfo.RedirectStandardInput = true;
        gnuPlot.Start();

        StreamWriter gnuPlotSw = gnuPlot.StandardInput;
        if (generatePngImage)
        {
            // TODO: Remove dependency from Windows Forms
            Rectangle bounds = Screen.PrimaryScreen.WorkingArea;
            gnuPlotSw.WriteLine("set terminal png size " + (bounds.Width * 0.9) + "," + (bounds.Height * 0.8));
            gnuPlotSw.WriteLine("set out 'out.png'");
        }
        gnuPlotSw.WriteLine("set style data lines");      //linespoints
        gnuPlotSw.WriteLine("set datafile separator ';'");
        //gnuPlotSw.WriteLine("set decimalsign locale; set decimalsign ','");
        gnuPlotSw.WriteLine("set xlabel 'time  (s)'");
        gnuPlotSw.WriteLine("set ylabel 'value (v)'");
        gnuPlotSw.WriteLine("set grid");
        //gnuPlotSw.WriteLine("set xtics 0,0.5");
        //gnuPlotSw.WriteLine("set ytics 0,5");

        // TODO: evaluate add "every .." to gnuplot cmd line
        gnuPlotSw.Write("plot '" + System.IO.Path.GetFullPath(csvFileName) + "' using 1:2 title 'CH1'");
        if (numWaves == 2)
            gnuPlotSw.WriteLine(", '' using 1:3 title 'CH2'");
        else
            gnuPlotSw.Write("\n");
        gnuPlotSw.Flush();
        if (generatePngImage)
        {
            gnuPlotSw.WriteLine("exit");
            gnuPlotSw.Flush();
            gnuPlot.WaitForExit();
            Process.Start("out.png");
        }
        gnuPlot.Close();
    }


}
读吧数据存为csv,传入DrawGraph即可;数据如下:
TIME(s);CH1(v);
-600.99999949;1.5001;
-599.99999949;-0.0598999999999998;
-598.99999949;-0.0398999999999998;
-597.99999949;-0.0398999999999998;
-596.99999949;-0.0398999999999998;
-595.99999949;-0.0398999999999998;
-594.99999949;-0.0398999999999998;
-593.99999949;-0.0398999999999998;
-592.99999949;-0.0598999999999998;
-591.99999949;-0.0398999999999998;
-590.99999949;-0.0398999999999998;
-589.99999949;-0.0598999999999998;
-588.99999949;-0.0398999999999998;
-587.99999949;-0.0398999999999998;
-586.99999949;-0.0398999999999998;
-585.99999949;-0.0598999999999998;
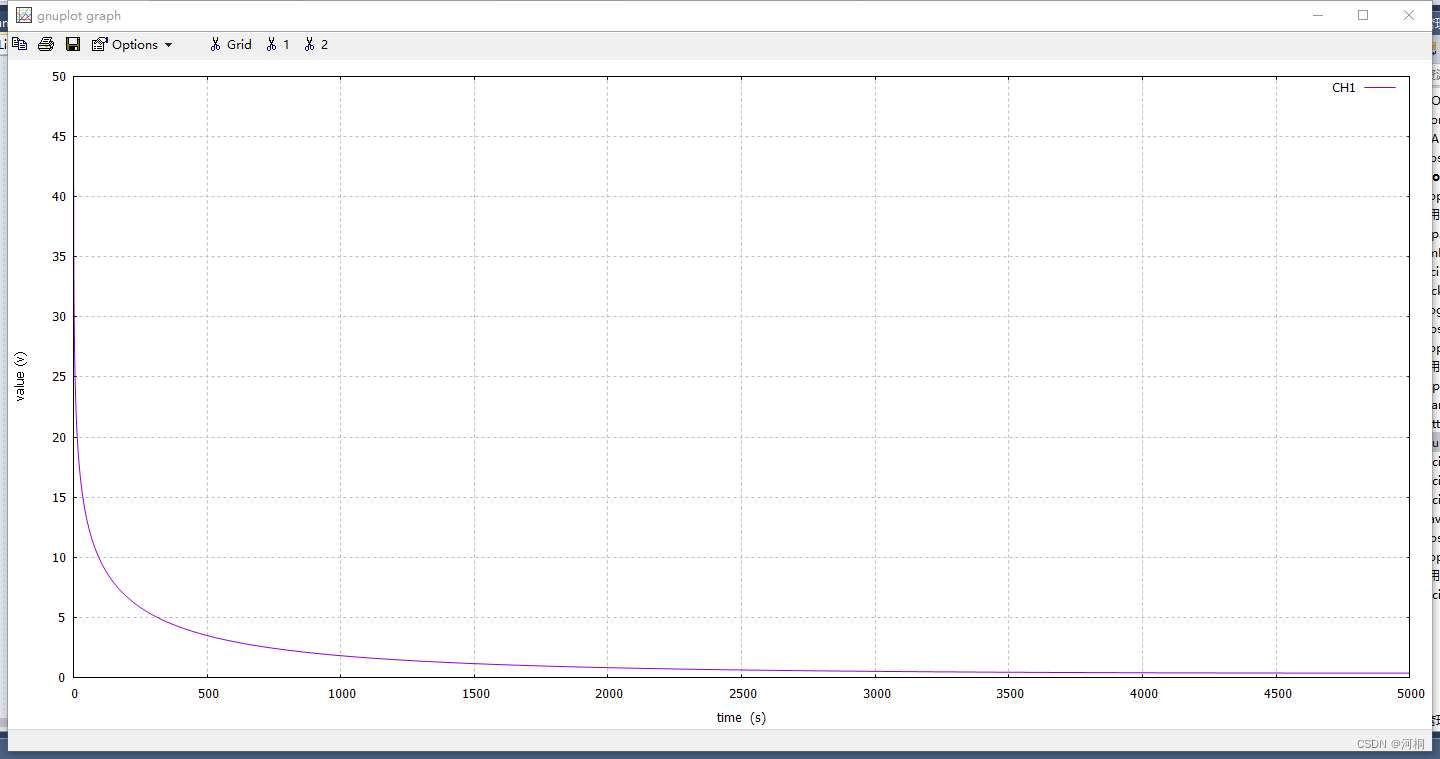
显示示意: