目前大多的互联网客户,在导入SSD之前,基本会要求OEM或者SSD厂商提供一些性能数据图,所以 作图也基本成了测试人员的必备技能,单盘的性能可以用Excel表格导入,但是复杂的可能会比较麻烦。就需要我们借助工具来作图了。
本篇文章简单介绍用plot工具对CPU和iostat采样的一个简单的shell脚本
一 fio lat 采样
1 生成一段监控lat的文件
fio --name=lat_plot --filename=/dev/sdb --ioengine=libaio --rw=read --bs=128k --iodepth=64 --numjobs=1 --runtime=30 --time_based --size=100m --direct=1 --thread=1 --write_lat_log=sdbread --log_avg_msec=1000
2 第一列代表时间;第二列代表延迟;第三列 0表示读
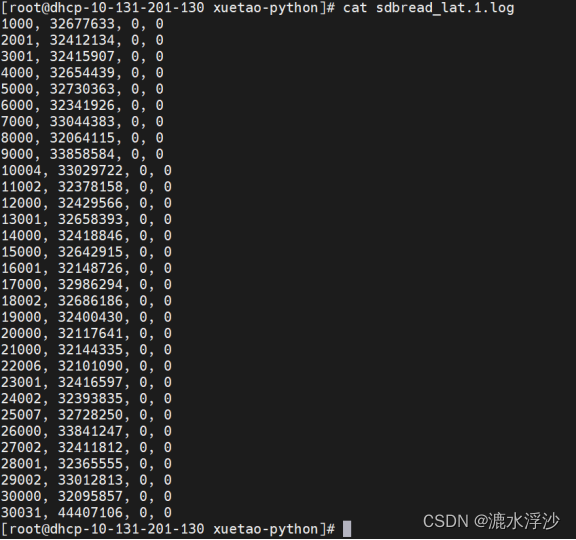
3 解析一下lat log, 方便作图
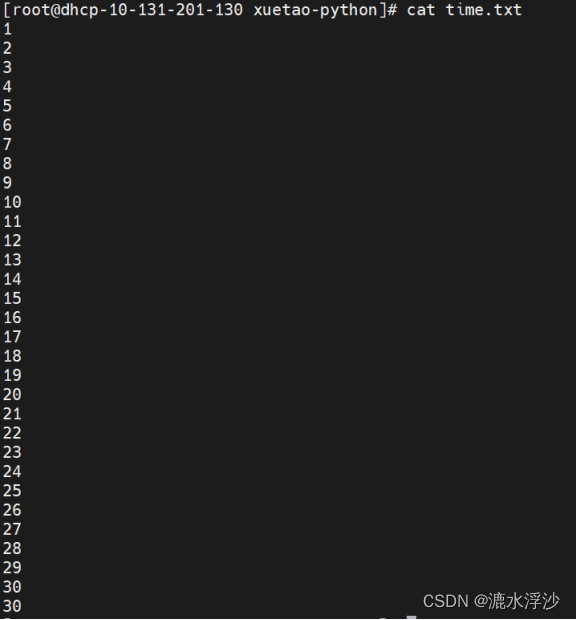
for time in `cat sdbread_lat.1.log |awk '{print $1}'|sed 's/,//g'`;do echo $(expr $time/1000|bc) >> time.txt;done
#将时间转化为秒
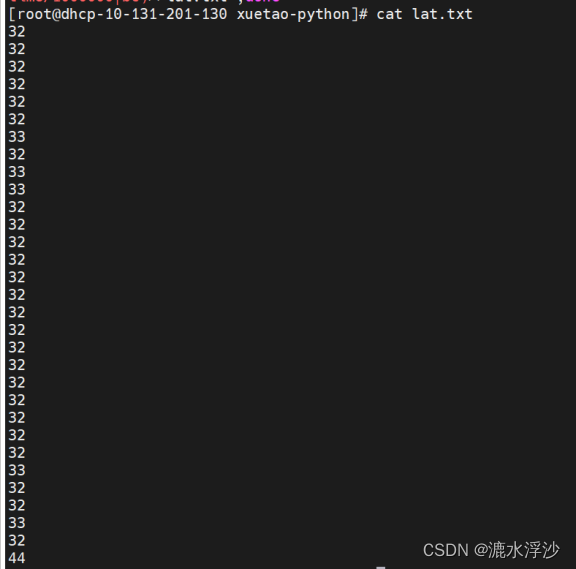
for time in `cat sdbread_lat.1.log |awk '{print $2}'|sed 's/,//g'`;do echo $(expr $time/1000000|bc)>>lat.txt ;done
#将延迟转化为ms
4 合并两列成为一个新的文档 方便作图
paste time.txt lat.txt >>time_lat.txt
5 配置一下plot参数
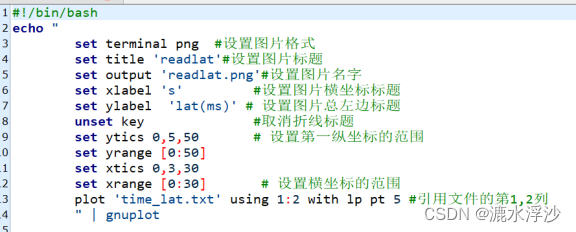
echo "
				set terminal png
                set title 'readlat'
                set output 'readlat.png'
                set xlabel 's'
                set ylabel  'lat(ms)'
				unset key
				set xtics 0,3,30
				set xrange [0:30]
				set ytics 0,5,50
				set yrange [0:50]
				set key bottom outside horizontal center
                plot 'time_lat.txt' using 1:2 with lp pt 5
        " |gnuplot
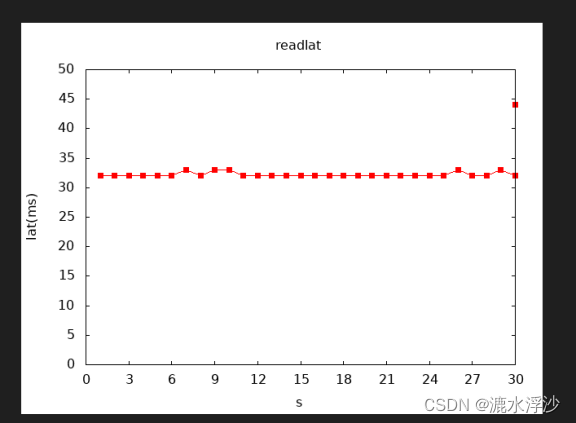
6 运行脚本 效果如下:
二 CPU核数采样
1 指令sar -P ALL 监控CPU每个核数的使用率
for i in {1…10};do sar -P ALL >>sar.log;sleep 1;done 每隔1秒 监控一次 共监控10次
2 cat sar.log |grep -i Average >sar_user.log
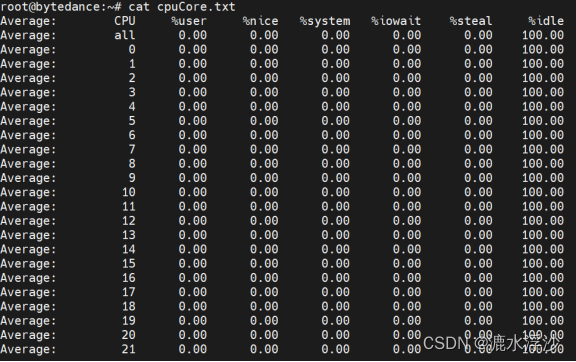
3 取每个CPU核数对应的占用率,并保存(需要写循环)
a.获取CPU核个数cat /proc/cpuinfo| grep “processor”| wc -l(总核数:物理核+逻辑核)

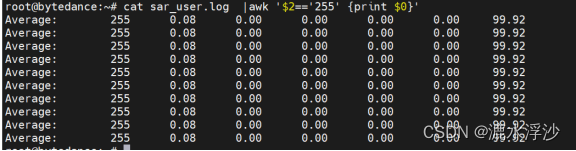
b.获取某个CPU核数的使用率 cat sar_user.log |awk ‘$2==‘255’ {print $0}’(获取255核数的 每次使用率)
c.获取CPU的最大核数: expr cat /proc/cpuinfo| grep "processor"| wc -l - 1

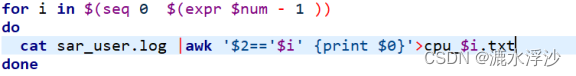
d.将每个核数的使用率转化为对应文档
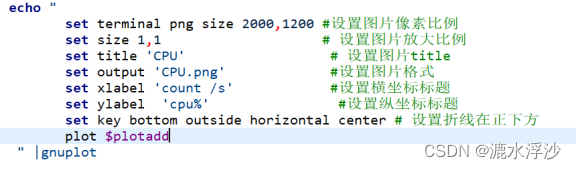
4 接下来是plot的一些固定格式:
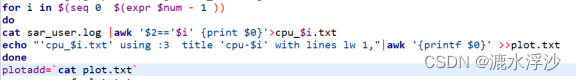
5 画线 ,需要把每个CPU核使用率的折线添加到图片
6 完整版代码如下:
#!/bin/bash
num=`cat /proc/cpuinfo| grep "processor"| wc -l`
for i in {1..10};do sar -P ALL >>sar.log;sleep 1;done
cat sar.log |grep -i Average >sar_user.log
for i in $(seq 0  $(expr $num - 1 ))
do
cat sar_user.log |awk '$2=='$i' {print $0}'>cpu_$i.txt
echo "'cpu_$i.txt' using :3  title 'cpu-$i' with lines lw 1,"|awk '{printf $0}' >>plot.txt
done
plotadd=`cat plot.txt`
       echo "
              set terminal png size 2000,1200
      	      set size 1,1
            	set title 'CPU'
            	set output 'CPU.png'
            	set xlabel 'count /s'
            	set ylabel  'cpu%'
              set key bottom outside horizontal center
            	plot $plotadd
      	" |gnuplot
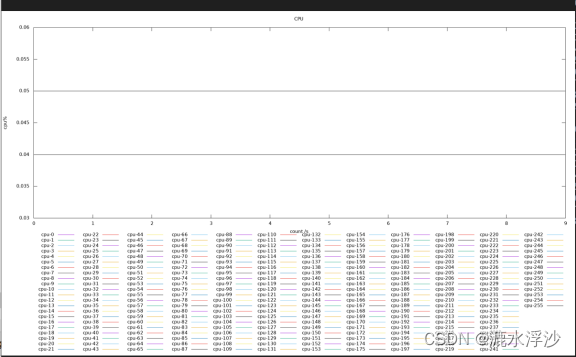
7 效果图如下:因为时间太短 显示不明显
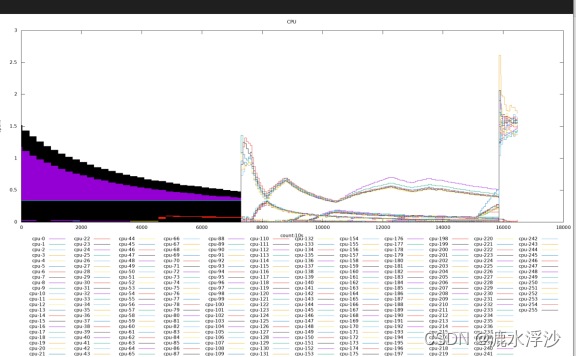
8 长时间对硬盘做读写的CPU监控图 如下图:
三 iostat 采样
1 首先准备一个有多盘IO数据的iostat log
2 获取iostat 要解析的数据的列
cat iostat.log |grep -i Device |head -1 | awk ‘{for (i=1;i<=NF;i++) {if ($i==“rMB/s”) {print i}}}’

3 写入循环中(因为其有9个盘,OS盘符是nvme0n1)

4 配置一下plot参数
#!/bin/bash
num_read=`cat iostat.log |grep -i Device |head -1 | awk '{for (i=1;i<=NF;i++) {if ($i=="rMB/s") {print i}}}'`
for nvme in nvme{1..9}n1
do
cat iostat.log |grep -i $nvme |sed 1,10d >${nvme}_read.txt
echo "'${nvme}_read.txt' using :$num_read title '${nvme}read' with lines lw 1," |awk '{printf $0}' >>plot_read.txt
done
plotread=`cat plot_read.txt`
echo "
set terminal png size 1200,900
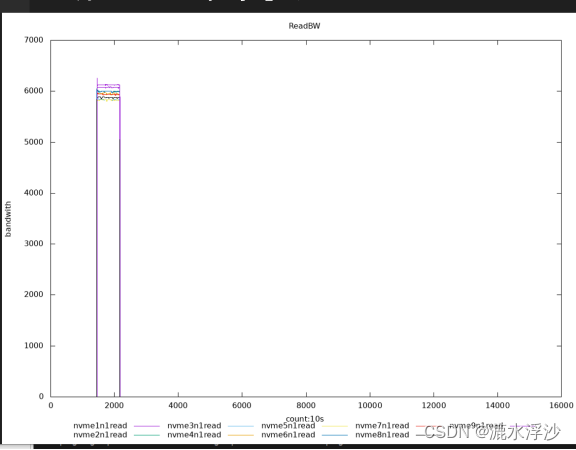
set title 'ReadBW'
set output 'readBW.png'
set xlabel 'count:10s'
set ylabel 'bandwith'
set key bottom outside horizontal center
plot $plotread
" | gnuplot
5 运行如下图